OpenTelemetry integrationedit
OpenTelemetry is a set of APIs, SDKs, tooling, and integrations that enable the capture and management of telemetry data from your services for greater observability. For more information about the OpenTelemetry project, see the spec.
Elastic OpenTelemetry integrations allow you to reuse your existing OpenTelemetry instrumentation to quickly analyze distributed traces and metrics to help you monitor business KPIs and technical components with the Elastic Stack.
There are two Elastic OpenTelemetry integrations available:
- Elastic exporter on the OpenTelemetry collector (recommmended)
- APM Server native support of OpenTelemetry protocol (experimental)
Elastic exporter on the OpenTelemetry collectoredit
The is the recommended OpenTelemetry integration. We have extended the "contrib" OpenTelemetry collector by adding an Elastic exporter so that you can drop this integration into your current OpenTelemetry setup.
The architecture consists of three main components.
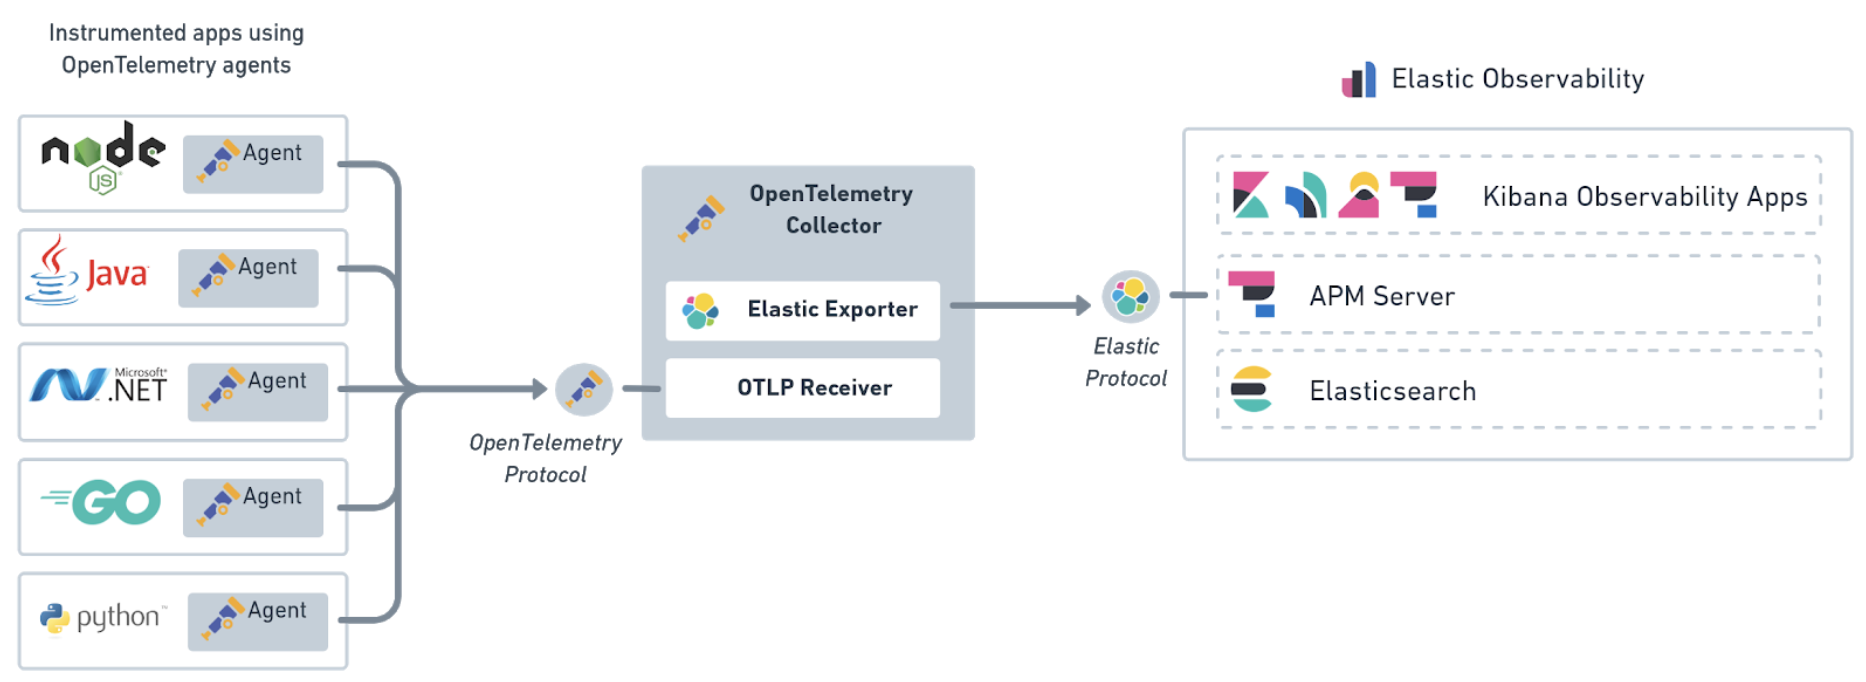
Agents |
The OpenTelemetry agents instrument the applications and export the telemetry data to the OpenTelemetry collector. |
OpenTelemetry collector |
The receiver collects the telemetry data from the OpenTelemetry agent, and then the processor defines optional transformations on the data before it’s exported using the Elastic exporter. |
Elastic exporter |
The exporter translates the OpenTelemetry data collected from your services, applications, and infrastructure to Elastic’s protocol. The data includes trace data and metrics data. By extending the OpenTelemetry collector, no changes are needed in your instrumented services to begin using the Elastic Stack. |
Download and configure the collectoredit
OpenTelemetry Collectors can be run as agents or as standalone collectors. They can be deployed as often as necessary and scaled up or out. Deployment planning resources are available in OpenTelemetry’s Getting Started documentation and Collector Performance research.
You can download the latest release of the Collector from the GitHub releases page. The Elastic exporter
lives in the opentelemetry-collector-contrib repository.
Docker images are available on dockerhub:
docker pull otel/opentelemetry-collector-contrib
To configure the collector, create a yaml configuration file.
This example configuration file accepts input from an OpenTelemetry Agent, processes the data, and sends it to an Elasticsearch Service instance.
  receivers:
    otlp:
      protocols:
        grpc:
          endpoint: 'localhost:4317'
    hostmetrics:
      collection_interval: 1m
      scrapers:
        load:
        memory:

  processors:
    batch: null

  exporters:
    elastic:
      apm_server_url: 'https://elasticapm.example.com'
      secret_token: 'APM_SERVER_SECRET_TOKEN'

  service:
    pipelines:
      metrics:
        receivers:
          - otlp
          - hostmetrics
        exporters:
          - elastic
      traces:
        receivers:
          - otlp
        processors:
          - batch
        exporters:
          - elastic
|
The |
|
|
At a minimum, you must define the URL of the APM Server instance you are sending data to. For additional configurations, like specifying an API key, secret token, or TLS settings, see the Elastic exporter configuration options. |
|
|
To translate metrics, you must define the Elastic exporter in |
|
|
To translate trace data, you must define the Elastic exporter in |
Once a receiver, processor, and exporter are defined, you can configure pipelines in your configuration’s services section.
The traces and metrics pipelines represent the path of trace data and metrics through your collector and bring all three of these components together.
You can also enable extensions for tasks like monitoring the health of the collector.
We recommend using Metricbeat to get a mature collector with more integrations and integrated visualizations to collect infrastructure metrics.
Elastic exporter configuration optionsedit
|
Elastic APM Server URL. (required). |
|
Credential for API key authorization. Must also be enabled in Elastic APM Server. (optional) |
|
Credential for secret token authorization. Must also be enabled in Elastic APM Server. (optional) |
|
Root Certificate Authority (CA) certificate for verifying the server’s identity if TLS is enabled. (optional) |
|
Client TLS certificate. (optional) |
|
Client TLS key. (optional) |
|
Disable verification of the server’s identity if TLS is enabled. (optional) |
Instrument applicationsedit
To export traces and metrics to the OpenTelemetry Collector, ensure that you have instrumented your services and applications with the OpenTelemetry API, SDK, or both. For example, if you are a Java developer, you need to instrument your Java app using the OpenTelemetry agent for Java.
By defining the following environment variables, you can customize the OTLP endpoint the agent will use to communicate with APM Server.
export OTEL_RESOURCE_ATTRIBUTES=service.name=frontend,service.version=1.1,deployment.environment=staging
export OTEL_EXPORTER_OTLP_ENDPOINT=https://apm_server_url:8200
java -javaagent:/path/to/opentelemetry-javaagent-all.jar \
     -jar target/frontend-1.1.jar
|
The service name to identify your application. |
|
APM Server URL. The host and port that APM Server listens for events on. |
You are now ready to collect traces and metrics, verify metrics, and visualize metrics in Kibana.
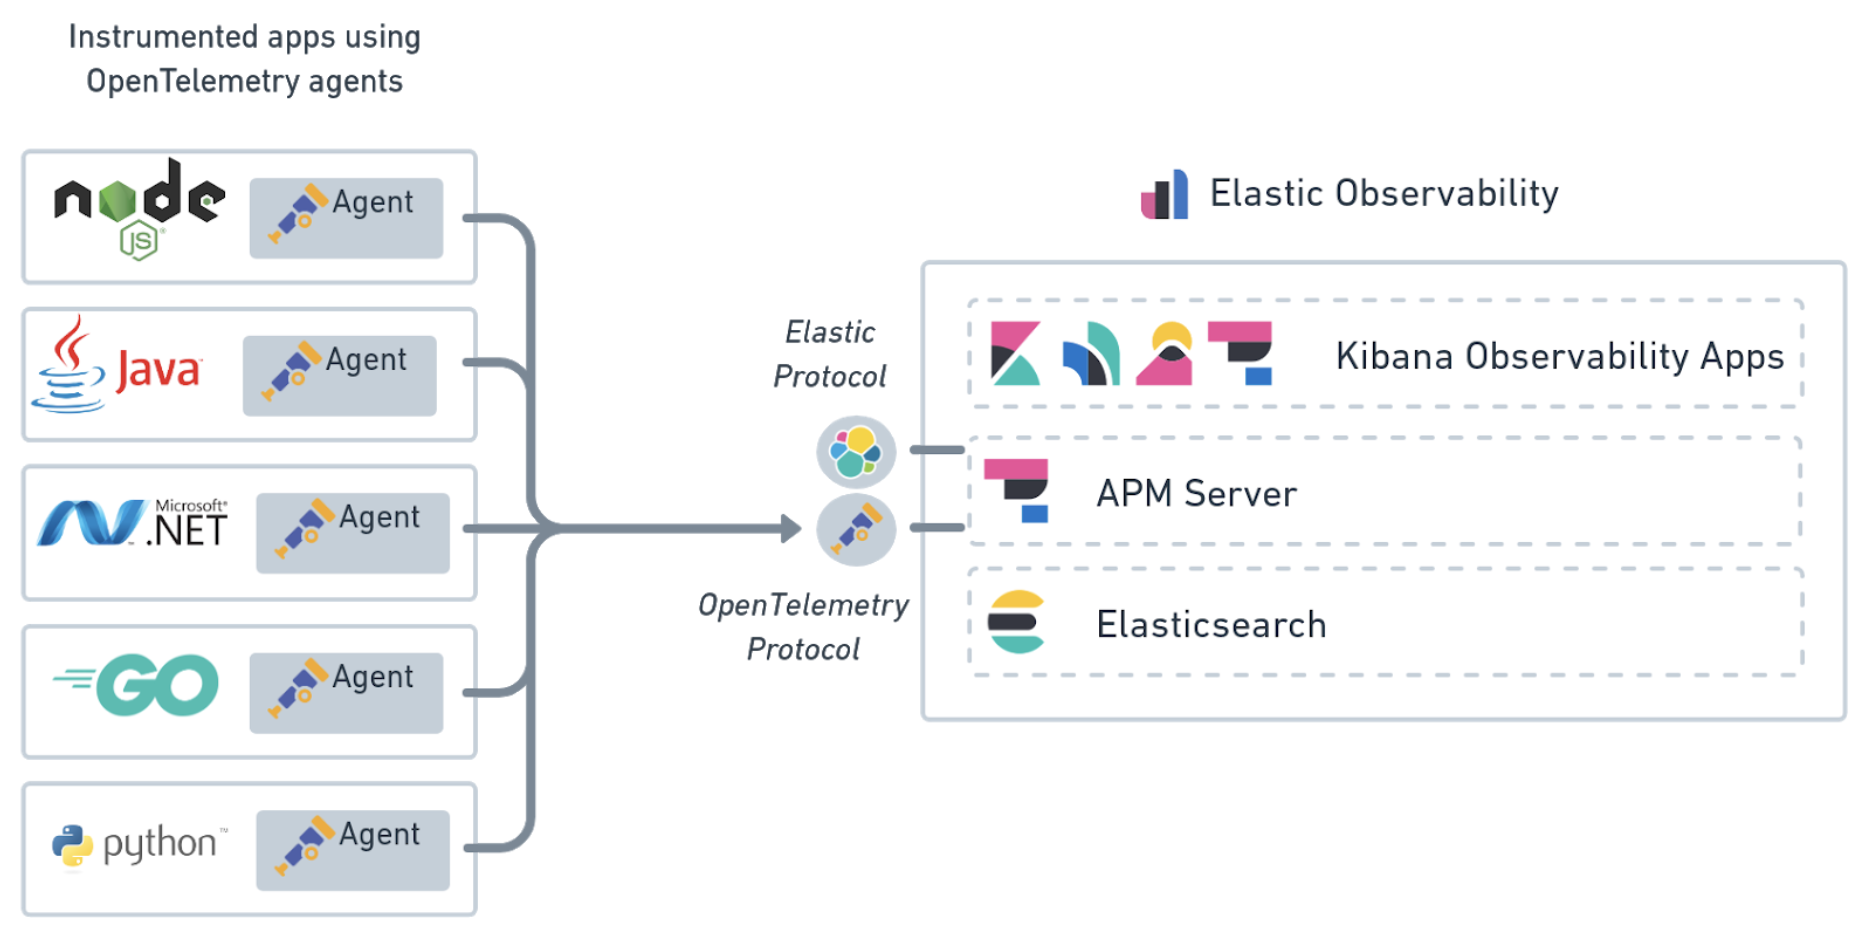
APM Server native support of OpenTelemetry protocoledit
This feature is experimental and may be changed in a future release. It is only available in a self-managed environment.
The APM Server native support of the OpenTelemetry protocol allows you to send collected telemetry data directly from your applications to APM Server. Trace data collected from your services and the metrics data collected from your applications and infrastructure are sent using the OpenTelemetry protocol.
Instrument applicationsedit
To export traces and metrics to APM Server, ensure that you have instrumented your services and applications with the OpenTelemetry API, SDK, or both. For example, if you are a Java developer, you need to instrument your Java app using the OpenTelemetry agent for Java.
By defining the following environment variables, you can customize the OTLP endpoint so that the OpenTelemetry agent communicates with APM Server.
export OTEL_RESOURCE_ATTRIBUTES=service.name=checkoutService,service.version=1.1,deployment.environment=production
export OTEL_EXPORTER_OTLP_ENDPOINT=https://apm_server_url:8200
export OTEL_EXPORTER_OTLP_HEADERS="authorization=Bearer apm_secret_token"
java -javaagent:/path/to/opentelemetry-javaagent-all.jar \
     -classpath lib/*:classes/ \
     com.mycompany.checkout.CheckoutServiceServer
|
The service name to identify your application. |
|
APM Server URL. The host and port that APM Server listens for events on. |
|
Authorization header that includes the Elastic APM Secret token or API key: For information on how to format an API key, see our API key docs. Please note the required space between |
|
Certificate for TLS credentials of the gRPC client. (optional) |
You are now ready to collect traces and metrics, verify metrics, and visualize metrics in Kibana.
Collect traces and metricsedit
To export traces and metrics, ensure that you have instrumented your services and applications with the OpenTelemetry API, SDK, or both.
Here is an example of how to capture business metrics from a Java application.
// initialize metric
Meter meter = GlobalMetricsProvider.getMeter("my-frontend");
DoubleCounter orderValueCounter = meter.doubleCounterBuilder("order_value").build();

public void createOrder(HttpServletRequest request) {

   // create order in the database
   ...
   // increment business metrics for monitoring
   orderValueCounter.add(orderPrice);
}
If collecting metrics, please note that the DoubleValueRecorder
and LongValueRecorder metrics are not yet supported.
Verify OpenTelemetry metrics dataedit
Use Discover to validate that metrics are successfully reported to Kibana.
-
Launch Kibana:
- Log in to your Elastic Cloud account.
- Navigate to the Kibana endpoint in your deployment.
Point your browser to http://localhost:5601, replacing
localhostwith the name of the Kibana host. - Open the main menu, then click Discover.
-
Select
apm-*as your index pattern. -
Filter the data to only show documents with metrics:
processor.name :"metric" -
Narrow your search with a known OpenTelemetry field. For example, if you have an
order_valuefield, addorder_value: *to your search to return only OpenTelemetry metrics documents.
Visualize in Kibanaedit
TSVB within Kibana is the recommended visualization for OpenTelemetry metrics. TSVB is a time series data visualizer that allows you to use the Elasticsearch aggregation framework’s full power. With TSVB, you can combine an infinite number of aggregations to display complex data.
In this example eCommerce OpenTelemetry dashboard, there are four visualizations: sales, order count, product cache, and system load. The dashboard provides us with business KPI metrics, along with performance-related metrics.
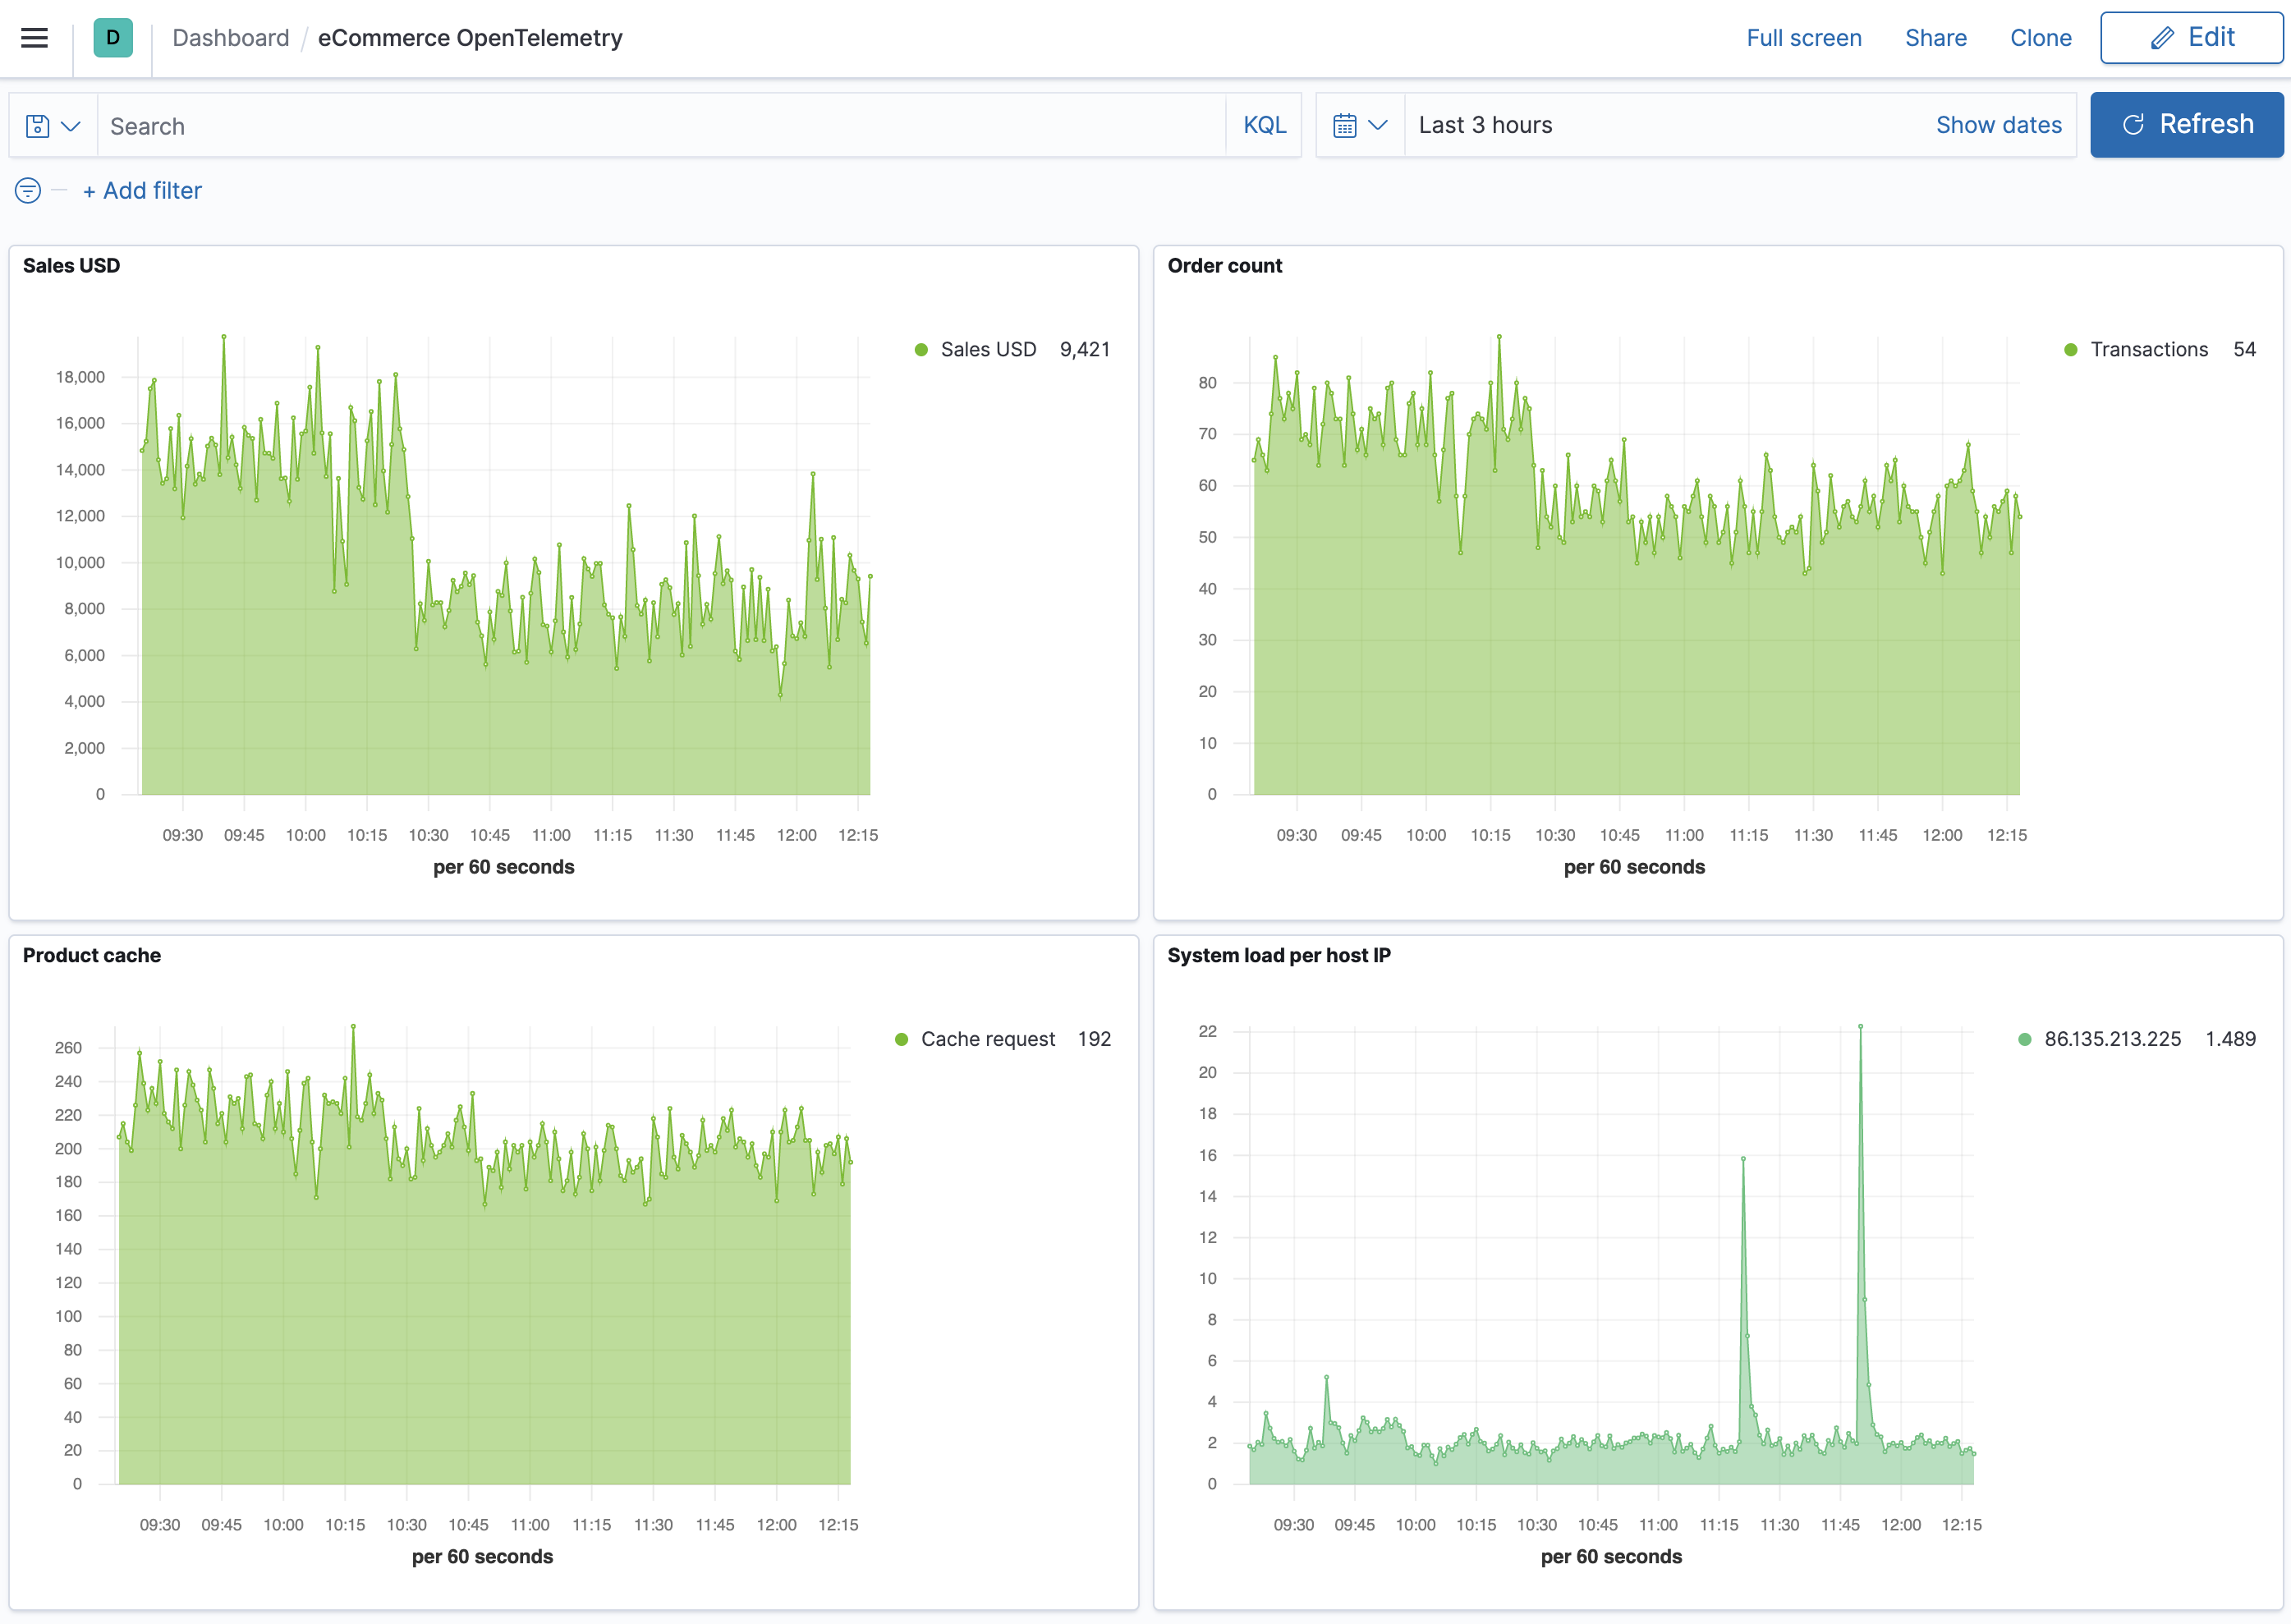
Let’s look at how this dashboard was created, specifically the Sales USD and System load visualizations.
- Open the main menu, then click Dashboard.
- Click Create dashboard.
- Click Save, enter the name of your dashboard, and then click Save again.
- Let’s add a Sales USD visualization. Click Edit.
- Click Create new and then select TSVB.
-
For the label name, enter Sales USD, and then select the following:
-
Aggregation:
Positive Rate. -
Field:
order_sum. -
Scale:
auto. -
Group by:
Everything
-
Aggregation:
- Click Save, enter Sales USD as the visualization name, and then click Save and return.
- Now let’s create a visualization of load averages on the system. Click Create new.
- Select TSVB.
-
Select the following:
-
Aggregation:
Average. -
Field:
system.cpu.load_average.1m. -
Group by:
Terms. -
By:
host.ip. -
Top:
10. -
Order by:
Doc Count (default). -
Direction:
Descending.
-
Aggregation:
-
Click Save, enter System load per host IP as the visualization name, and then click Save and return.
Both visualizations are now displayed on your custom dashboard.
By default, Discover shows data for the last 15 minutes. If you have a time-based index and no data displays, you might need to increase the time range.