OpenTelemetry integrationedit
Elastic’s OpenTelemetry integration allows you to reuse your existing OpenTelemetry instrumentation to quickly analyze distributed traces and metrics to help you monitor business KPIs and technical components with the Elastic Stack.
What is OpenTelemetry?edit
OpenTelemetry is a set of APIs, SDKs, tooling, and integrations that enable the creation and management of telemetry data. It formed through a merger of the OpenTracing and OpenCensus projects.
OpenTelemetry is an open-source project that provides the components necessary to observe your applications and services. If you’re unfamiliar with the project, see the spec for more information.
Elastic exporteredit
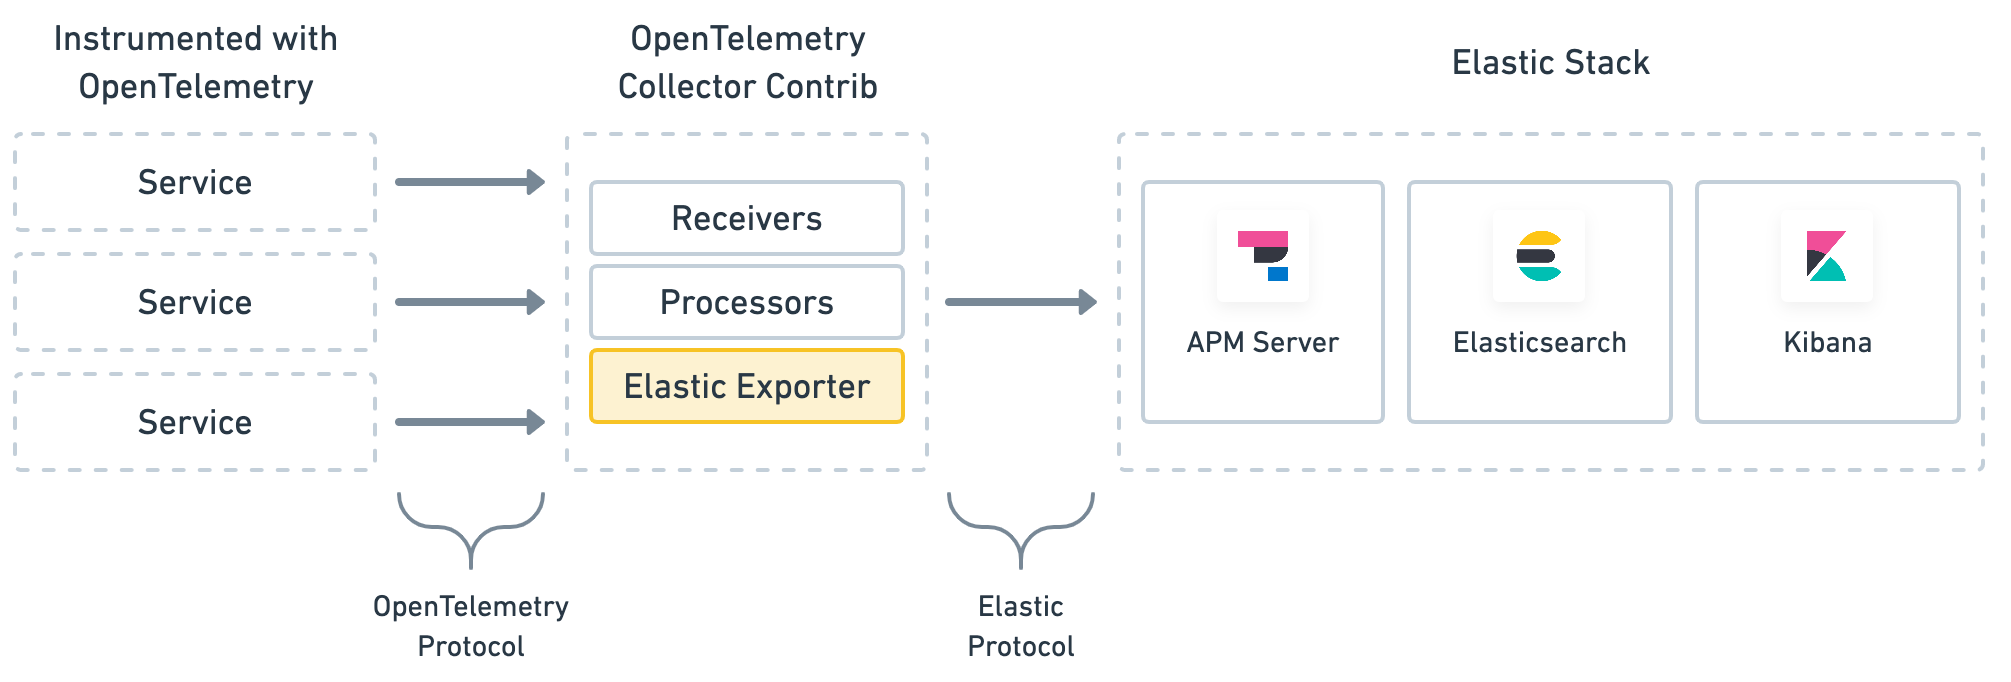
Elastic’s integration is designed to drop into your current OpenTelemetry setup. We’ve done this by extending the "contrib" OpenTelemetry collector and adding an Elastic exporter.
Before sending the data to the Elastic Stack, the exporter translates the OpenTelemetry trace data collected from your services and the metrics data collected from your applications and infrastructure to Elastic’s protocol. By extending the OpenTelemetry collector, no changes are needed in your instrumented services to begin using the Elastic Stack.
To collect infrastructure metrics, we still recommend using Metricbeat to get a mature collector with more integrations and integrated visualizations.
How the OpenTelemetry Collector worksedit
The OpenTelemetry collector uses the following three types of components to handle data:
-
receivers: Configure how data gets to the collector. At least one receiver must be configured. -
processors: Defines optional transformations that occur between receiving and exporting data. -
exporters: Configures how data is sent to its destination—in this case, the Elastic Stack.
Once a receiver, processor, and exporter is defined, pipelines can be configured in the services section of your configuration.
The traces and metrics pipelines define the path of trace data and metrics through your collector and bring all three of these components together.
More information is available in the OpenTelemetry pipeline docs.
A final note: extensions can also be enabled for tasks like monitoring the health of the collector.
See the OpenTelemetry extension readme for a list of supported extensions.
Get startededit
This guide assumes you’ve already instrumented your services with the OpenTelemetry API and/or SDK. If you haven’t, see the Elastic APM install and run guide to get started with Elastic APM Agents instead.
Plan your deploymentedit
OpenTelemetry Collectors can be run as an Agent, or as standalone collectors. They can be deployed as often as necessary and scaled up or out.
Deployment planning resources are available in OpenTelemetry’s Getting Started documentation and Collector Performance research.
Download the collectoredit
The Elastic exporter lives in the opentelemetry-collector-contrib repository,
and the latest release can be downloaded from GitHub releases page.
Docker images are available on dockerhub:
docker pull otel/opentelemetry-collector-contrib
Collect traces and metricsedit
This guide assumes your services and applications have already been instrumented with the OpenTelemetry API and/or SDK. If you are new to APM, we recommend getting started with Elastic APM agents instead.
To export traces and metrics to the OpenTelemetry Collector, ensure that you have instrumented your services and applications with the OpenTelemetry API and/or SDK.
Here is an example of how to set up the OpenTelemetry Java agent.
export OTEL_RESOURCE_ATTRIBUTES=service.name=frontend,service.version=1.0-SNAPSHOT,deployment.environment=staging
java -javaagent:/path/to/opentelemetry-javaagent-all-0.15.0.jar \
     -Dotel.otlp.endpoint=http://my-otel-collector.mycompany.com:4317 \
     -jar target/frontend-1.0-SNAPSHOT.jar
Here is an example of how to capture business metrics from an application.
// initialize metric
Meter meter = GlobalMetricsProvider.getMeter("my-frontend");
DoubleCounter orderValueCounter = meter.doubleCounterBuilder("order_value").build();

public void createOrder(HttpServletRequest request) {

   // create order in the database
   ...
   // increment business metrics for monitoring
   orderValueCounter.add(orderPrice);
}
For more information on setting up OpenTelemetry, see OpenTelemetry’s Getting Started.
Configure the collectoredit
Create a yaml configuration file.
This example configuration file accepts input from an OpenTelemetry Agent, processes the data, and sends it to an Elasticsearch Service instance.
  receivers:
    otlp:
      protocols:
        grpc:
          endpoint: 'localhost:4317'
    hostmetrics:
      collection_interval: 1m
      scrapers:
        load:
        memory:

  processors:
    batch: null

  exporters:
    elastic:
      apm_server_url: 'https://elasticapm.example.com'
      secret_token: 'APM_SERVER_SECRET_TOKEN'

  service:
    pipelines:
      metrics:
        receivers:
          - otlp
          - hostmetrics
        exporters:
          - elastic
      traces:
        receivers:
          - otlp
        processors:
          - batch
        exporters:
          - elastic
|
The |
|
|
At a minimum, you must define the URL of the APM Server instance you are sending data to. See the configuration reference for additional configuration options, like specifying an API key, secret token, or TLS settings. |
|
|
To translate metrics, the Elastic exporter must be defined in |
|
|
To translate trace data, the Elastic exporter must be defined in |
For more information about getting started with an OpenTelemetry Collector, see the OpenTelemetry collector docs.
Caveatsedit
If collecting metrics, please note that the DoubleValueRecorder
and LongValueRecorder metrics are not yet supported.
Verify OpenTelemetry metrics dataedit
Use Discover to validate that metrics are successfully being reported to Kibana.
-
Launch Kibana:
- Log in to your Elastic Cloud account.
- Navigate to the Kibana endpoint in your deployment.
Point your browser to http://localhost:5601, replacing
localhostwith the name of the Kibana host. - In the side navigation, under Kibana, select Discover.
-
Select
apm-*as your index pattern. -
Filter the data to only show documents with metrics:
processor.name :"metric" -
Narrow your search with a known OpenTelemetry field. For example, if you have an
order_valuefield, addorder_value: *to your search to return only OpenTelemetry metrics documents.
Visualize in Kibanaedit
TSVB within Kibana is the recommended visualization for OpenTelemetry metrics. TSVB is a time series data visualizer that allows you to use the full power of the Elasticsearch aggregation framework. With TSVB, you can combine an infinite number of aggregations to display complex data.
In this example eCommerce OpenTelemetry dashboard, there are four visualizations; sales, order count, product cache, and system load. The dashboard provides us with business KPI metrics, along with performance-related metrics.
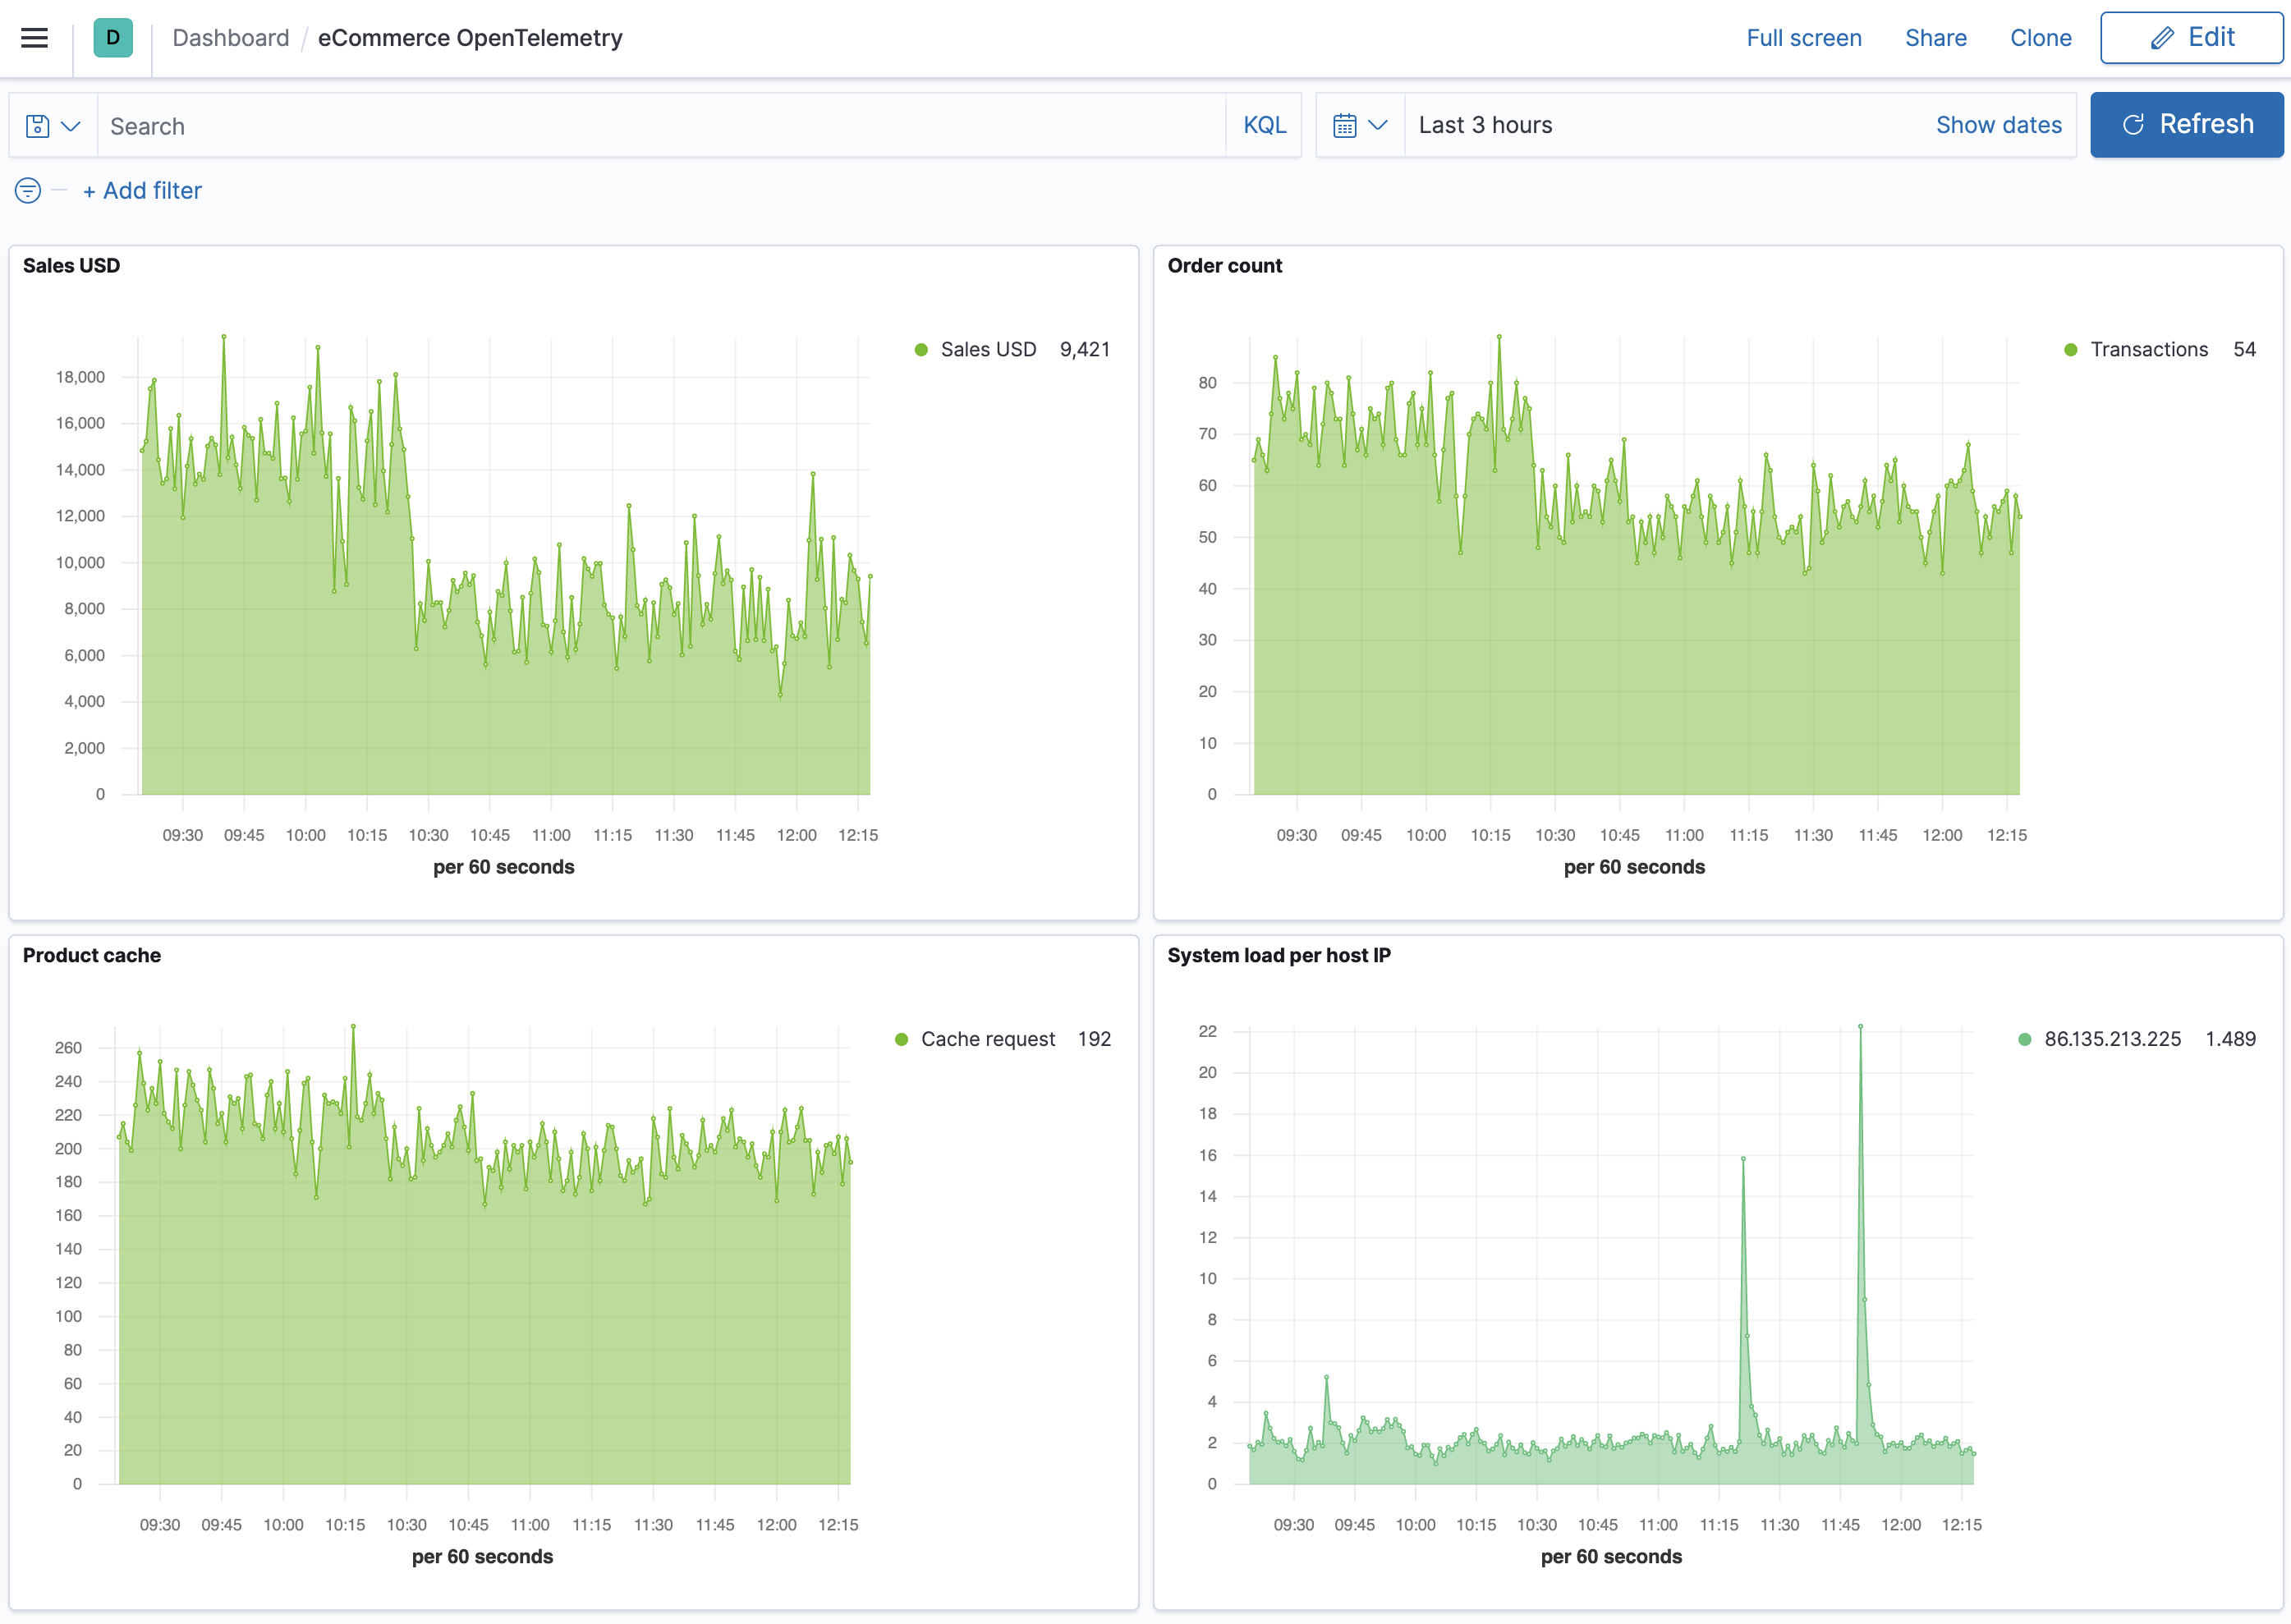
Let’s have a look at how this dashboard was created, specifically the Sales USD and System load visualizations.
- In the side navigation, under Kibana, select Dashboard.
- Click Create dashboard.
- Click Save, enter the name of your dashboard, and then click Save again.
- Let’s add a Sales USD visualization. Click Edit.
- Click Create new and then select TSVB.
-
For the label name, enter Sales USD, and then select the following:
-
Aggregation:
Positive Rate. -
Field:
order_sum. -
Scale:
auto. -
Group by:
Everything
-
Aggregation:
- Click Save, enter Sales USD as the visualization name, and then click Save and return.
- Now let’s create a visualization of load averages on the system. Click Create new.
- Select TSVB.
-
Select the following:
-
Aggregation:
Average. -
Field:
system.cpu.load_average.1m. -
Group by:
Terms. -
By:
host.ip. -
Top:
10. -
Order by:
Doc Count (default). -
Direction:
Descending.
-
Aggregation:
-
Click Save, enter System load per host IP as the visualization name, and then click Save and return.
Both visualizations are now displayed on your custom dashboard.
By default, Discover shows data for the last 15 minutes. If you have a time-based index, and no data displays, you might need to increase the time range.
Elastic exporter configuration referenceedit
apm_server_urledit
Elastic APM Server URL. (required)
api_keyedit
Credential for API key authorization. Must also be enabled in Elastic APM Server. (optional)
secret_tokenedit
Credential for secret token authorization. Must also be enabled in Elastic APM Server. (optional)
ca_fileedit
Root Certificate Authority (CA) certificate, for verifying the server’s identity if TLS is enabled. (optional)
cert_fileedit
Client TLS certificate. (optional)
key_fileedit
Client TLS key. (optional)
insecureedit
Disable verification of the server’s identity if TLS is enabled. (optional)