WARNING: Version 6.2 of APM Server has passed its EOL date.
This documentation is no longer being maintained and may be removed. If you are running this version, we strongly advise you to upgrade. For the latest information, see the current release documentation.
Overviewedit
APM is an application performance monitoring system built on the Elastic Stack. It uses Elasticsearch as its data store and allows you to monitor performance of thousands of services in real time.
With APM, you can automatically collect detailed performance information from inside your service with only minor changes to your code. APM agents will automatically instrument your code and measure the response time for incoming requests. It also automatically measures what your service was doing while it was preparing the response. For example, external database queries are measured to make it easy to detect slow queries. It also measures calls to caches, external HTTP requests etc. This makes it possible to pinpoint and fix performance problems and unhandled errors quickly and with minimal effort.
APM also automatically collects errors and exceptions that are not handled by your service. When errors and exceptions get collected, they automatically get a checksum assigned based primarily of the stacktrace. This makes it possible to discern new errors from errors that have been happening for some time. It also makes it much easier to keep an eye on how many times specific errors happen.
APM Componentsedit
Elastic APM consists of four components:
- Elasticsearch
- APM agents
- APM Server
- Kibana APM UI
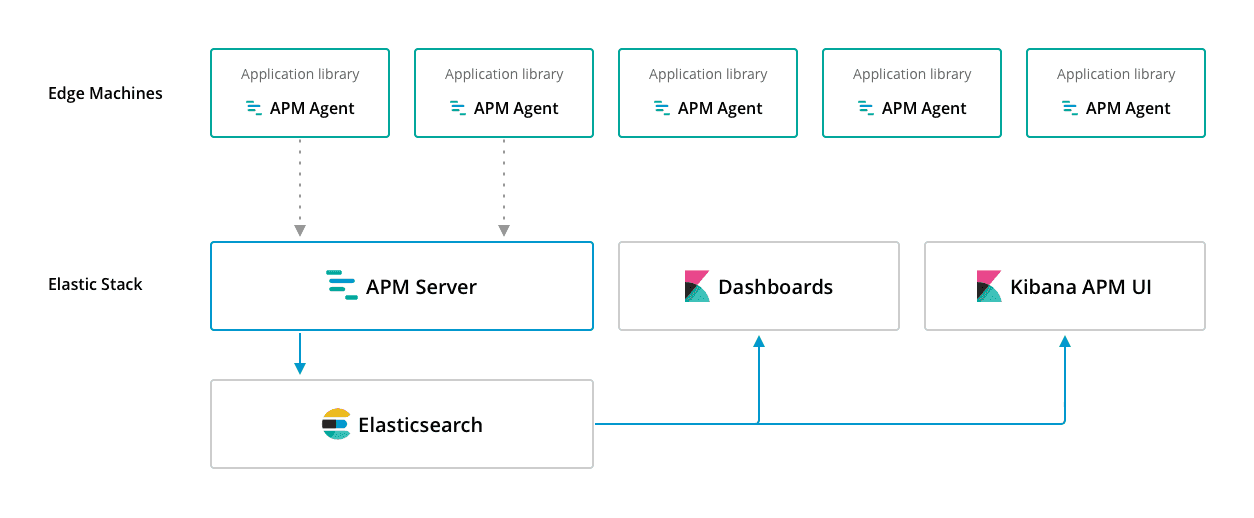
APM agents are open source libraries written in the same language as your service. You install them into your service as you would install any other library. The agents hook into your service and start collecting performance metrics and errors automatically once it starts. All data that gets collected by agents is buffered for a short period and sent on to APM Server. This happens once per minute, by default.
Out of the box, APM automatically instruments most popular web frameworks, database drivers, calls to caching servers, and HTTP libraries for requests to external services. For everything else, the agents provide an API that you can call from your service to manually instrument anything you find interesting.
APM Server is an open source application written in Go which runs on your servers. It listens on port 8200 by default and receives data from agents periodically. The API is a simple JSON based HTTP API. APM Server builds Elasticsearch documents from the data received from agents. These documents are stored in an Elasticsearch cluster. A single APM Server process can typically handle data from hundreds of agents.
To visualize the data after it’s sent to Elasticsearch, you can use the pre-built, open source Kibana dashboards that come with APM Server.
We designed Elastic APM to run on anything from a regular laptop to thousands of machines, and it’s easy to get started.