Troubleshoot APM .NET agent
Use the information in this section to troubleshoot common problems and find answers for frequently asked questions. As a first step, ensure your stack is compatible with the Agent’s supported technologies.
Don’t worry if you can’t figure out what the problem is; we’re here to help. If you are an existing Elastic customer with a support contract, create a ticket in the Elastic Support portal. If not, post in the APM discuss forum.
Attach your debug logs so that we can analyze the problem. Upload the complete logs to a service like https://gist.github.com. The logs should include everything from the application startup up until the first request has been executed.
If neither errors nor performance metrics are being sent to the APM Server, it’s a good idea to first check your logs and look for output just as the app starts.
If you don’t see anything suspicious in the agent logs (no warning or error), it’s recommended to turn the log level to Trace for further investigation.
The easiest way to get debug information from the Agent, regardless of the way it’s run, is to enable global file logging.
Specifying at least one of the following environment variables will ensure the agent logs to a file
OTEL_LOG_LEVEL(optional)-
The log level at which the profiler should log. Valid values are
- trace
- debug
- info
- warn
- error
- none
The default value is warn. More verbose log levels like trace and debug can affect the runtime performance of profiler auto instrumentation, so are recommended only for diagnostics purposes.
if ELASTIC_OTEL_LOG_TARGETS is not explicitly set to include file global file logging will only be enabled when configured with trace or debug.
OTEL_DOTNET_AUTO_LOG_DIRECTORY(optional)-
The directory in which to write log files. If unset, defaults to
%PROGRAMDATA%\elastic\apm-agent-dotnet\logson Windows/var/log/elastic/apm-agent-dotneton Linux
The user account under which the profiler process runs must have permission to write to the destination log directory. Specifically, ensure that when running on IIS, the AppPool identity has write permissions in the target directory.
ELASTIC_OTEL_LOG_TARGETS(optional)-
A semi-colon separated list of targets for profiler logs. Valid values are
- file
- stdout
The default value is file if OTEL_DOTNET_AUTO_LOG_DIRECTORY is set or OTEL_LOG_LEVEL is set to trace or debug.
If you added the agent to your application as per the ASP.NET Core document with the AddAllElasticApm or AddElasticApm method, it will integrate with the ASP.NET Core logging infrastructure. This means the Agent will pick up the configured logging provider and log as any other component logs.
In this scenario, the LogLevel APM agent configuration (e.g. setting the ELASTIC_APM_LOG_LEVEL environment variable) DOES NOT control the verbosity of the agent logs. The agent logs are controlled by the ASP.NET Core logging configuration from IConfiguration, typically configured via appsettings.json.
For example, the following configuration in appsettings.json limits APM agents logs to those with a log level of Warning or higher:
"Logging": {
  "LogLevel": {
    "Default": "Information",
    "Elastic.Apm": "Warning"
  }
},
- Control the verbosity of the agent logs by setting the log level for the
Elastic.Apmcategory
If you have a logging system in place such as NLog, Serilog, or similar, you can direct the agent logs into your logging system by creating an adapter between the agent’s internal logger and your logging system.
First implement the IApmLogger interface from the Elastic.Apm.Logging namespace:
internal class ApmLoggerAdapter : IApmLogger
{
  private readonly Lazy<Logger> _logger;
  public bool IsEnabled(ApmLogLevel level)
  {
    // Check for log level here.
    // Typically you just compare the configured log level of your logger
    // to the input parameter of this method and return if it's the same/higher or not
  }

  public void Log<TState>(ApmLogLevel apmLogLevel, TState state, Exception e, Func<TState, Exception, string> formatter)
  {
    // You can log the given log into your logging system here.
  }
}
An example implementation for NLog can be seen in our GitHub repository.
Then tell the agent to use the ApmLoggerAdapter. For ASP.NET (classic), place the following code into the Application_Start method in the HttpApplication implementation of your app which is typically in the Global.asax.cs file:
using Elastic.Apm.AspNetFullFramework;

namespace MyApp
{
  public class MyApplication : HttpApplication
  {
    protected void Application_Start()
    {
      AgentDependencies.Logger = new ApmLoggerAdapter();

      // other application setup...
    }
  }
}
During initialization, the agent checks if an additional logger was configured—the agent only does this once, so it’s important to set it as early in the process as possible, typically in the Application_Start method.
If none of the above cases apply to your application, you can still use a logger adapter and redirect agent logs into a .NET logging system like NLog, Serilog, or similar.
For this you’ll need an IApmLogger implementation (see above) which you need to pass to the Setup method during agent setup:
Agent.Setup(new AgentComponents(logger: new ApmLoggerAdapter()));
If you receive trace data for some but not all transactions, you should check the two main variables which control sampling of transactions.
The first variable is the transaction sample rate. To reduce volume, this configuration option may specify a reduced sampling rate. To sample all transactions, ensure that this is either set to 1, or not set at all. By default, the agent samples every transaction (every request to your service). ```
The second variable is context propagation. To facilitate distributed tracing, the W3C specification
defines a trace context, used to transfer a trace across service boundaries.
For web applications, this occurs through the traceparent header. Of specific importance for this issue is
a flag defined on that context, the sampled flag.
This flag allows a sampling decision made earlier in a distributed trace to continue onto downstream services, and the .NET APM agent honours this automatically. When a request comes in with the sampling flag unset (not sampled), the agent will not record a trace in the instrumented service either. This is by design to avoid collecting incomplete traces.
When all services within a distributed system are managed and instrumented using Elastic APM agents and communication
is internal, the default behaviour is usually correct. If some requests to instrumented applications may come from
external users, then the traceparent header cannot be controlled. In these cases, it's often incorrect to allow
an outside party to control what transactions are recorded through the sampled flag.
To control the context propagation behaviour, we have a trace continuation strategy option. Choose either restart or restart_external. restart will ignore
the sampling flag on all requests and always include a transaction for the trace. restart_external is similar,
however it uses an extra header to detect if the calling service was instrumented by an Elastic APM agent. If so,
it honors the sampling flag; if not (such as for an external request), it forces the trace to be sampled.
See "An InstanceAlreadyCreatedException exception is thrown".
In the early stage of a monitored process, the Agent might throw an InstanceAlreadyCreatedException exception with the following message: "The singleton APM agent has already been instantiated and can no longer be configured.", or an error log appears with the same message. This happens when you attempt to initialize the Agent multiple times, which is prohibited. Allowing multiple Agent instances per process would open up problems, like capturing events and metrics multiple times for each instance, or having multiple background threads for event serialization and transfer to the APM Server.
Take a look at the initialization section of the Public Agent API for more information on how agent initialization works.
As an example, this issue can happen if you call the Elastic.Apm.Agent.Setup method multiple times, or if you call another method on Elastic.Apm.Agent that implicitly initializes the agent, and then you call the Elastic.Apm.Agent.Setup method on the already initialized agent.
Another example might be when you use the Public Agent API in combination with the IIS module or the ASP.NET Core NuGet package, where you enable the agent with the AddElasticApm or UseAllElasticApm methods. Both the first call to the IIS module and the AddElasticApm/AddllElasticApm methods internally call the Elastic.Apm.Agent.Setup method to initialize the agent.
You may use the Public Agent API with the Elastic.Apm.Agent class in code that can potentially execute before the IIS module initializes or the AddElasticApm/AddAllElasticApm calls execute. If that happens, those will fail, as the Agent has been implicitly initialized already.
To prevent the InstanceAlreadyCreatedException in these scenarios, first use the Elastic.Apm.Agent.IsConfigured method to check if the agent is already initialized. After the check, you can safely use other methods in the Public Agent API. This will prevent accidental implicit agent initialization.
If you see this warning being logged it means your classic ASP.NET Application is running under quirks mode and is using a deprecated but backwards compatible asynchronous context. This may prevent our agent from working correctly when asynchronous code introduces a thread switch since this context does not reliably restore HttpContext.Items.
To break out of quirks mode the runtime must be explicitly specified in web.config:
<httpRuntime targetFramework="4.5" />
Read more about ASP.NET quirks mode here: https://devblogs.microsoft.com/dotnet/all-about-httpruntime-targetframework
We log this warning when our SQL even listener is unable to find the active transaction. This has been only observed under IIS when the application is running under quirks mode. See "ASP.NET is using LegacyAspNetSynchronizationContext and might not behave well for asynchronous code" section for more backfround information and possible fixes.
We log this trace warning when our outgoing HTTP listener is not able to get the current transaction. This has been only observed under IIS when the application is running under quirks mode. See "ASP.NET is using LegacyAspNetSynchronizationContext and might not behave well for asynchronous code" section for more backfround information and possible fixes.
This exception happens if the classic ASP.NET application run under an Application pool that enforces the classic pipeline mode. This prevents our agent to modify headers and thus will break distributed tracing.
The agent is only supported on IIS7 and higher where the Integrated Pipeline Mode is the default.
If the startup hook integration throws an exception, additional detail can be obtained through enabling the global log collection.
A good place to start is All options summary. There are multiple settings with the Performance keyword which can help you tweak the agent for your needs.
The most expensive operation in the agent is typically stack trace capturing. The agent, by default, only captures stack traces for spans with a duration of 5ms or more, and with a limit of 50 stack frames. If this is too much in your environment, consider disabling stack trace capturing either partially or entirely:
- To disable stack trace capturing for spans, but continue to capture stack traces for errors, set the
SpanStackTraceMinDuration(performance) to-1and leave theStackTraceLimit(performance) on its default. - To disable stack trace capturing entirely –which in most applications reduces the agent overhead dramatically– set
StackTraceLimit(performance) to0.
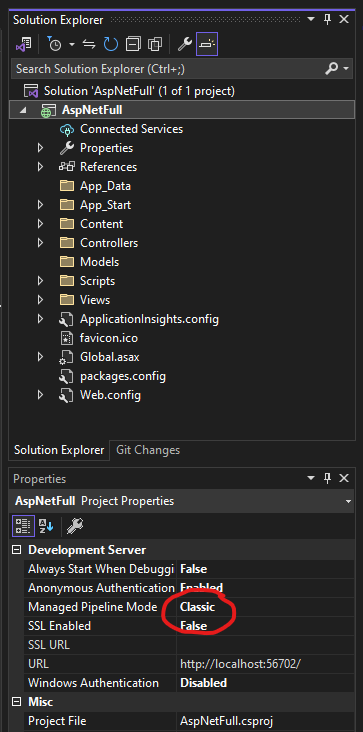
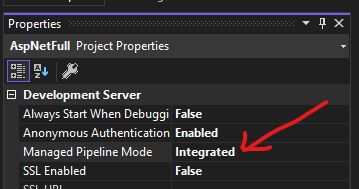
When debugging applications using Visual Studio and IISExpress, the same requirement to use the Integrated managed pipeline mode exists. Select your web application project in the solution explorer and press F4 to load the properties window. If the managed pipeline mode is set to classic, the ElasticApmModule will not load.
For example:

Should be changed to:

You may need to restart Visual Studio for these changes to fully apply.
Azure/ASE adds trace headers set to unsampled for incoming requests to the cluster.
Elastic APM .NET Agent (and likely also other agents which correctly handle the W3C Trace Parent header sampling) will obey to the traceparent header sampling of the incoming request. As a consequence, the traces/spans will not be sent to APM Server/Integration and therefore APM UI will not show anything.
We recommend using trace_continuation_strategy set to restart or restart_external, so that the APM .NET Agent will ignore the incoming traceparent header sampling flag.