Logs Explorer
editLogs Explorer
editThis functionality is in beta and is subject to change. The design and code is less mature than official GA features and is being provided as-is with no warranties. Beta features are not subject to the support SLA of official GA features.
With Logs Explorer, you can quickly search and filter your log data, get information about the structure of log fields, and display your findings in a visualization. You can also customize and save your searches and place them on a dashboard. Instead of having to log into different servers, change directories, and view individual files, all your logs are available in a single view.
From the Observability navigation menu, click Explorer under the Logs heading to open Logs Explorer.
Required Kibana privileges
editViewing data in Logs Explorer requires read privileges for Discover and Integrations. For more on assigning Kibana privileges, refer to the Kibana privileges docs.
Find your logs
editBy default, Logs Explorer shows all of your logs. If you need to focus on logs from a specific integration, select the integration from the logs menu:

Once you have the logs you want to focus on displayed, you can drill down further to find the information you need. For more on filtering your data in Logs Explorer, refer to Filter logs in Log Explorer.
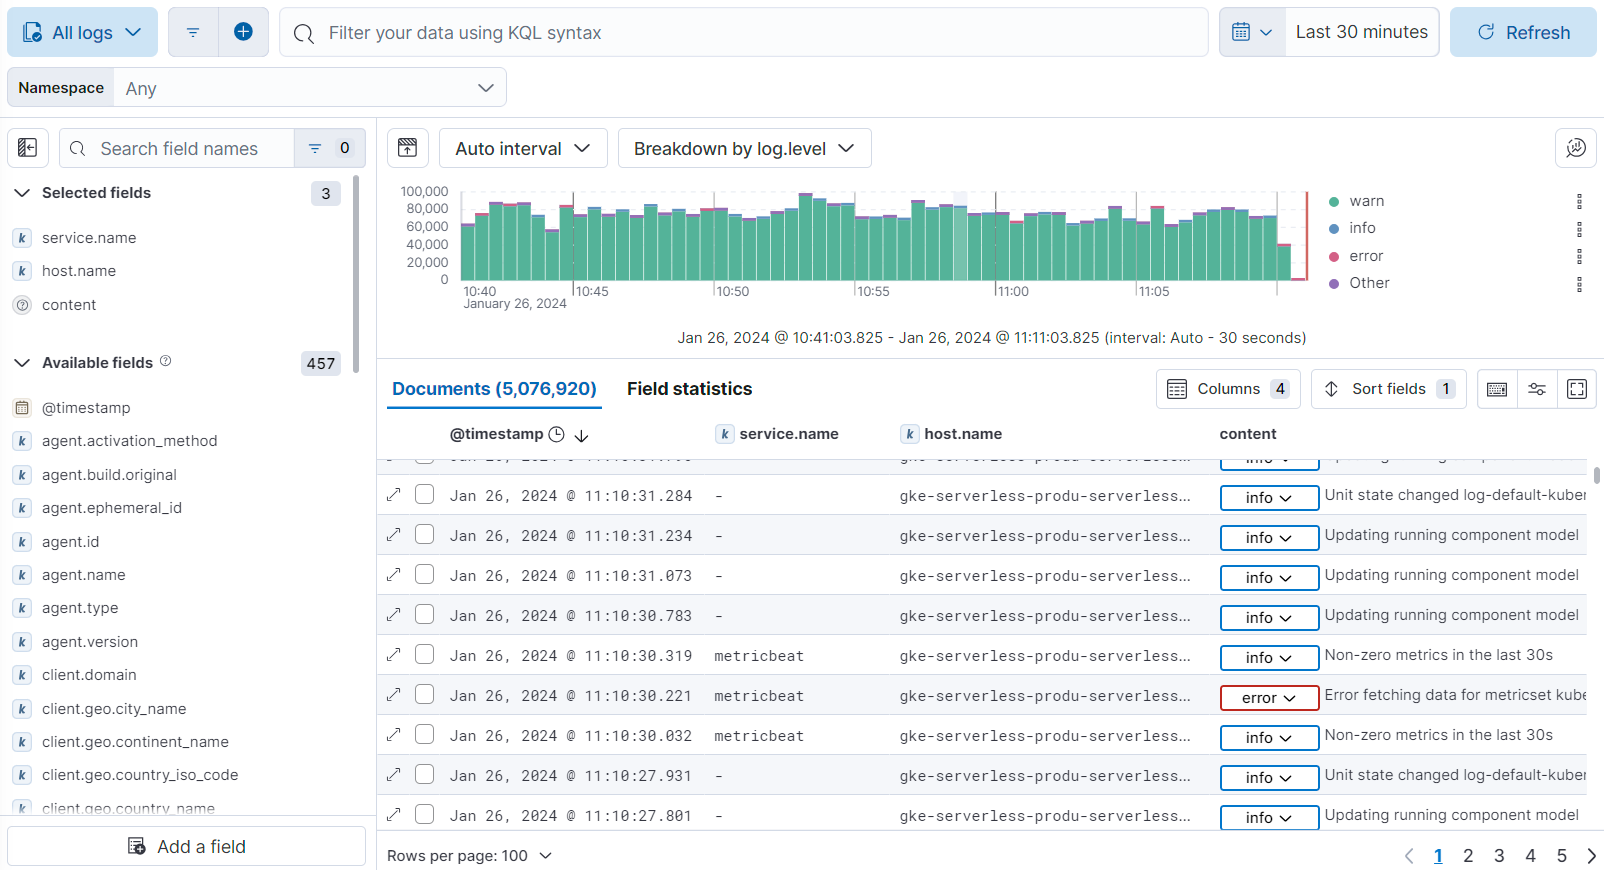
Review log data in the documents table
editThe documents table in Logs Explorer functions similarly to the table in Discover. You can add fields, order table columns, sort fields, and update the row height in the same way you would in Discover.
Refer to the Discover documentation for more information on updating the table.
Analyze data with smart fields
editSmart fields are dynamic fields that provide valuable insight on where your log documents come from, what information they contain, and how you can interact with them. The following sections detail the smart fields available in Logs Explorer.
The resource smart field shows where your logs are coming from by displaying fields like service.name, container.name, orchestrator.namespace, host.name, and cloud.instance.id.
Use this information to see where issues are coming from and if issues are coming from the same source.
The content smart field shows your logs' log.level and message fields.
If neither of these fields are available, the content smart field will show the error.message or event.original field.
Use this information to see your log content and inspect issues.
The actions smart field provides access to additional information about your logs.
Expand: ![]() Open the log details to get an in-depth look at an individual log file.
Open the log details to get an in-depth look at an individual log file.
Degraded document indicator: ![]() Shows if any of the document’s fields were ignored when it was indexed.
Ignored fields could indicate malformed fields or other issues with your document. Use this information to investigate and determine why fields are being ignored.
Shows if any of the document’s fields were ignored when it was indexed.
Ignored fields could indicate malformed fields or other issues with your document. Use this information to investigate and determine why fields are being ignored.
Stacktrace indicator: ![]() Shows if the document contains stack traces.
This indicator makes it easier to navigate through your documents and know if they contain additional information in the form of stack traces.
Shows if the document contains stack traces.
This indicator makes it easier to navigate through your documents and know if they contain additional information in the form of stack traces.
View log details
editClick the expand icon ![]() to get an in-depth look at an individual log file.
to get an in-depth look at an individual log file.
These details provide immediate feedback and context for what’s happening and where it’s happening for each log. From here, you can quickly debug errors and investigate the services where errors have occurred.
The following actions help you filter and focus on specific fields in the log details:
-
Filter for value (
 ): Show logs that contain the specific field value.
-
Filter out value (
 ): Show logs that do not contain the specific field value.
-
Filter for field present (
 ): Show logs that contain the specific field.
-
Toggle column in table (
 ): Add or remove a column for the field to the main Logs Explorer table.