Observability goes beyond monitoring; it's about truly understanding your system. To achieve this comprehensive view, practitioners need a unified observability solution that natively combines insights from metrics, logs, traces, and crucially, continuous profiling. While metrics, logs, and traces offer valuable insights, they can't answer the all-important "why." Continuous profiling signals act as a magnifying glass, providing granular code visibility into the system's hidden complexities. They fill the gap left by other data sources, enabling you to answer critical questions –– why is this trace slow? Where exactly in the code is the bottleneck residing?
Traces provide the "what" and "where" — what happened and where in your system. Continuous profiling refines this understanding by pinpointing the "why" and validating your hypotheses about the "what." Just like a full-body MRI scan, Elastic's whole-system continuous profiling (powered by eBPF) uncovers unknown-unknowns in your system. This includes not just your code, but also third-party libraries and kernel activity triggered by your application transactions. This comprehensive visibility improves your mean-time-to-detection (MTTD) and mean-time-to-recovery (MTTR) KPIs.
[Related article: Why metrics, logs, and traces aren’t enough]
Bridging the disconnect between continuous profiling and OTel traces
Historically, continuous profiling signals have been largely disconnected from OpenTelemetry (OTel) traces. Here's the exciting news: we're bridging this gap! We're introducing native correlation between continuous profiling signals and OTel traces, starting with Java.
Imagine this: You're troubleshooting a performance issue and identify a slow trace. Whole-system continuous profiling steps in, acting like an MRI scan for your entire codebase and system. It narrows down the culprit to the specific lines of code hogging CPU time within the context of your distributed trace. This empowers you to answer the "why" question with minimal effort and confidence, all within the same troubleshooting context.
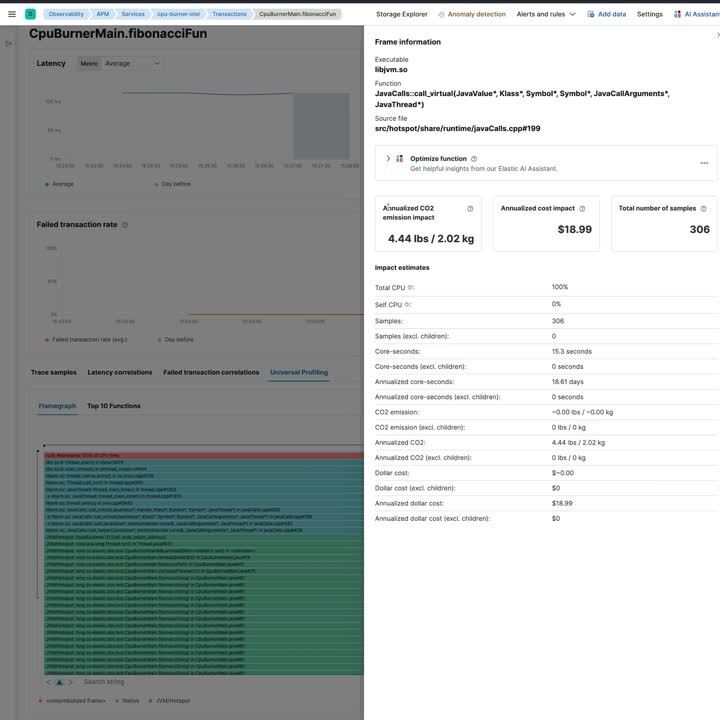
Furthermore, by correlating continuous profiling with distributed tracing, Elastic Observability customers can measure the cloud cost and CO2 impact of every code change at the service and transaction level.
This milestone is significant, especially considering the recent developments in the OTel community. With OTel adopting profiling and Elastic donating the industry’s most advanced eBPF-based continuous profiling agent to OTel, we're set for a game-changer in observability — empowering OTel end users with a correlated system visibility that goes from a trace span in the userspace down to the kernel.
Furthermore, achieving this goal, especially with Java, presented significant challenges and demanded serious engineering R&D. This blog post will delve into these challenges, explore the approaches we considered in our proof-of-concepts, and explain how we arrived at a solution that can be easily extended to other OTel language agents. Most importantly, this solution correlates traces with profiling signals at the agent, not in the backend — to ensure optimal query performance and minimal reliance on vendor backend storage architectures.
Figuring out the active OTel trace and span
The primary technical challenge in this endeavor is essentially the following: whenever the profiler interrupts an OTel instrumented process to capture a stacktrace, we need to be able to efficiently determine the active span and trace ID (per-thread) and the service name (per-process).
For the purpose of this blog, we'll focus on the recently released Elastic distribution of the OTel Java instrumentation, but the approach that we ended up with generalizes to any language that can load and call into a native library. So, how do we get our hands on those IDs?
The OTel Java agent itself keeps track of the active span by storing a stack of spans in the OpenTelemetryContext, which itself is stored in a ThreadLocal variable. We originally considered reading these Java structures directly from BPF, but we eventually decided against that approach. There is no documented specification on how ThreadLocals are implemented, and reliably reading and following the JVM's internal data-structures would incur a high maintenance burden. Any minor update to the JVM could change details of the structure layouts. To add to this, we would also have to reverse engineer how each JVM version lays out Java class fields in memory, as well as how all the high-level Java types used in the context objects are actually implemented under the hood. This approach further wouldn't generalize to any non-JVM language and needs to be repeated for any language that we wish to support.
After we had convinced ourselves that reading Java ThreadLocal directly is not the answer, we decided to look for more portable alternatives instead. The option that we ultimately settled with is to load and call into a C++ library that is responsible for making the required information available via a known and defined interface whenever the span changes.
Other than with Java's ThreadLocals, the details on how a native shared library should expose per-process and per-thread data are well-defined in the System V ABI specification and the architecture specific ELF ABI documents.
Exposing per-process information
Exposing per-process data is easy: we simply declare a global variable . . .
void* elastic_tracecorr_process_storage_v1 = nullptr;
. . . and expose it via ELF symbols. When the user initializes the OTel library to set the service name, we allocate a buffer and populate it with data in a protocol that we defined for this purpose. Once the buffer is fully populated, we update the global pointer to point to the buffer.
On the profiling agent side, we already have code in place that detects libraries and executables loaded into any process's address space. We normally use this mechanism to detect and analyze high-level language interpreters (e.g., libpython, libjvm) when they are loaded, but it also turned out to be a perfect fit to detect the OTel trace correlation library. When the library is detected in a process, we scan the exports, resolve the symbol, and read the per-process information directly from the instrumented process’ memory.
Exposing per-thread information
With the easy part out of the way, let's get to the nitty-gritty portion: exposing per-thread information via thread-local storage (TLS). So, what exactly is TLS, and how does it work? At the most basic level, the idea is to have one instance of a variable for every thread. Semantically you can think of it like having a global Map<ThreadID, T>, although that is not how it is implemented.
On Linux, there are two major options for thread locals: TSD and TLS.
Thread-specific data (TSD)
TSD is the older and probably more commonly known variant. It works by explicitly allocating a key via pthread_key_create — usually during process startup — and passing it to all threads that require access to the thread-local variable. The threads can then pass that key to the pthread_getspecific and pthread_setspecific functions to read and update the variable for the currently running thread.
TSD is simple, but for our purposes it has a range of drawbacks:
-
The pthread_key_t structure is opaque and doesn't have a defined layout. Similar to the Java ThreadLocals, the underlying data-structures aren't defined by the ABI documents and different libc implementations (glibc, musl) will handle them differently.
-
We cannot call a function like pthread_getspecific from BPF, so we'd have to reverse engineer and reimplement the logic. Logic may change between libc versions, and we’d have to detect the version and support all variants that may come up in the wild.
-
TSD performance is not predictable and varies depending on how many thread local variables have been allocated in the process previously. This may not be a huge concern for Java specifically since spans are typically not swapped super rapidly, but it’d likely be quite noticeable for user-mode scheduling languages where the context might need to be swapped at every await point/coroutine yield.
None of this is strictly prohibitive, but a lot of this is annoying at the very least. Let’s see if we can do better!
Thread-local storage (TLS)
Starting with C11 and C++11, both languages support thread local variables directly via the _Thread_local and thread_local storage specifiers, respectively. Declaring a variable as per-thread is now a matter of simply adding the keyword:
thread_local void* elastic_tracecorr_tls_v1 = nullptr;
You might assume that the compiler simply inserts calls to the corresponding pthread function calls when variables declared with this are accessed, but this is not actually the case. The reality is surprisingly complicated, and it turns out that there are four different models of TLS that the compiler can choose to generate. For some of those models, there are further multiple dialects that can be used to implement them. The different models and dialects come with various portability versus performance trade-offs. If you are interested in the details, I suggest reading this blog article that does a great job at explaining them.
The TLS model and dialect are usually chosen by the compiler based on a somewhat opaque and complicated set of architecture-specific rules. Fortunately for us, both gcc and clang allow users to pick a particular one using the -ftls-model and -mtls-dialect arguments. The variant that we ended up picking for our purposes is -ftls-model=global-dynamic and -mtls-dialect=gnu2 (and desc on aarch64).
Let's take a look at the assembly that is being generated when accessing a thread_local variable under these settings. Our function:
void setThreadProfilingCorrelationBuffer(JNIEnv* jniEnv, jobject bytebuffer) {
  if (bytebuffer == nullptr) {
    elastic_tracecorr_tls_v1 = nullptr;
  } else {
    elastic_tracecorr_tls_v1 = jniEnv->GetDirectBufferAddress(bytebuffer);
  }
}
Is compiled to the following assembly code:
Both possible branches assign a value to our thread-local variable. Let’s focus at the right branch corresponding to the nullptr case to get rid of the noise from the GetDirectBufferAddress function call:
lea   rax, elastic_tracecorr_tls_v1_tlsdesc  ;; Load some pointer into rax.
call  qword ptr [rax]                        ;; Read & call function pointer at rax.
mov   qword ptr fs:[rax], 0                  ;; Assign 0 to the pointer returned by
                                             ;; the function that we just called.
The fs: portion of the mov instruction is the actual magic bit that makes the memory read per-thread. We’ll get to that later; let’s first look at the mysterious elastic_tracecorr_tls_v1_tlsdesc variable that the compiler emitted here. It’s an instance of the tlsdesc structure that is located somewhere in the .got.plt ELF section. The structure looks like this:
struct tlsdesc {
  // Function pointer used to retrieve the offset
  uint64_t (*resolver)(tlsdesc*);

  // TLS offset -- more on that later.
  uint64_t tp_offset;
}
The resolver field is initialized with nullptr and tp_offset with a per-executable offset. The first thread-local variable in an executable will usually have offset 0, the next one sizeof(first_var), and so on. At first glance this may appear to be similar to how TSD works, with the call to pthread_getspecific to resolve the actual offset, but there is a crucial difference. When the library is loaded, the resolver field is filled in with the address of __tls_get_addr by the loader (ld.so). __tls_get_addr is a relatively heavy function that allocates a TLS offset that is globally unique between all shared libraries in the process. It then proceeds by updating the tlsdesc structure itself, inserting the global offset and replacing the resolver function with a trivial one:
void* second_stage_resolver(tlsdesc* desc) {
  return tlsdesc->tp_offset;
}
In essence, this means that the first access to a tlsdesc based thread-local variable is rather expensive, but all subsequent ones are cheap. We further know that by the time that our C++ library starts publishing per-thread data, it must have gone through the initial resolving process already. Consequently, all that we need to do is to read the final offset from the process's memory and memorize it. We also refresh the offset every now and then to ensure that we really have the final offset, combating the unlikely but possible race condition that we read the offset before it was initialized. We can detect this case by comparing the resolver address against the address of the __tls_get_addr function exported by ld.so.
Determining the TLS offset from an external process
With that out of the way, the next question that arises is how to actually find the tlsdesc in memory so that we can read the offset. Intuitively one might expect that the dynamic symbol exported on the ELF file points to that descriptor, but that is not actually the case.
$ readelf --wide --dyn-syms elastic-jvmti-linux-x64.so | grep elastic_tracecorr_tls_v1
328: 0000000000000000 	8 TLS 	GLOBAL DEFAULT   19 elastic_tracecorr_tls_v1
The dynamic symbol instead contains an offset relative to the start of the .tls ELF section and points to the initial value that libc initializes the TLS value with when it is allocated. So how does ld.so find the tlsdesc to fill in the initial resolver? In addition to the dynamic symbol, the compiler also emits a relocation record for our symbol, and that one actually points to the descriptor structure that we are looking for.
$ readelf --relocs --wide elastic-jvmti-linux-x64.so | grep R_X86_64_TLSDESC
00000000000426e8  0000014800000024 R_X86_64_TLSDESC   	0000000000000000
elastic_tracecorr_tls_v1 + 0
To read the final TLS offset, we thus simply have to:
-
Wait for the event notifying us about a new shared library being loaded into a process
-
Do some cheap heuristics to detect our C++ library, avoiding the more expensive analysis below from being executed for every unrelated library on the system
-
Analyze the library on disk and scan ELF relocations for our per-thread variable to extract the tlsdesc address
-
Rebase that address to match where our library was loaded in that particular process
-
Read the offset from tlsdesc+8
Determining the TLS base
Now that we have the offset, how do we use that to actually read the data that the library puts there for us? This brings us back to the magic fs: portion of the mov instruction that we discussed earlier. In X86, most memory operands can optionally be supplied with a segment register that influences the address translation.
Segments are an archaic construct from the early days of 16-bit X86 where they were used to extend the address space. Essentially the architecture provides a range of segment registers that can be configured with different base addresses, thus allowing more than 16-bits worth of memory to be accessed. In times of 64-bit processors, this is hardly a concern anymore. In fact, X86-64 aka AMD64 got rid of all but two of those segment registers: fs and gs.
So why keep two of them? It turns out that they are quite useful for the use-case of thread-local data. Since every thread can be configured to have its own base address in these segment registers, we can use it to point to a block of data for this specific thread. That is precisely what libc implementations on Linux are doing with the fs segment. The offset that we snatched from the processes memory earlier is used as an address with the fs segment register, and the CPU automatically adds it to the per-thread base address.
To retrieve the base address pointed to by the fs segment register in the kernel, we need to read its destination from the kernel’s task_struct for the thread that we happened to interrupt with our profiling timer event. Getting the task struct is easy because we are blessed with the bpf_get_current_task BPF helper functions. BPF helpers are pretty much syscalls for BPF programs: we can just ask the Linux kernel to hand us the pointer.
Armed with the task pointer, we now have to read the thread.fsbase (X86-64) or thread.uw.tp_value (aarch64) field to get our desired base address that the user-mode process accesses via fs. This is where things get complicated one last time, at least if we wish to support older kernels without BTF support (we do!). The task_struct is huge and there are hundreds of fields that can be present or not depending on how the kernel is configured. Being a core primitive of the scheduler, it is also constantly subject to changes between different kernel versions. On modern Linux distributions, the kernel is typically nice enough to tell us the offset via BTF. On older ones, the situation is more complicated. Since hardcoding the offset is clearly not an option if we hope the code to be portable, we instead have to figure out the offset by ourselves.
We do this by consulting /proc/kallsyms, a file with mappings between kernel functions and their addresses, and then using BPF to dump the compiled code of a kernel function that rarely changes and uses the desired offset. We dynamically disassemble and analyze the function and extract the offset directly from the assembly. For X86-64 specifically, we dump the aout_dump_debugregs function that accesses thread->ptrace_bps, which has consistently been 16 bytes away from the fsbase field that we are interested in for all kernels that we have ever looked at.
Reading TLS data from kernel
With all the required offsets at our hands, we can now finally do what we set out to do in the first place: use them to enrich our stack traces with the OTel trace and span IDs that our C++ library prepared for us!
void maybe_add_otel_info(Trace* trace) {
  // Did user-mode insert a TLS offset for this process? Read it.
  TraceCorrProcInfo* proc = bpf_map_lookup_elem(&tracecorr_procs, &trace->pid);

  // No entry -> process doesn't have the C++ library loaded.
  if (!proc) return;

  // Load the fsbase offset from our global configuration map.
  u32 key = 0;
  SystemConfig* syscfg = bpf_map_lookup_elem(&system_config, &key);

  // Read the fsbase offset from the kernel's task struct.
  u8* fsbase;
  u8* task = (u8*)bpf_get_current_task();
  bpf_probe_read_kernel(&fsbase, sizeof(fsbase), task + syscfg->fsbase_offset);

  // Use the TLS offset to read the **pointer** to our TLS buffer.
  void* corr_buf_ptr;
  bpf_probe_read_user(
    &corr_buf_ptr,
    sizeof(corr_buf_ptr),
    fsbase + proc->tls_offset
  );

  // Read the information that our library prepared for us.
  TraceCorrelationBuf corr_buf;
  bpf_probe_read_user(&corr_buf, sizeof(corr_buf), corr_buf_ptr);

  // If the library reports that we are currently in a trace, store it into
  // the stack trace that will be reported to our user-land process.
  if (corr_buf.trace_present && corr_buf.valid) {
    trace->otel_trace_id.as_int.hi = corr_buf.trace_id.as_int.hi;
    trace->otel_trace_id.as_int.lo = corr_buf.trace_id.as_int.lo;
    trace->otel_span_id.as_int = corr_buf.span_id.as_int;
  }
}
Sending out the mappings
From this point on, everything further is pretty simple. The C++ library sets up a unix datagram socket during startup and communicates the socket path to the profiler via the per-process data block. The stacktraces annotated with the OTel trace and span IDs are sent from BPF to our user-mode profiler process via perf event buffers, which in turn sends the mappings between OTel span and trace and stack trace hashes to the C++ library. Our extensions to the OTel instrumentation framework then read those mappings and insert the stack trace hashes into the OTel trace.
This approach has a few major upsides compared to the perhaps more obvious alternative of sending out the OTel span and trace ID with the profiler’s stacktrace records. We want the stacktrace associations to be stored in the trace indices to allow filtering and aggregating stacktraces by the plethora of fields available on OTel traces. If we were to send out the trace IDs via the profiler's gRPC connection instead, we’d have to search for and update the corresponding OTel trace records in the profiling collector to insert the stack trace hashes.
This is not trivial: stacktraces are sent out rather frequently (every 5 seconds, as of writing) and the corresponding OTel trace might not have been sent and stored by the time the corresponding stack traces arrive in our cluster. We’d have to build a kind of delay queue and periodically retry updating the OTel trace documents, introducing avoidable database work and complexity in the collectors. With the approach of sending stacktrace mappings to the OTel instrumented process instead, the need for server-side merging vanishes entirely.
Trace correlation in action
With all the hard work out of the way, let’s take a look at what trace correlation looks like in action!
Future work: Supporting other languages
We have demonstrated that trace correlation can work nicely for Java, but we have no intention of stopping there. The general approach that we discussed previously should work for any language that can efficiently load and call into our C++ library and doesn’t do user-mode scheduling with coroutines. The problem with user-mode scheduling is that the logical thread can change at any await/yield point, requiring us to update the trace IDs in TLS. Many such coroutine environments like Rust’s Tokio provide the ability to register a callback for whenever the active task is swapped, so they can be supported easily. Other languages, however, do not provide that option.
One prominent example in that category is Go: goroutines are built on user-mode scheduling, but to our knowledge there’s no way to instrument the scheduler. Such languages will need solutions that don’t go via the generic TLS path. For Go specifically, we have already built a prototype that uses pprof labels that are associated with a specific Goroutine, having Go’s scheduler update them for us automatically.
Getting started
We hope this blog post has given you an overview of correlating profiling signals to distributed tracing, and its benefits for end-users.
To get started, download the Elastic distribution of the OTel agent, which contains the new trace correlation library. Additionally, you will need the latest version of Universal Profiling agent, bundled with Elastic Stack version 8.13.
Acknowledgment
We appreciate Trask Stalnaker, maintainer of the OTel Java agent, for his feedback on our approach and for reviewing the early draft of this blog post.
The release and timing of any features or functionality described in this post remain at Elastic's sole discretion. Any features or functionality not currently available may not be delivered on time or at all.