Search, analyze, and act with log analytics
Logs are everywhere, record everything, and are the richest source of context. Elastic cuts through the noise with agentic AI — turning messy, unstructured logs into operational answers.
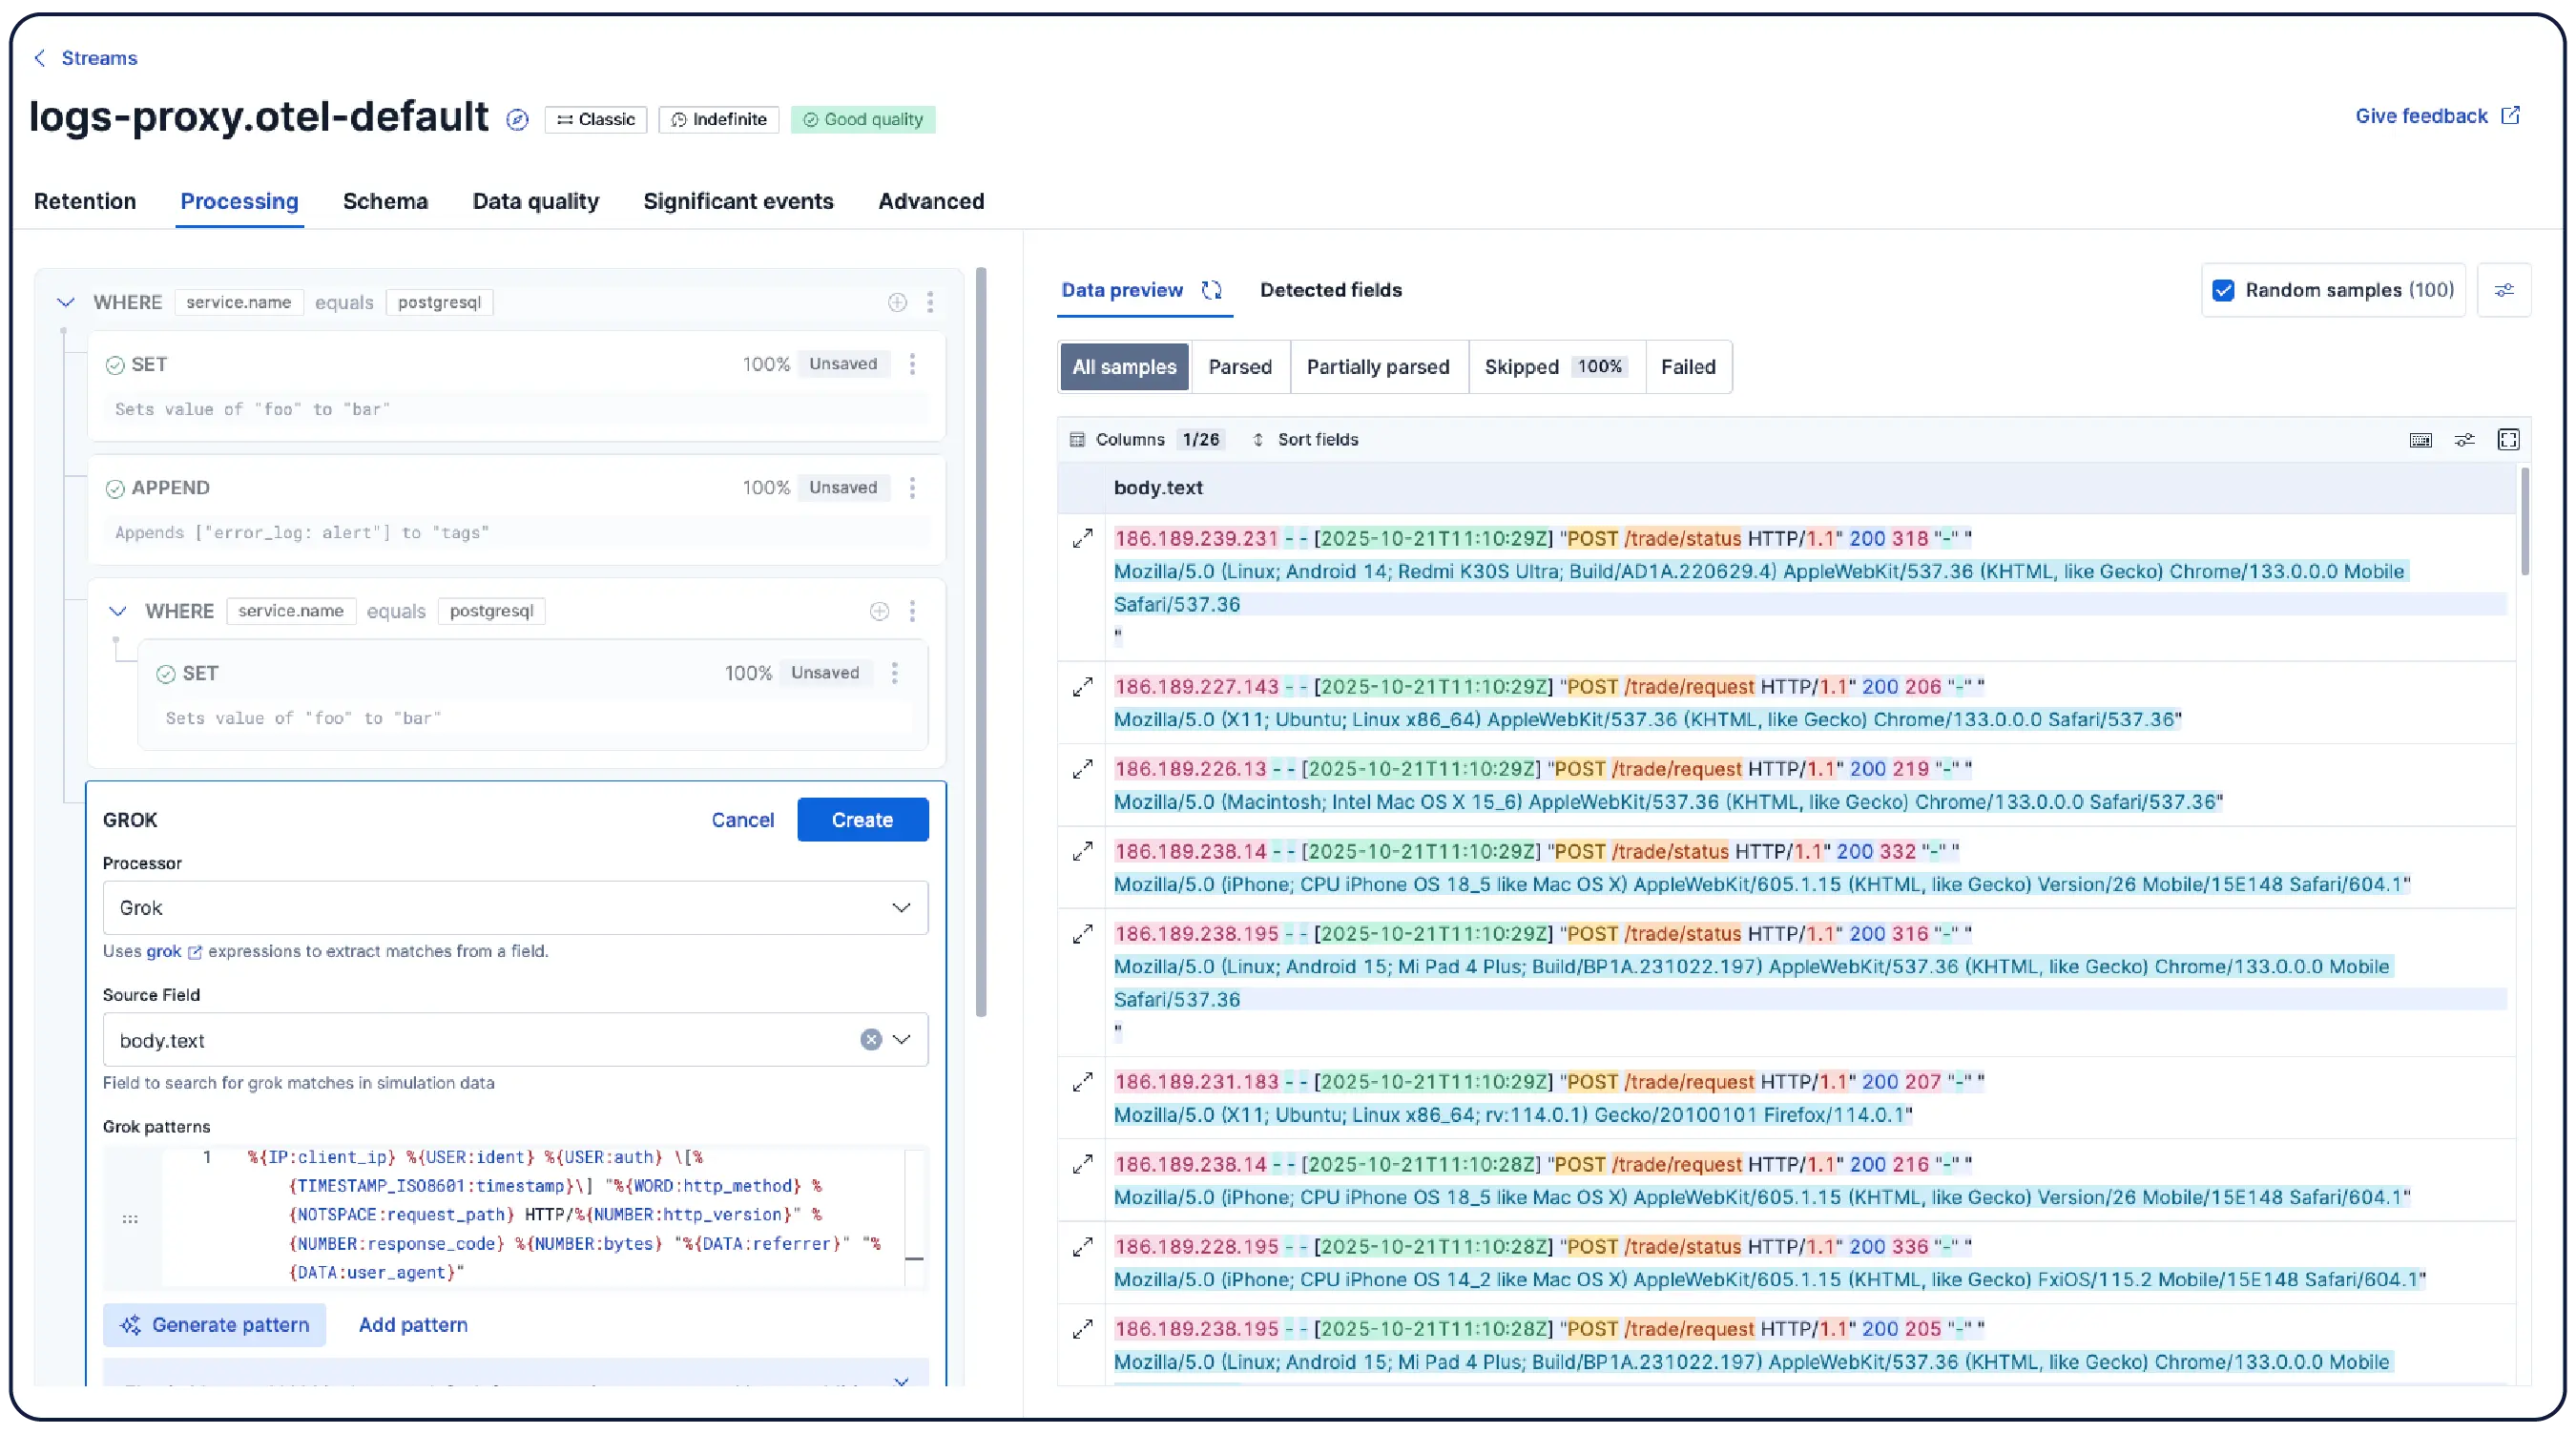
Goodbye log swamp, hello Streams!
Forget grepping through terabytes of logs
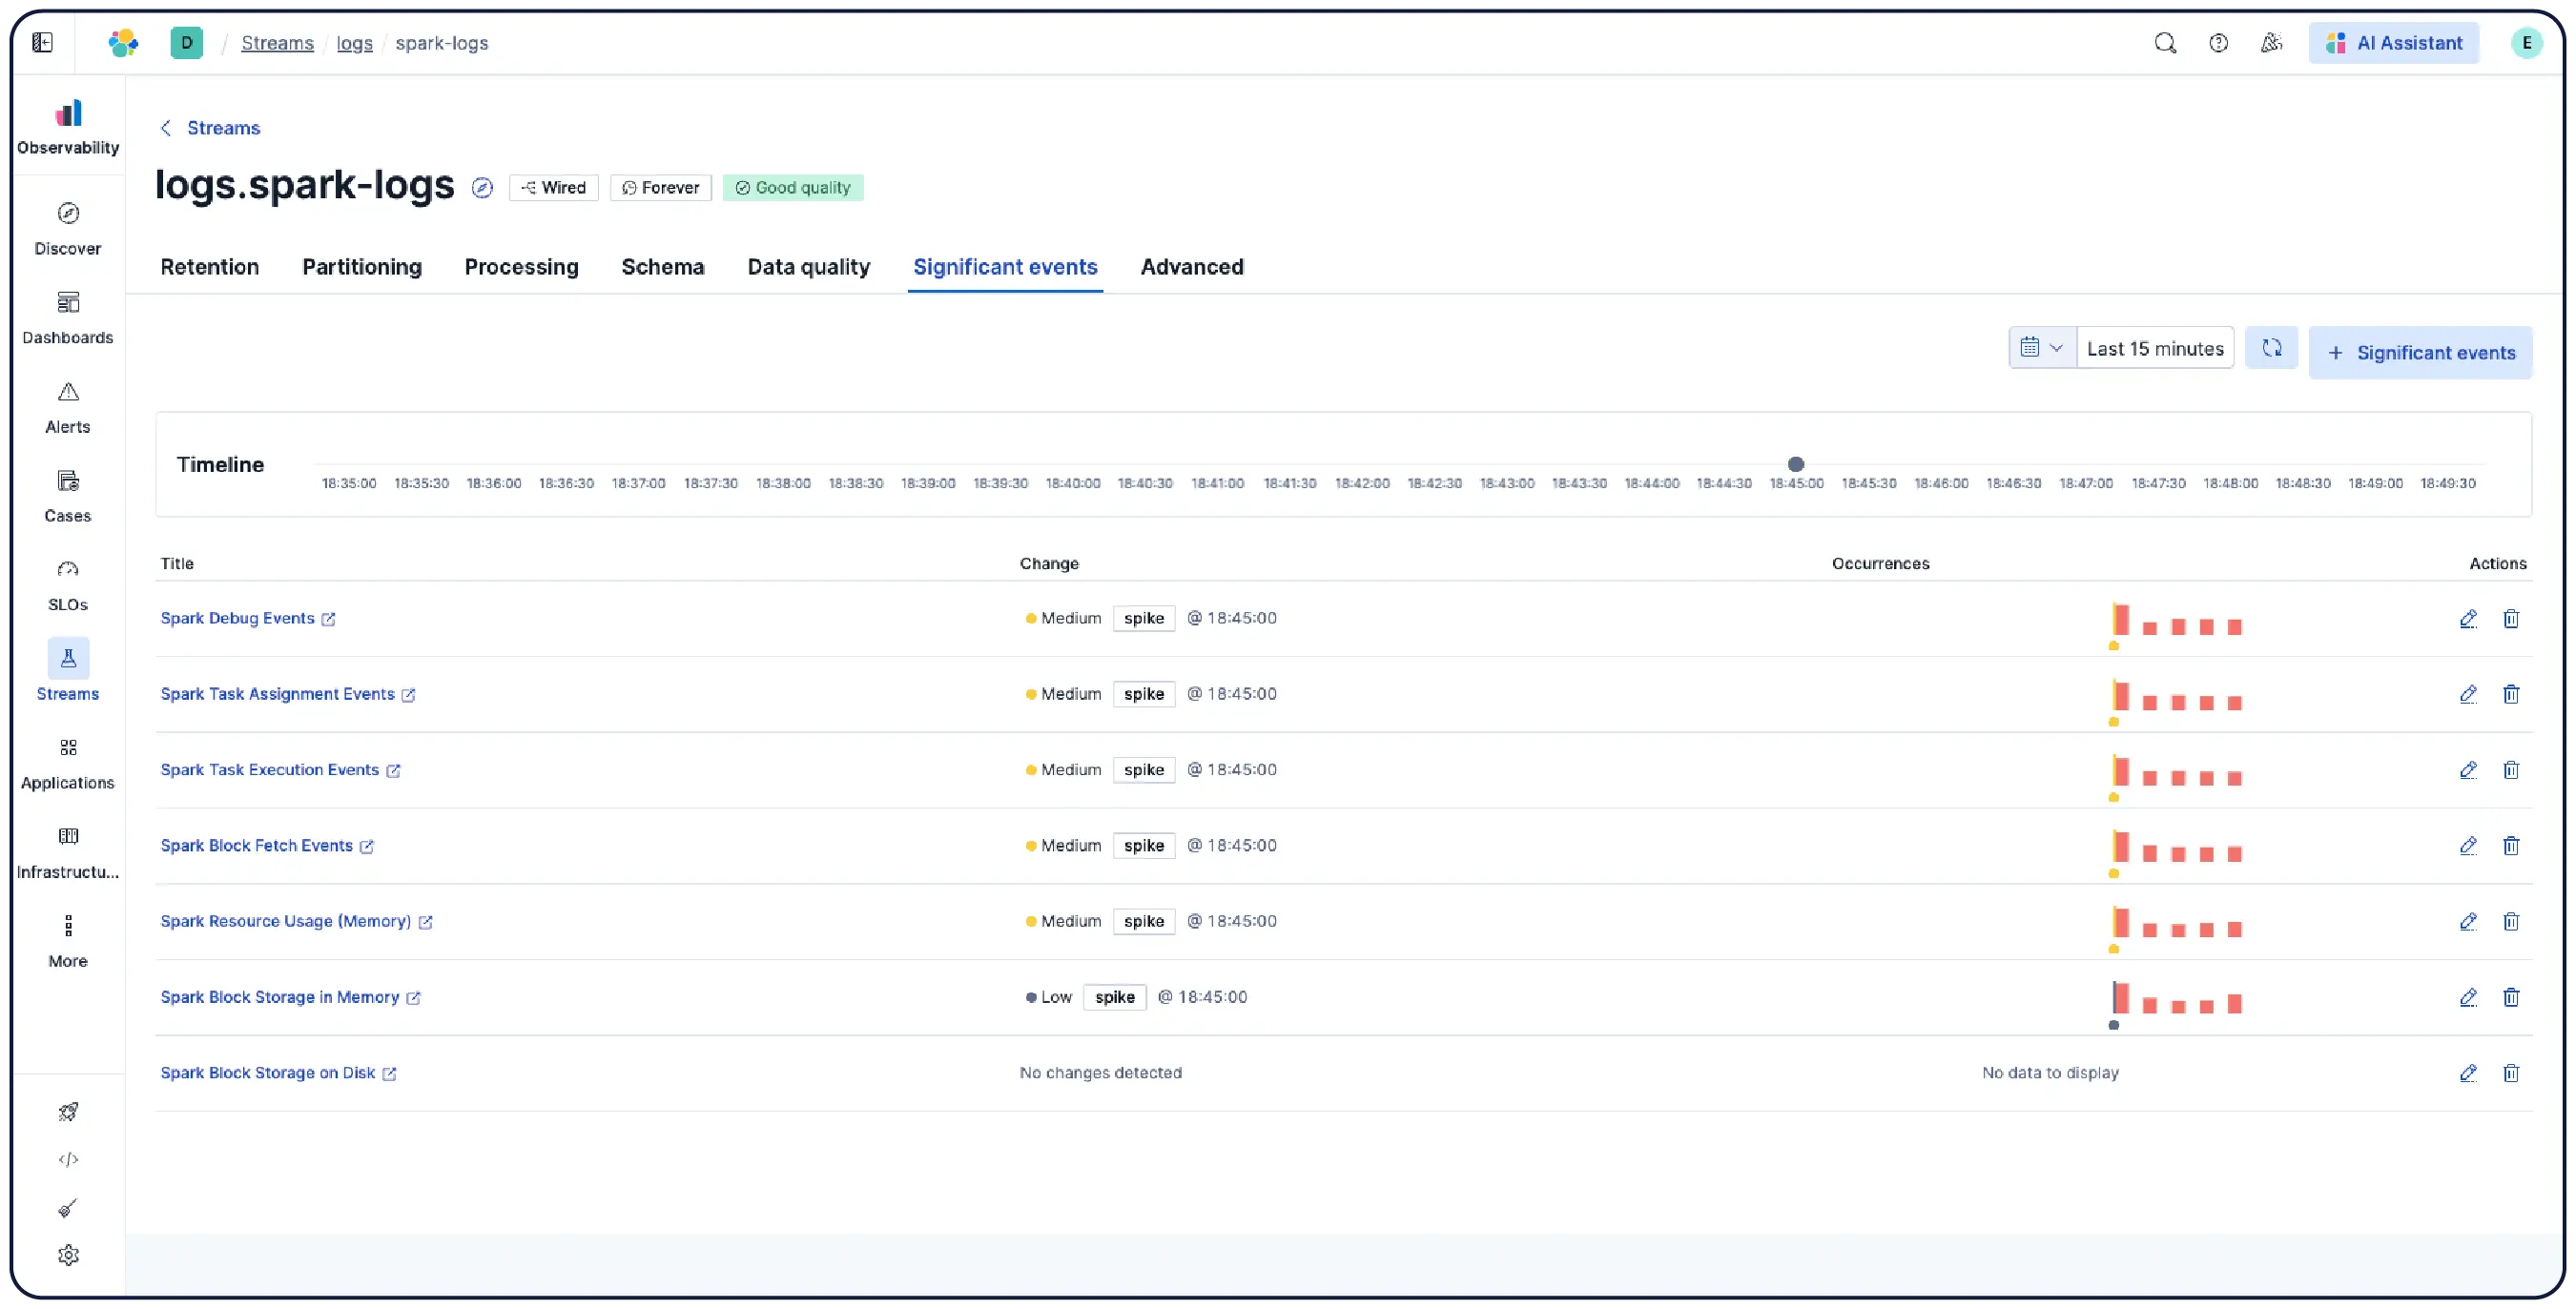
Streams automatically detects patterns humans can't see, parsing, partitioning, and structuring logs and surfacing significant events with AI — so you can focus on problem solving, not pipelines.


GUIDED DEMO
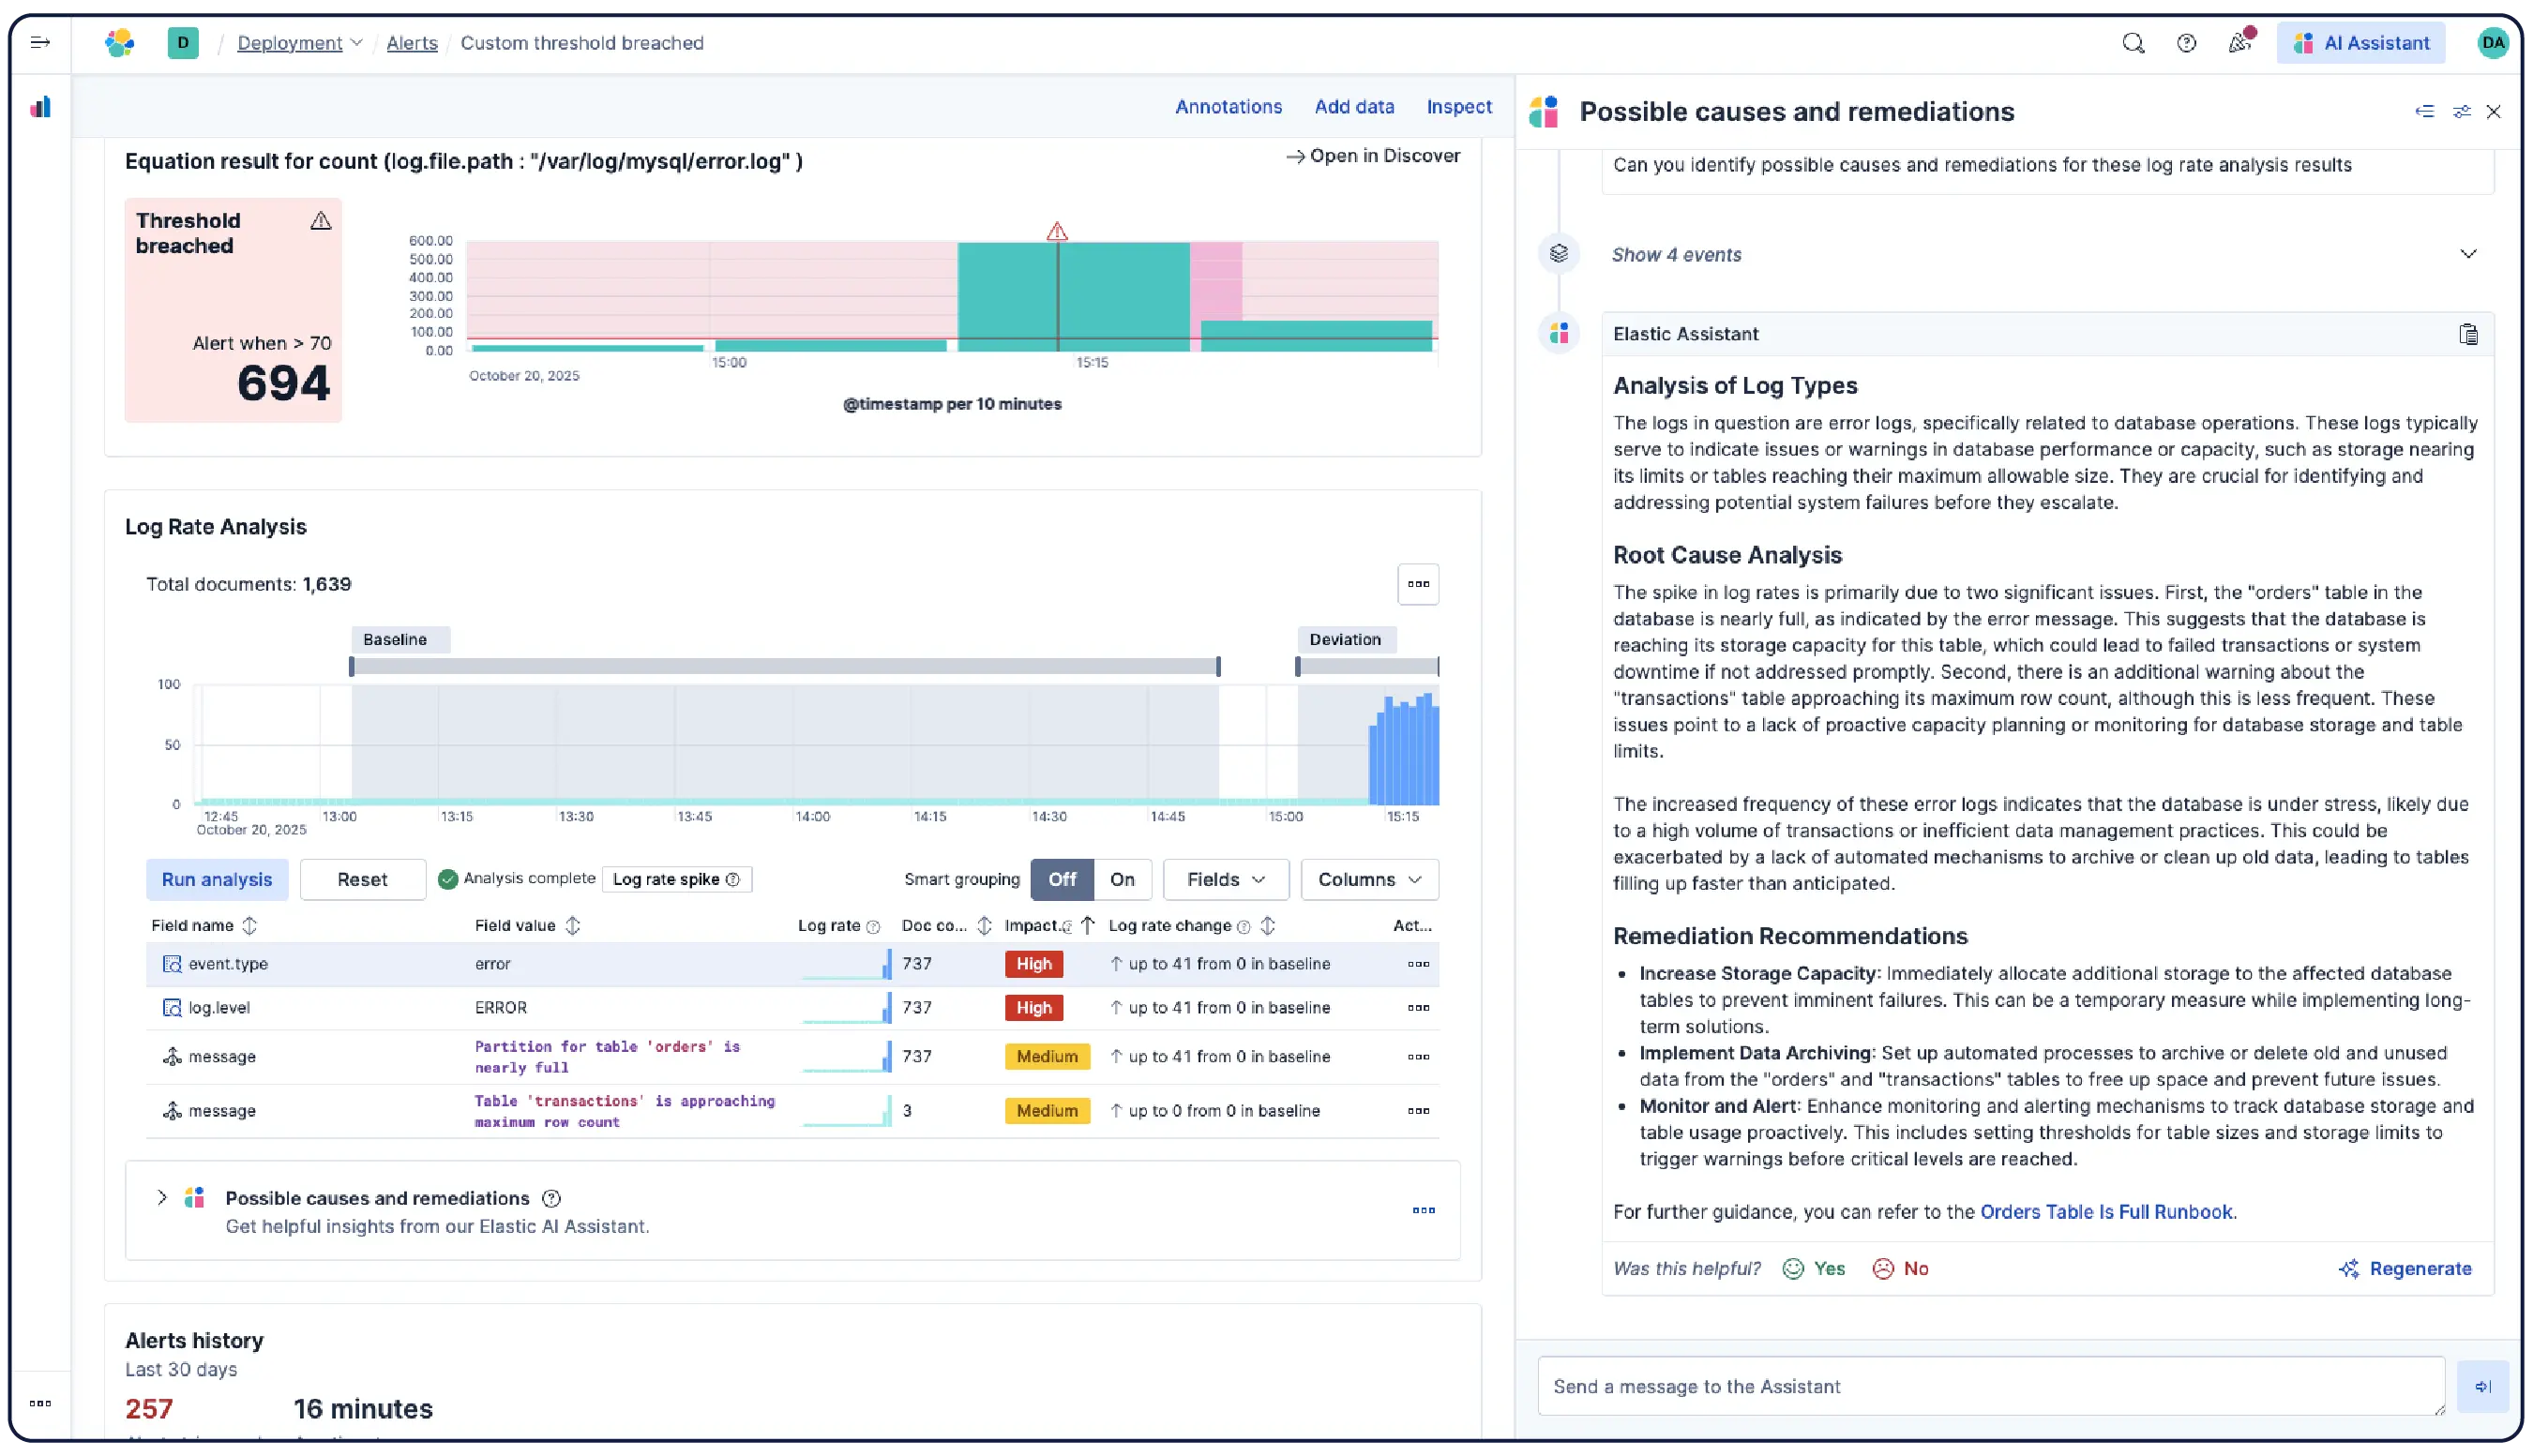
From raw logs to real answers
Logs tell you what happened. Elastic helps you understand why.
DIFFERENTIATORS
More data, more problems? Not anymore.
Most logging solutions weren't built for today's scale. Elastic is. Our architecture is designed to handle petabytes of logs with indexing, compression, and efficient data storage — along with AI-driven analysis — so you have all the telemetry you need, without breaking the bank.


CAPABILITIES
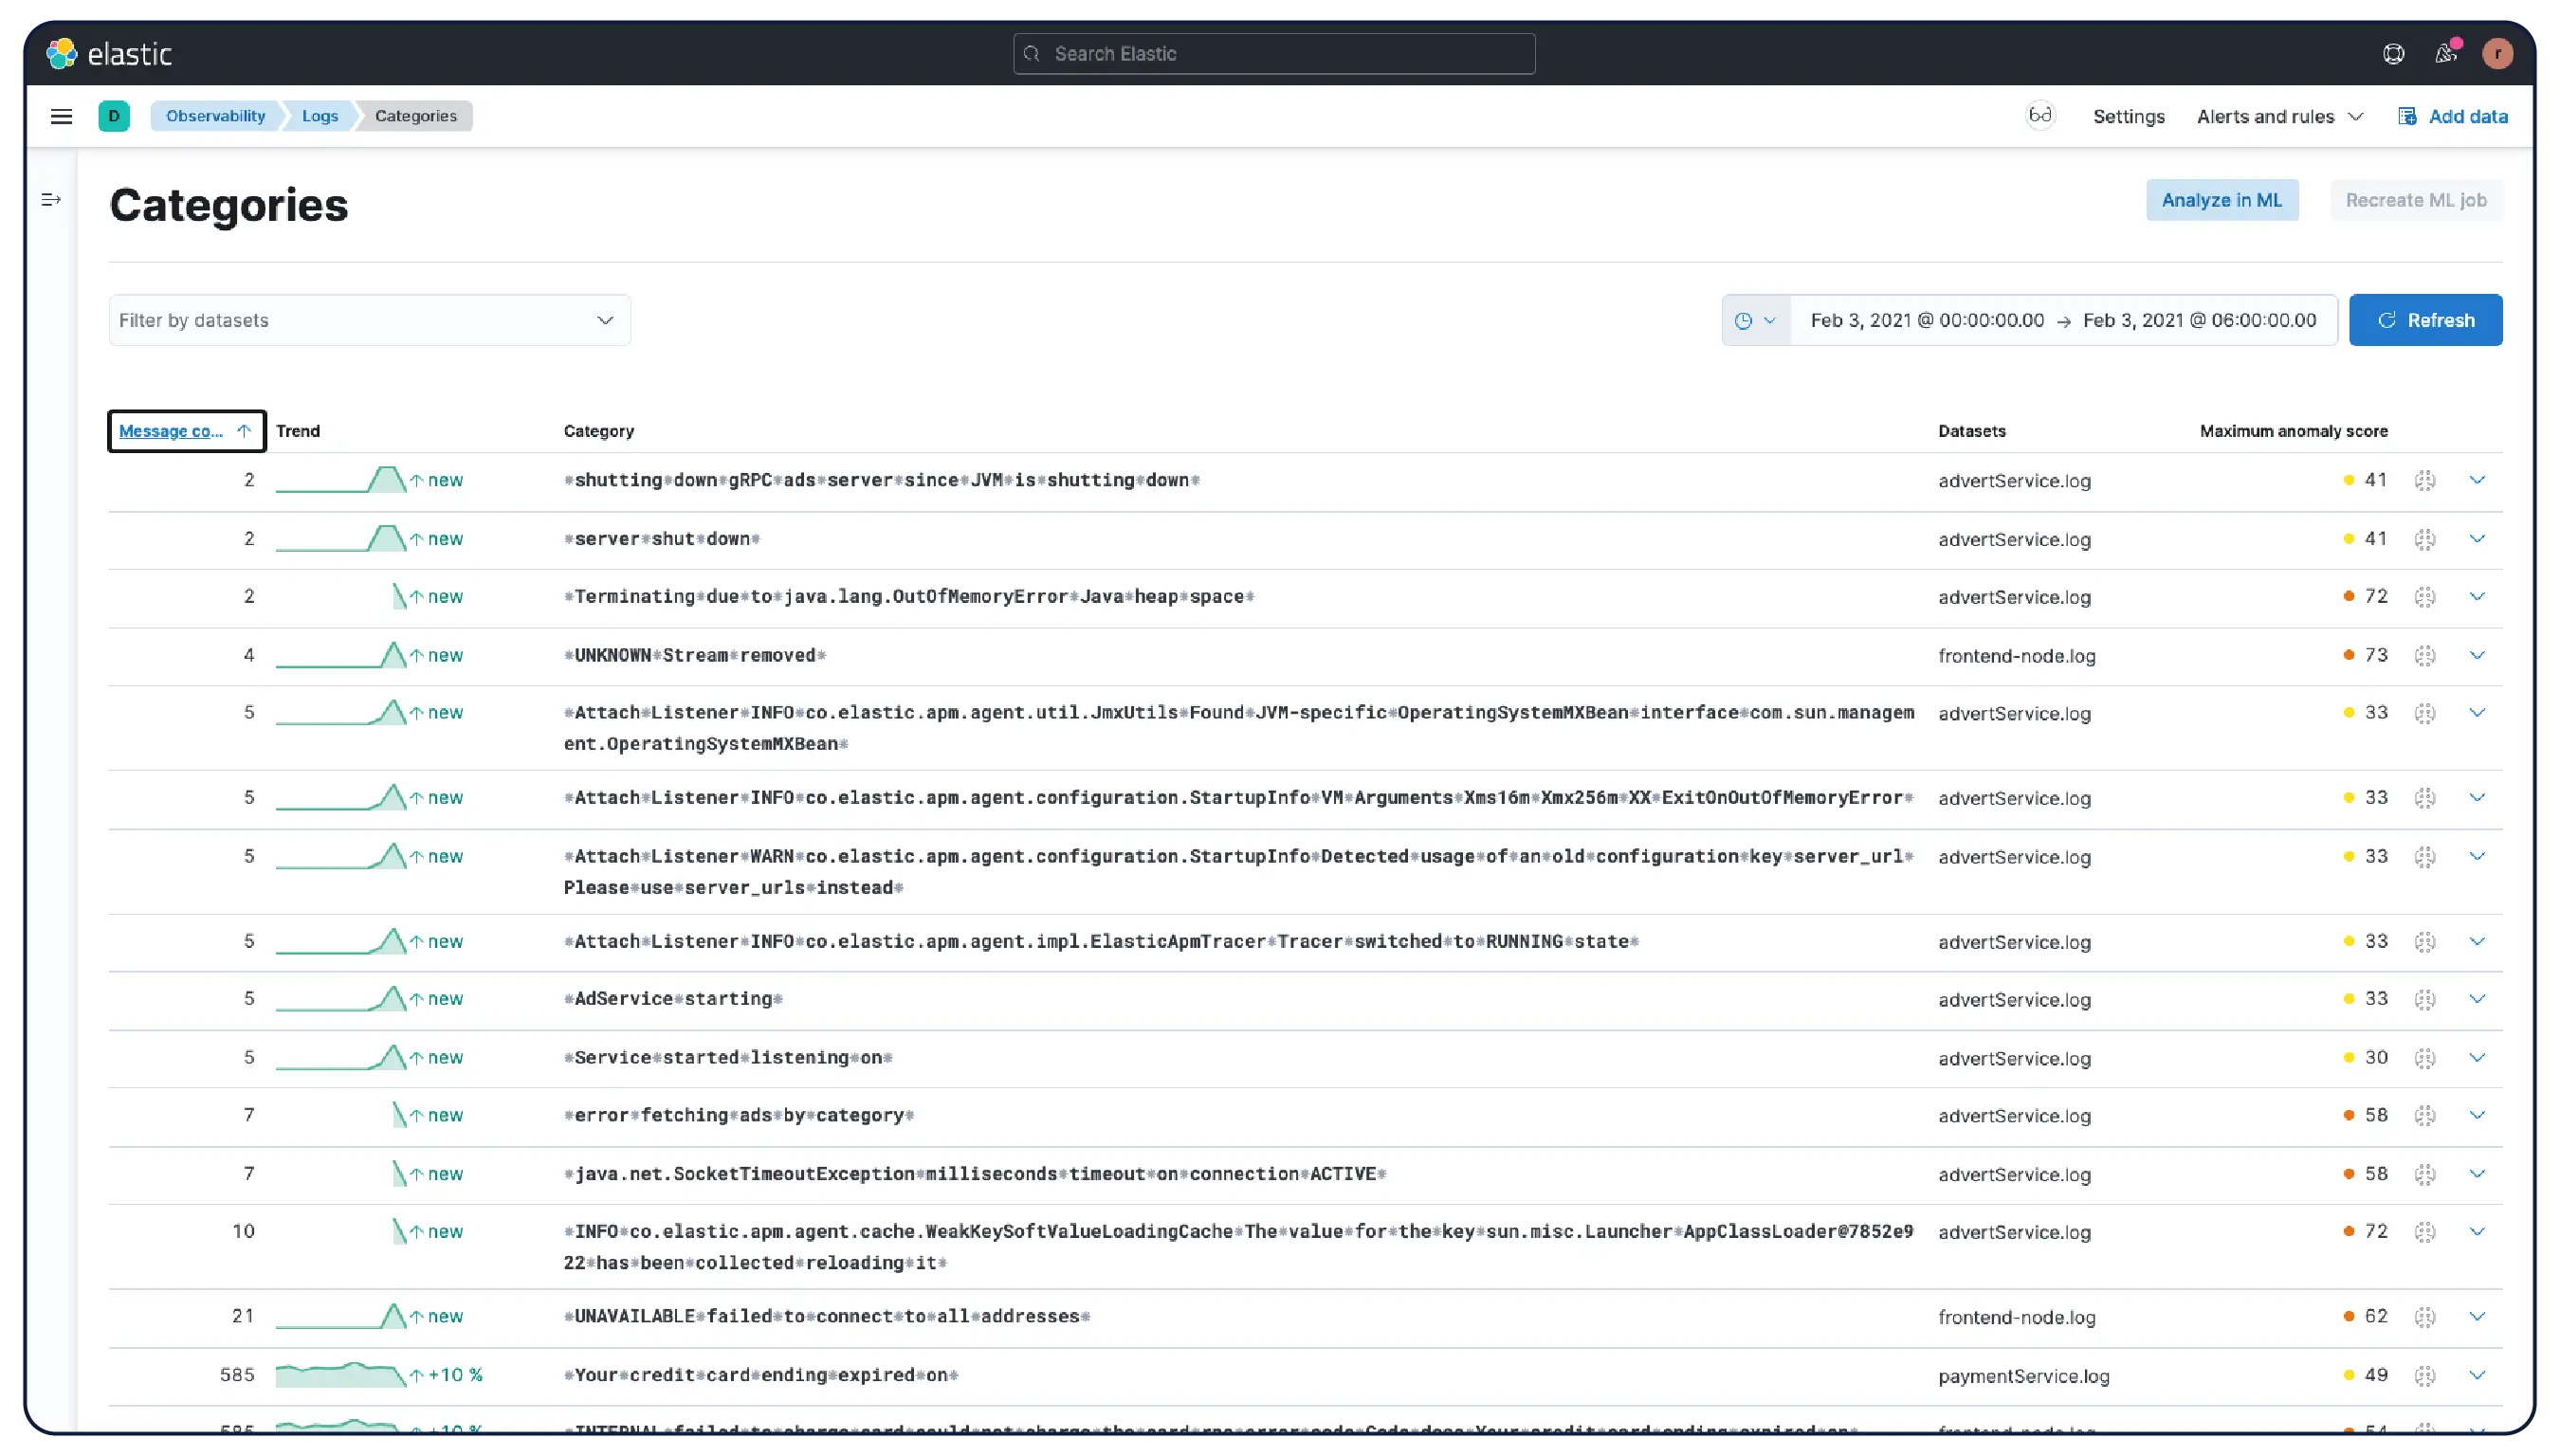
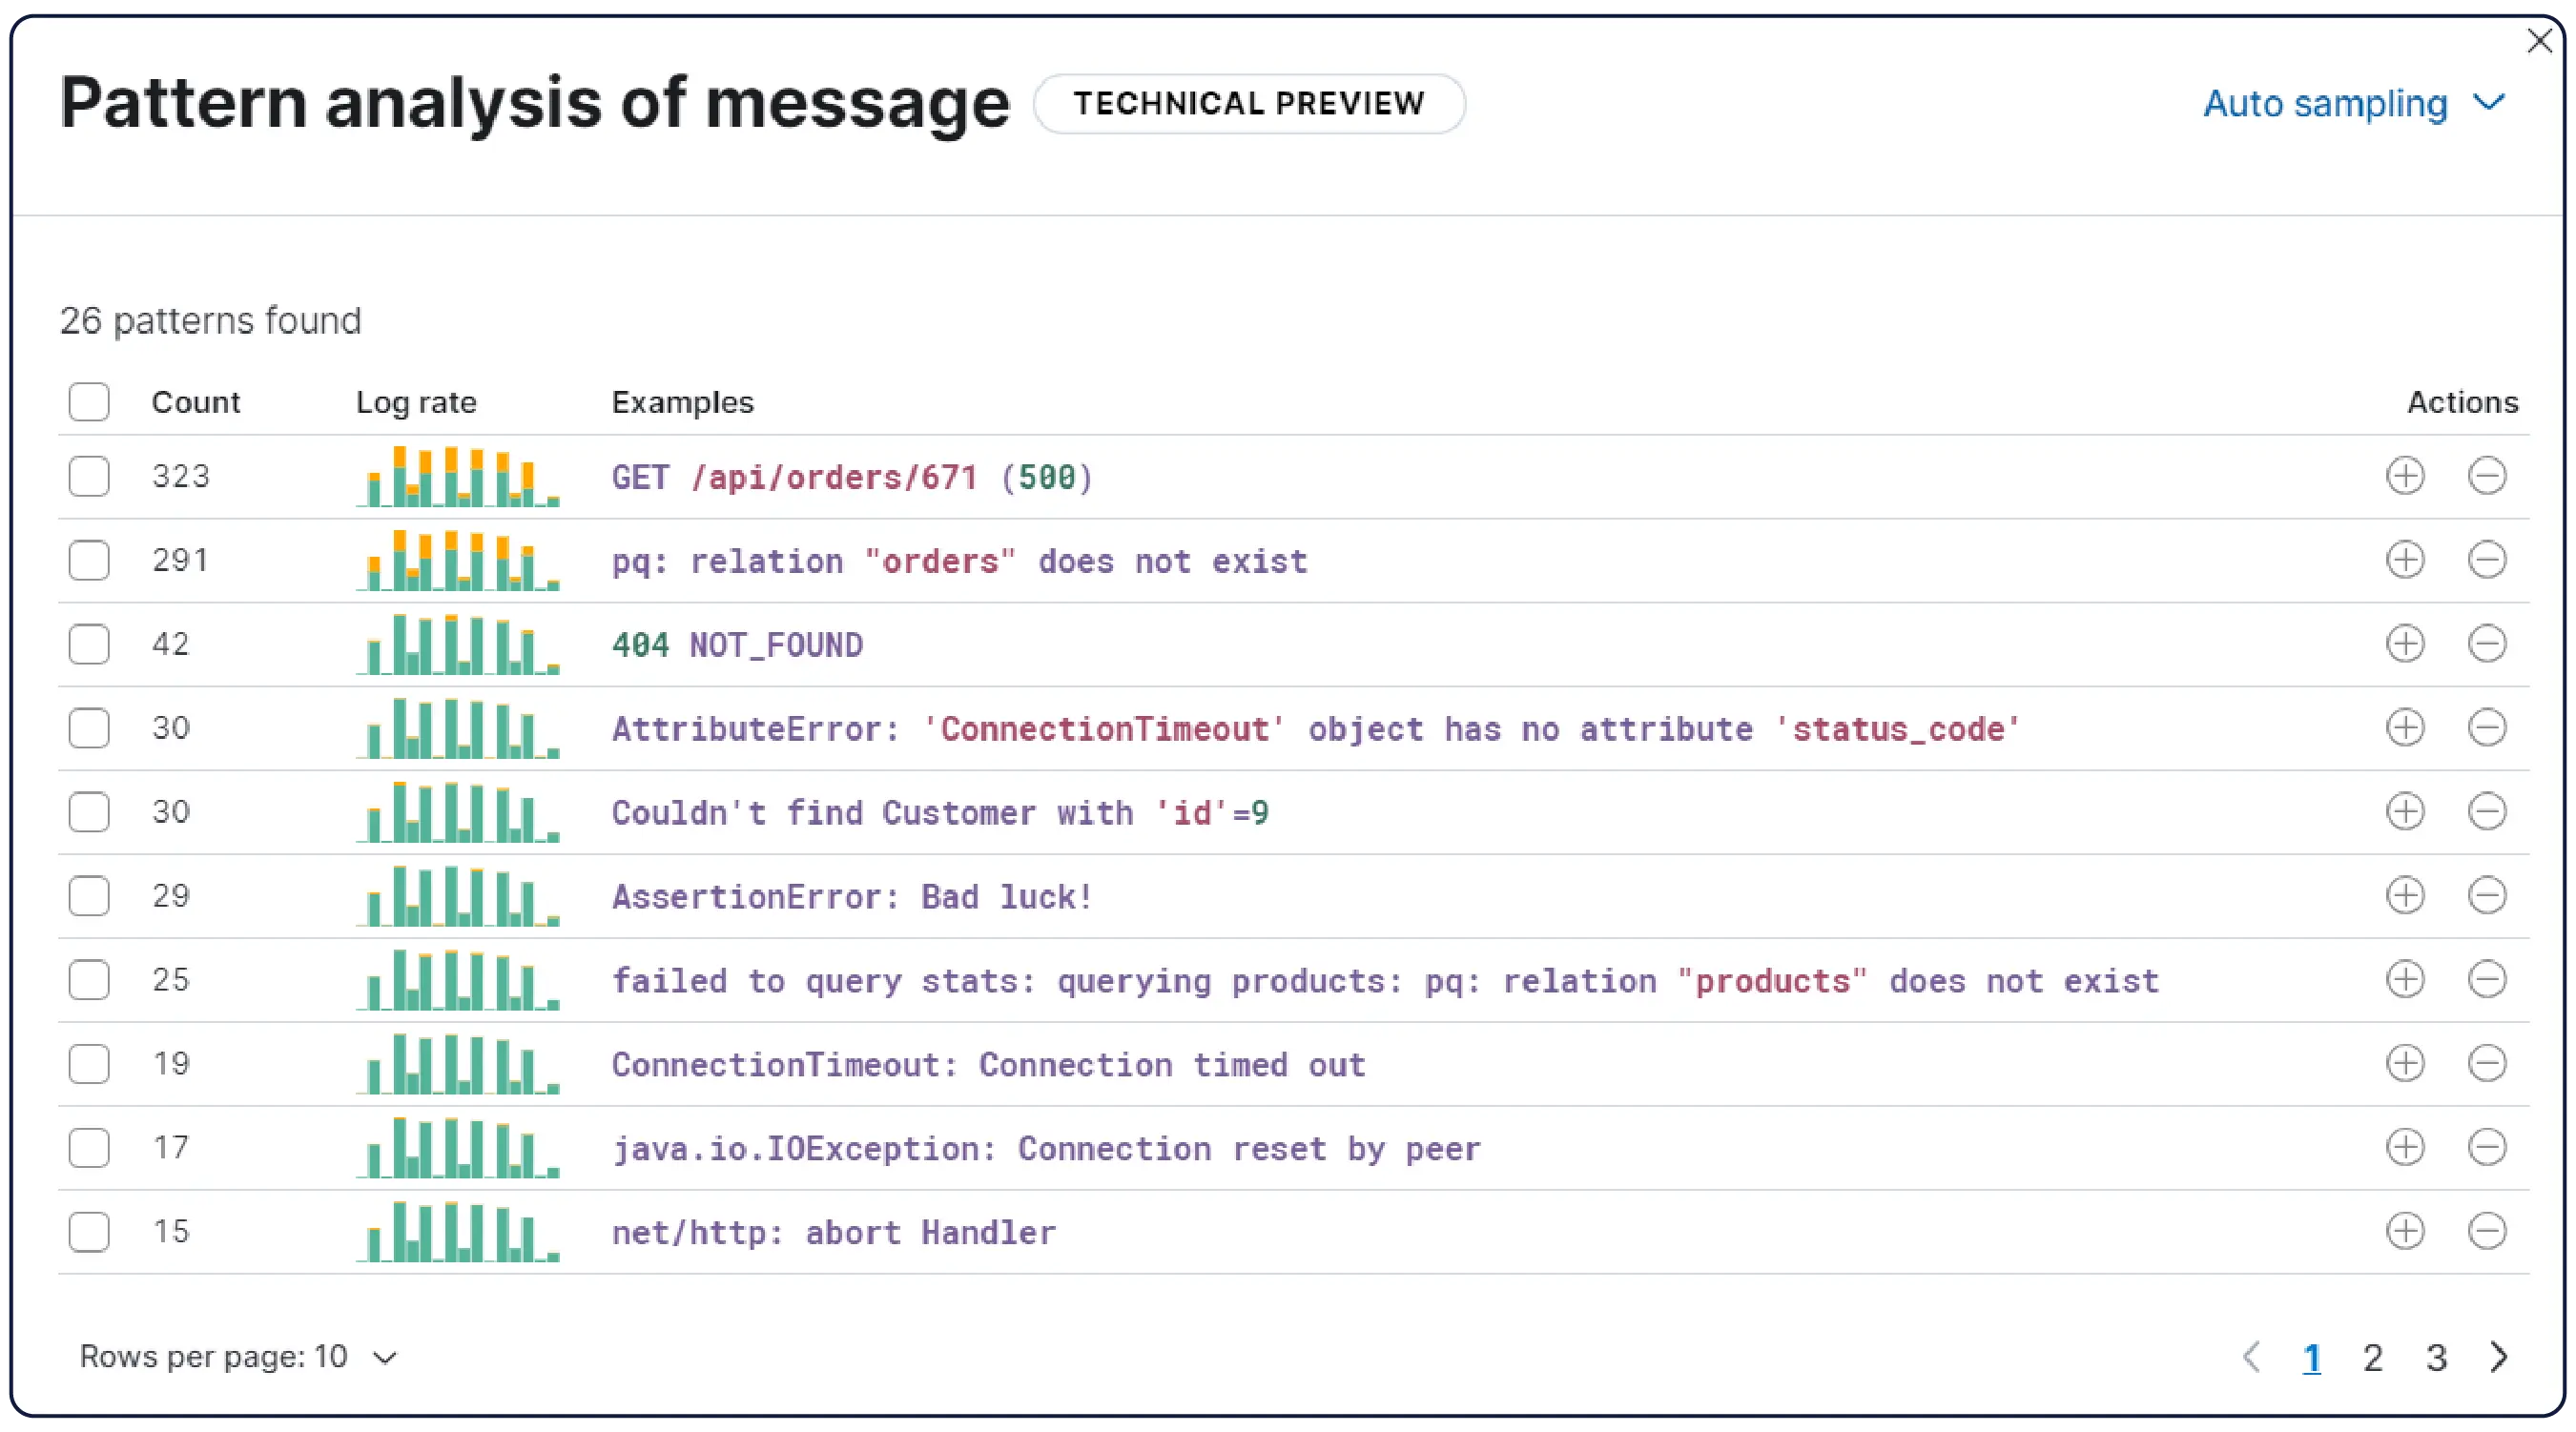
Billions of logs, one clear picture
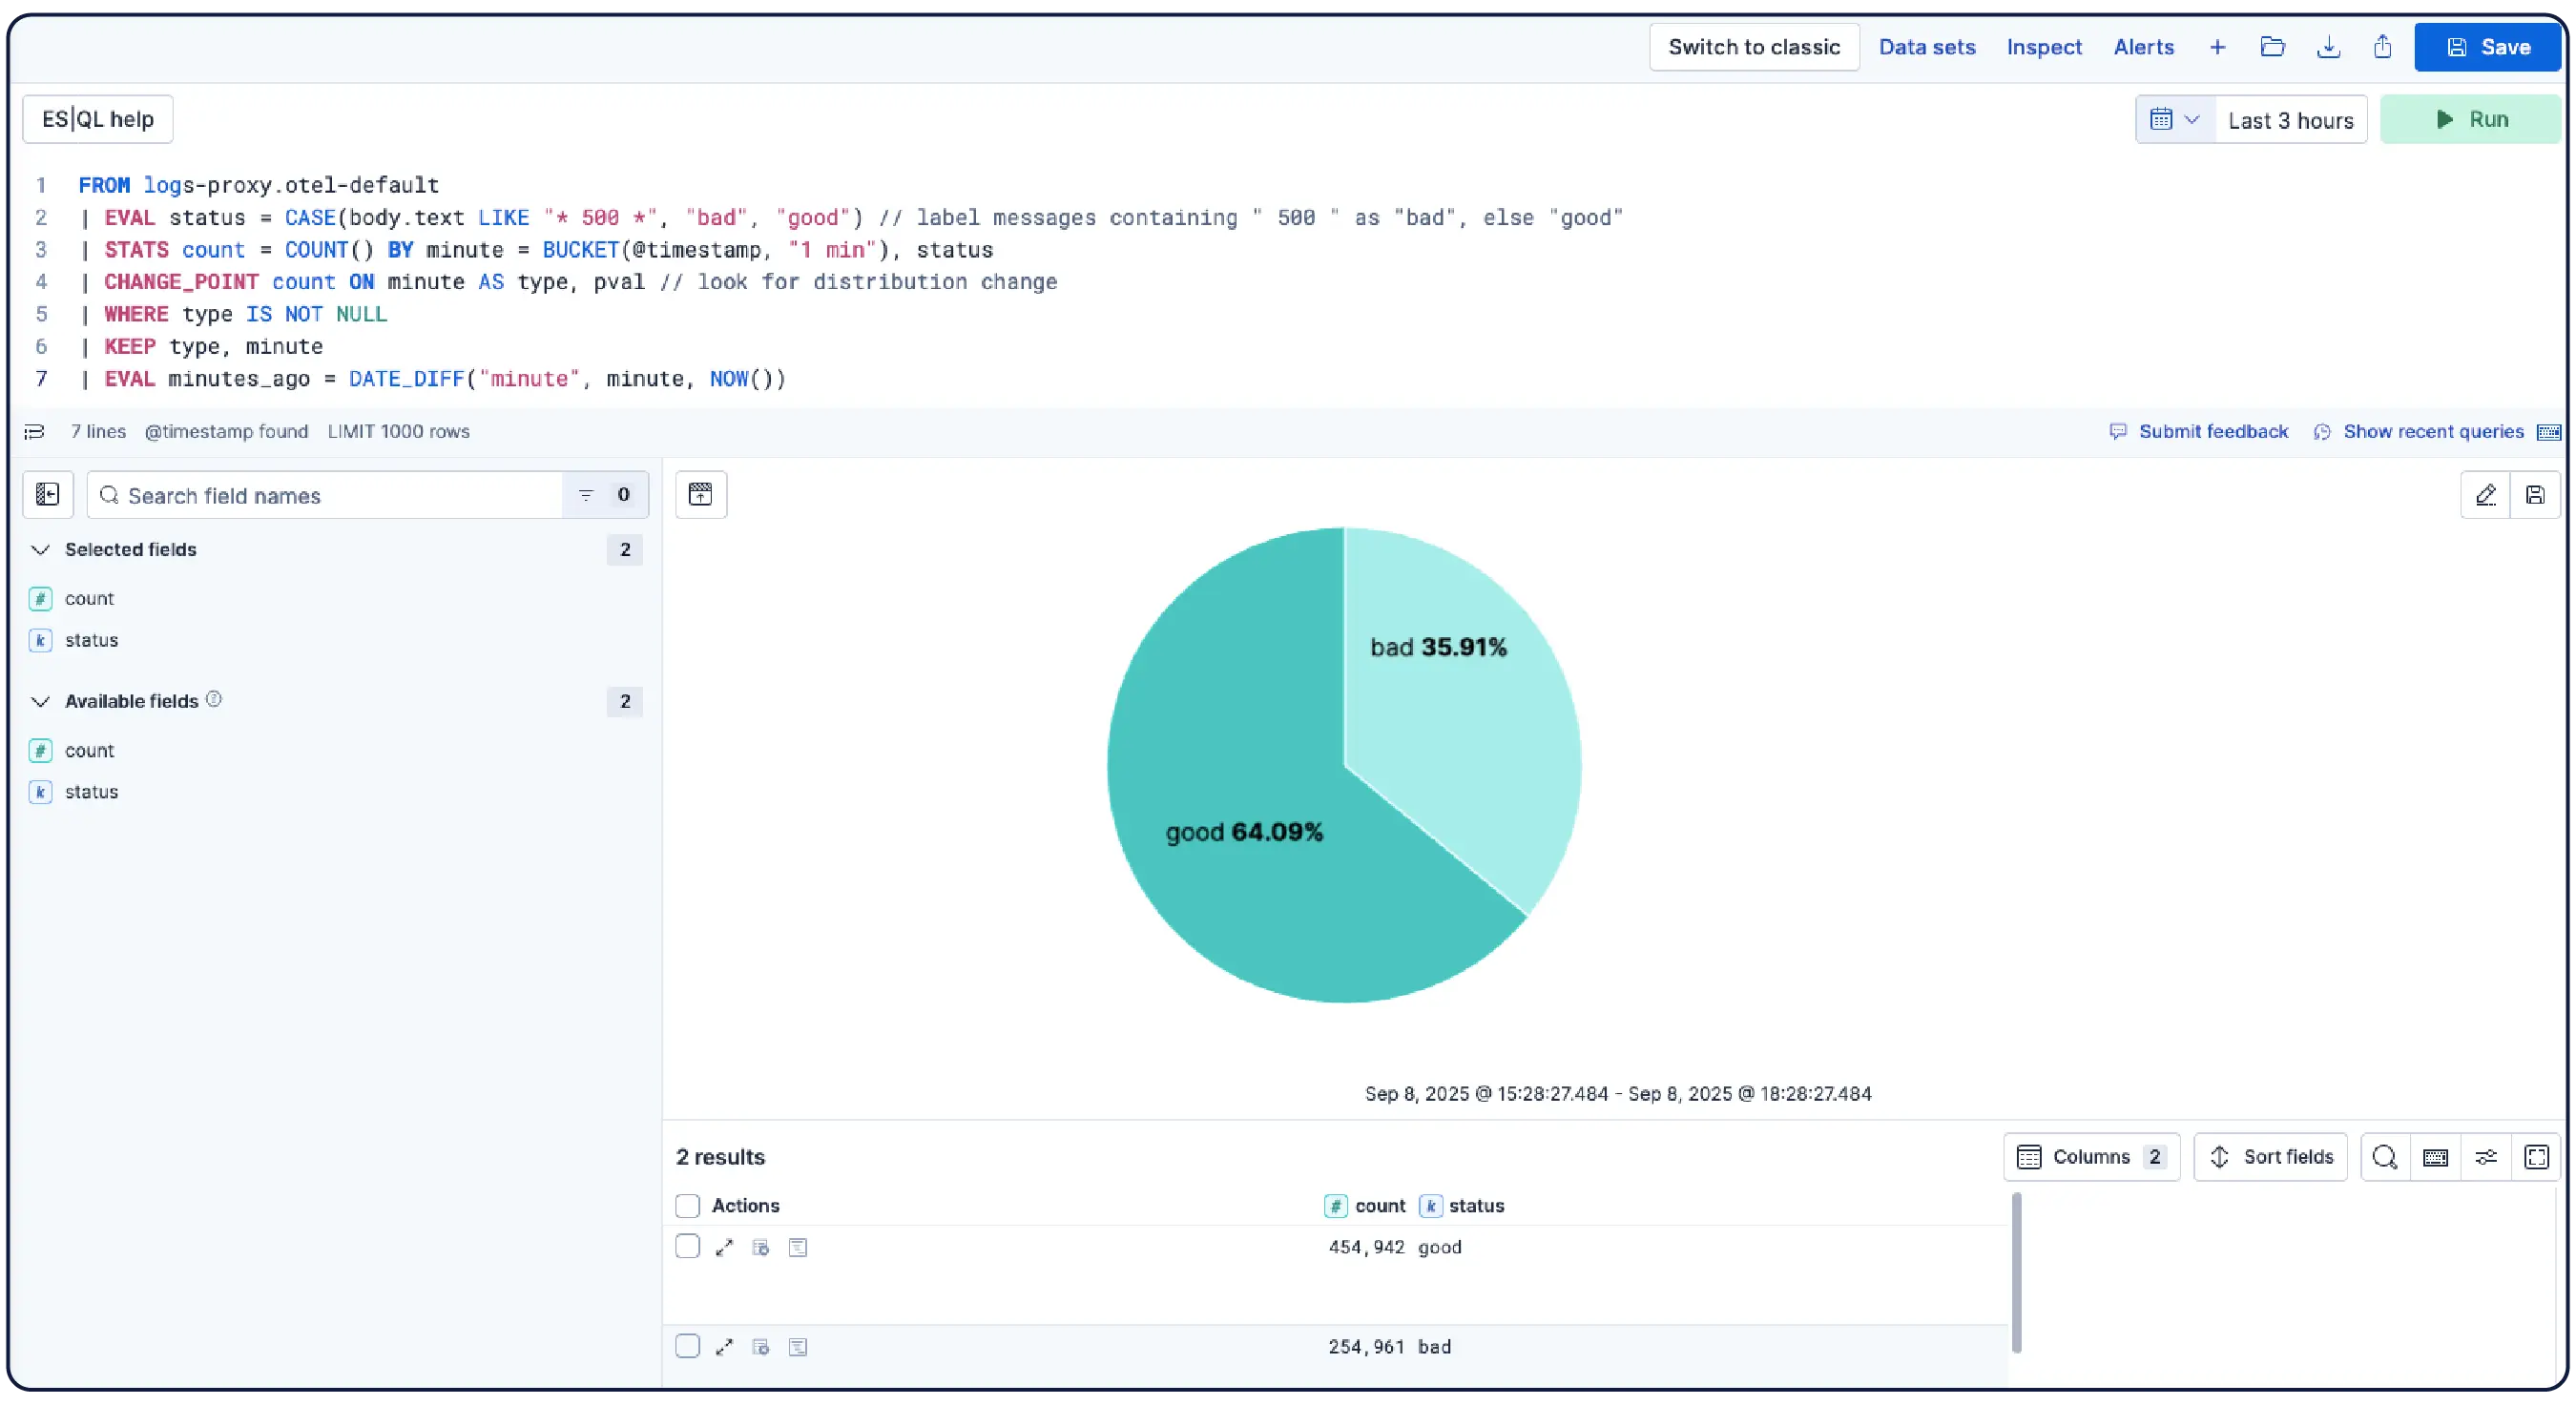
Elastic ingests logs from anywhere and automatically groups them into patterns, highlights anomalies, and pinpoints spikes — so you get answers, not overload.
Automatically organize data into logical streams, applying parsing, partitioning, field extraction, and lifecycle policies with minimal manual setup.


See why companies like yours choose Elastic Observability
Get log analytics at scale to turn messy logs into operational answers.
Customer spotlight

Comcast ingests 400 terabytes of data daily with Elastic to monitor services and accelerate root cause analysis ensuring a top-notch customer experience.
Customer spotlight

Discover reduced storage costs by 50% and improved data retrieval times by implementing a centralized logging platform with Elastic.
Customer spotlight

Informatica cut costs and reduced MTTR by migrating its entire logging workload to Elastic for 100+ applications and 300+ Kubernetes clusters.
Join the chat
Connect to Elastic's global community and participate in open conversations and collaboration.


.jpg)