


Application Performance Monitoring (APM)
Accelerate the software development lifecycle from pipeline to production
Get deep visibility into your cloud-native and distributed applications — from microservices to serverless architectures — and quickly identify and resolve root causes of issues. Seamlessly adopt APM to automatically identify anomalies, map service dependencies, and simplify investigations into outliers and abnormal behavior. Optimize your application code with extensive support for popular languages, OpenTelemetry, and distributed tracing.
Start streaming, viewing, and analyzing APM traces from your applications using Elastic Cloud in minutes.
Get startedLearn why Elastic was named a Visionary in the 2021 Gartner Magic Quadrant for Application Performance Monitoring.
Learn moreGet a rundown of the latest features and see Elastic APM in action with a demo from the experts.
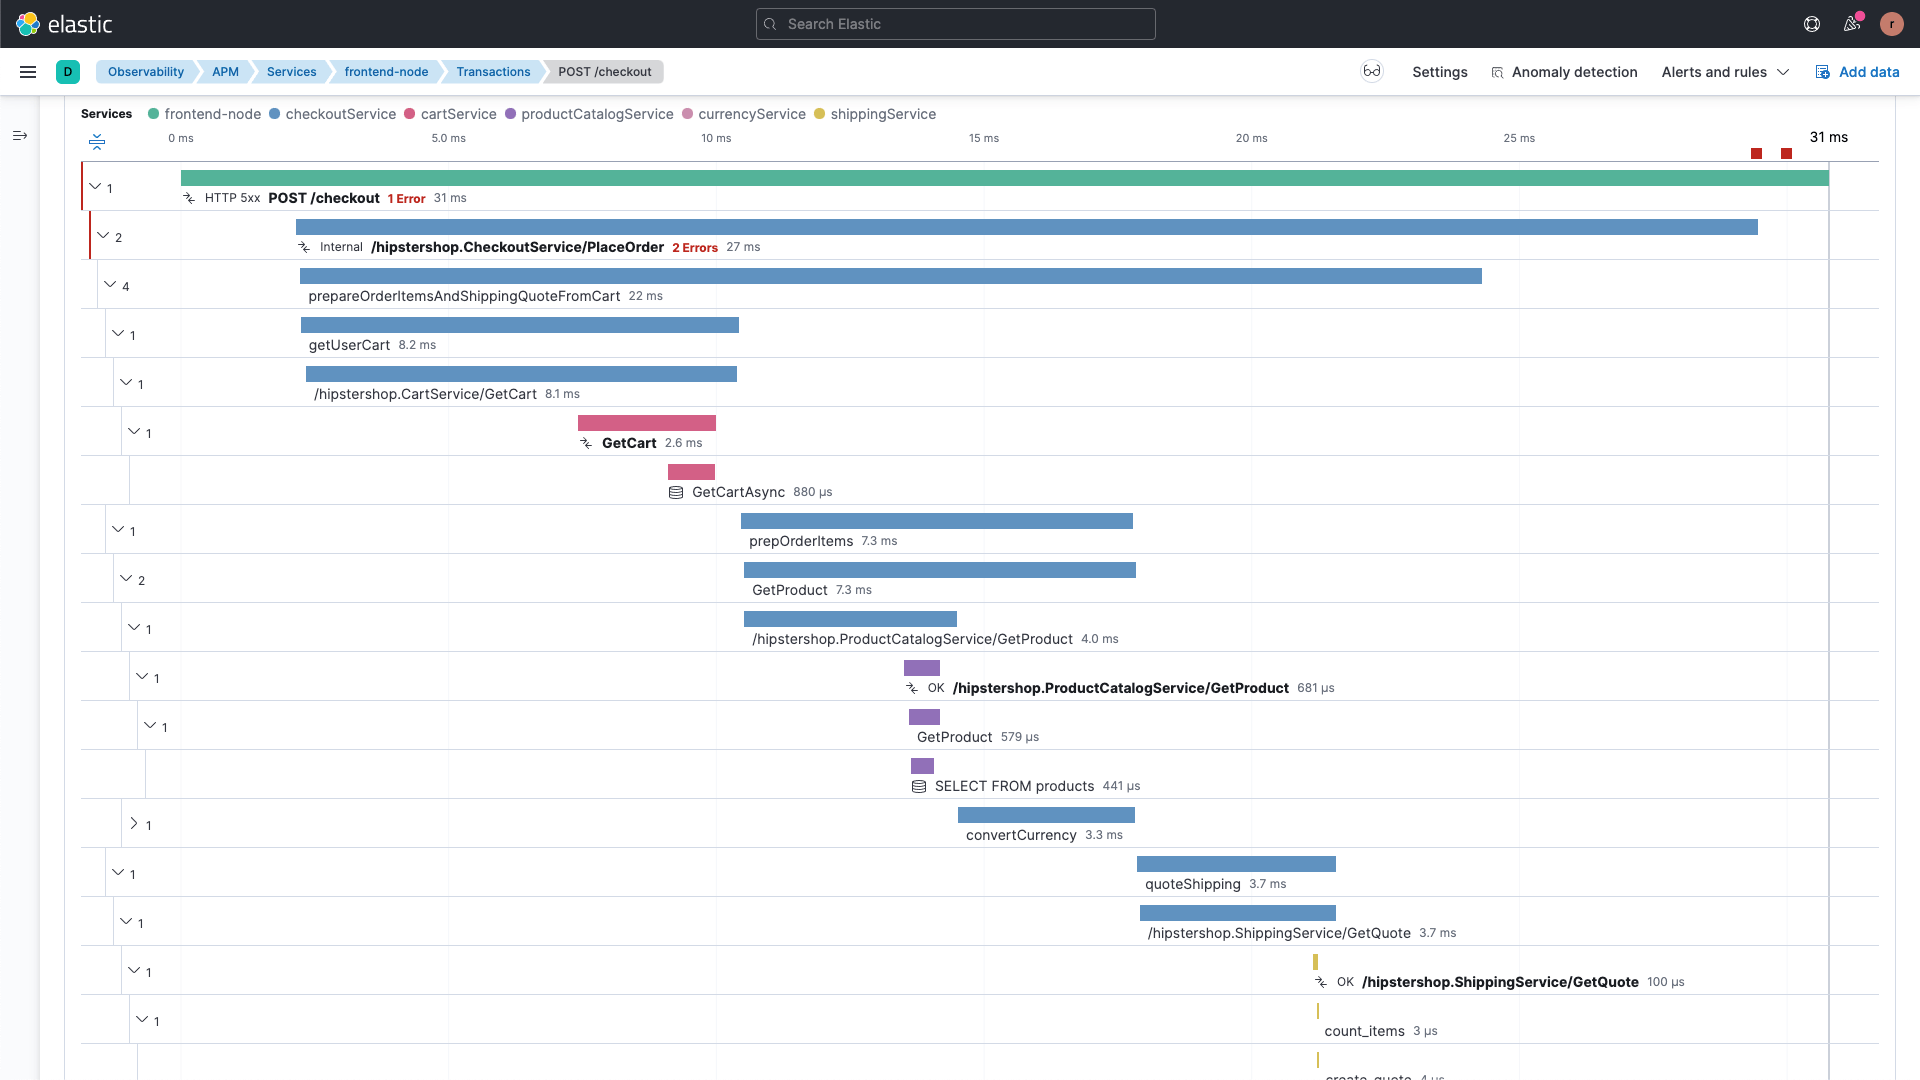
Watch nowImprove code quality with end-to-end distributed tracing
Capture and analyze distributed transactions spanning microservices, serverless, and monolithic architectures, including support for AWS Lambda, auto-instrumentation, and popular languages like Java, .NET, PHP, Python, Go, and more. Investigate each tier from the client to the application and cloud services with enriched transaction metadata and tagging for faster analysis. Minimize downtime and optimize customer experience by annotating transactions with customer data and deployment markers.
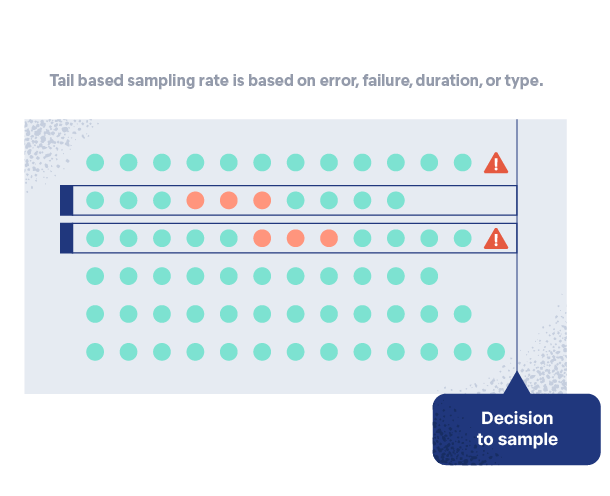
Never miss an issue with smarter sampling
Scalable and flexible architecture welcomes full fidelity, 100% transaction sample capture, storage, analytics, and search with the added dials to scale sampling up or down as needed. Get fine-grained control over sampling conditions with tail-based sampling of transactions for optimal visibility.
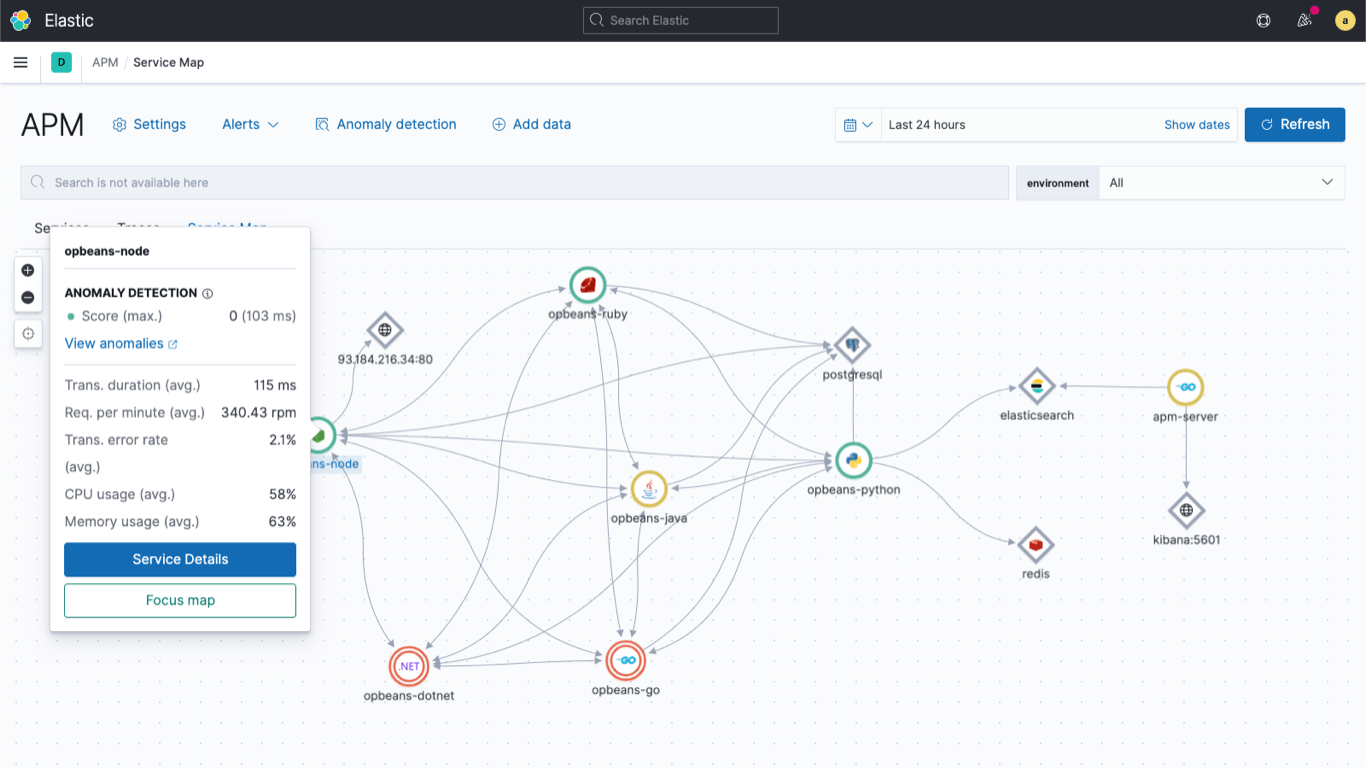
Quickly identify application problems with dependency mapping
Identify performance issues with automated and curated visual representation of all dependencies, including cloud, messaging, data store, and third-party services and their performance data. Drill into anomalies, transaction details, and metrics for deeper analysis.
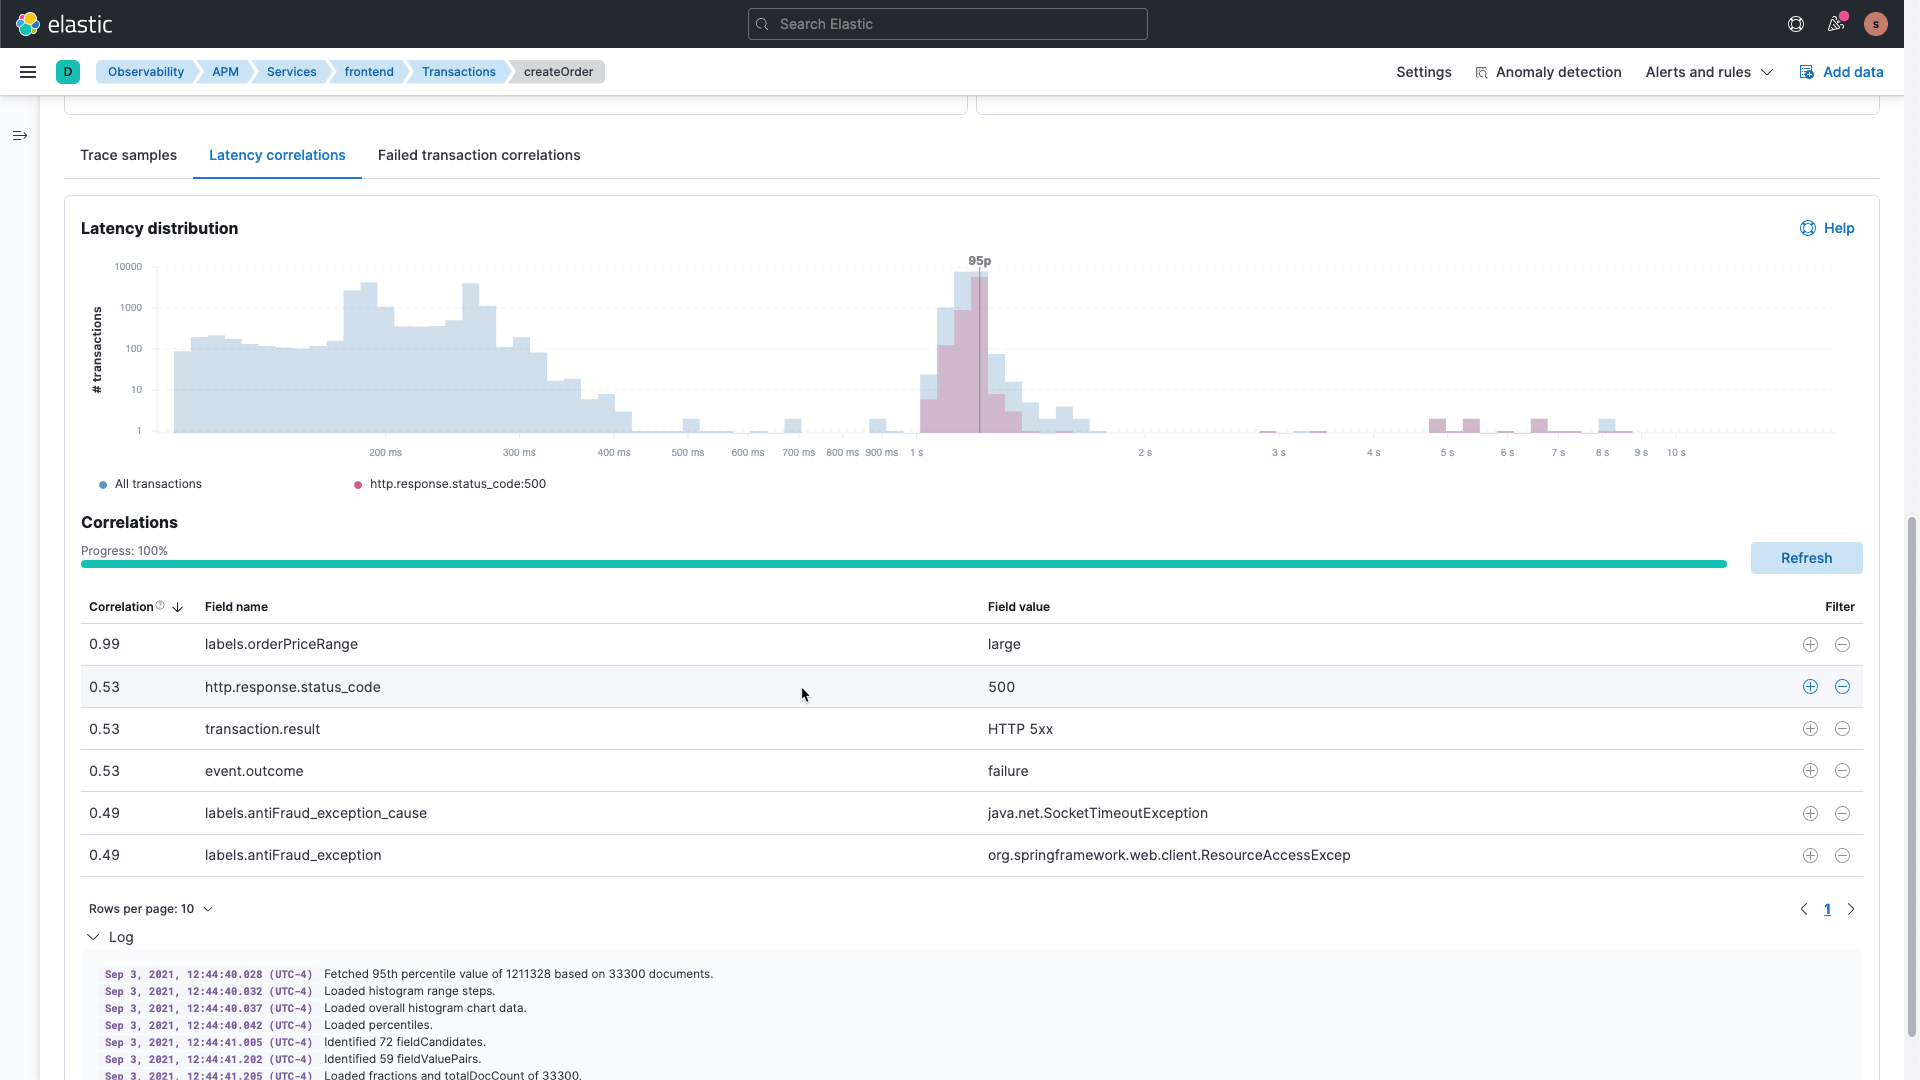
Accelerate root cause analysis with machine learning and AIOps
Automatic anomaly detection using machine learning along with latency, error, and failure correlations makes finding problems (even those hard to pin down intermittent problems!) easy compared to traditional monitoring techniques.
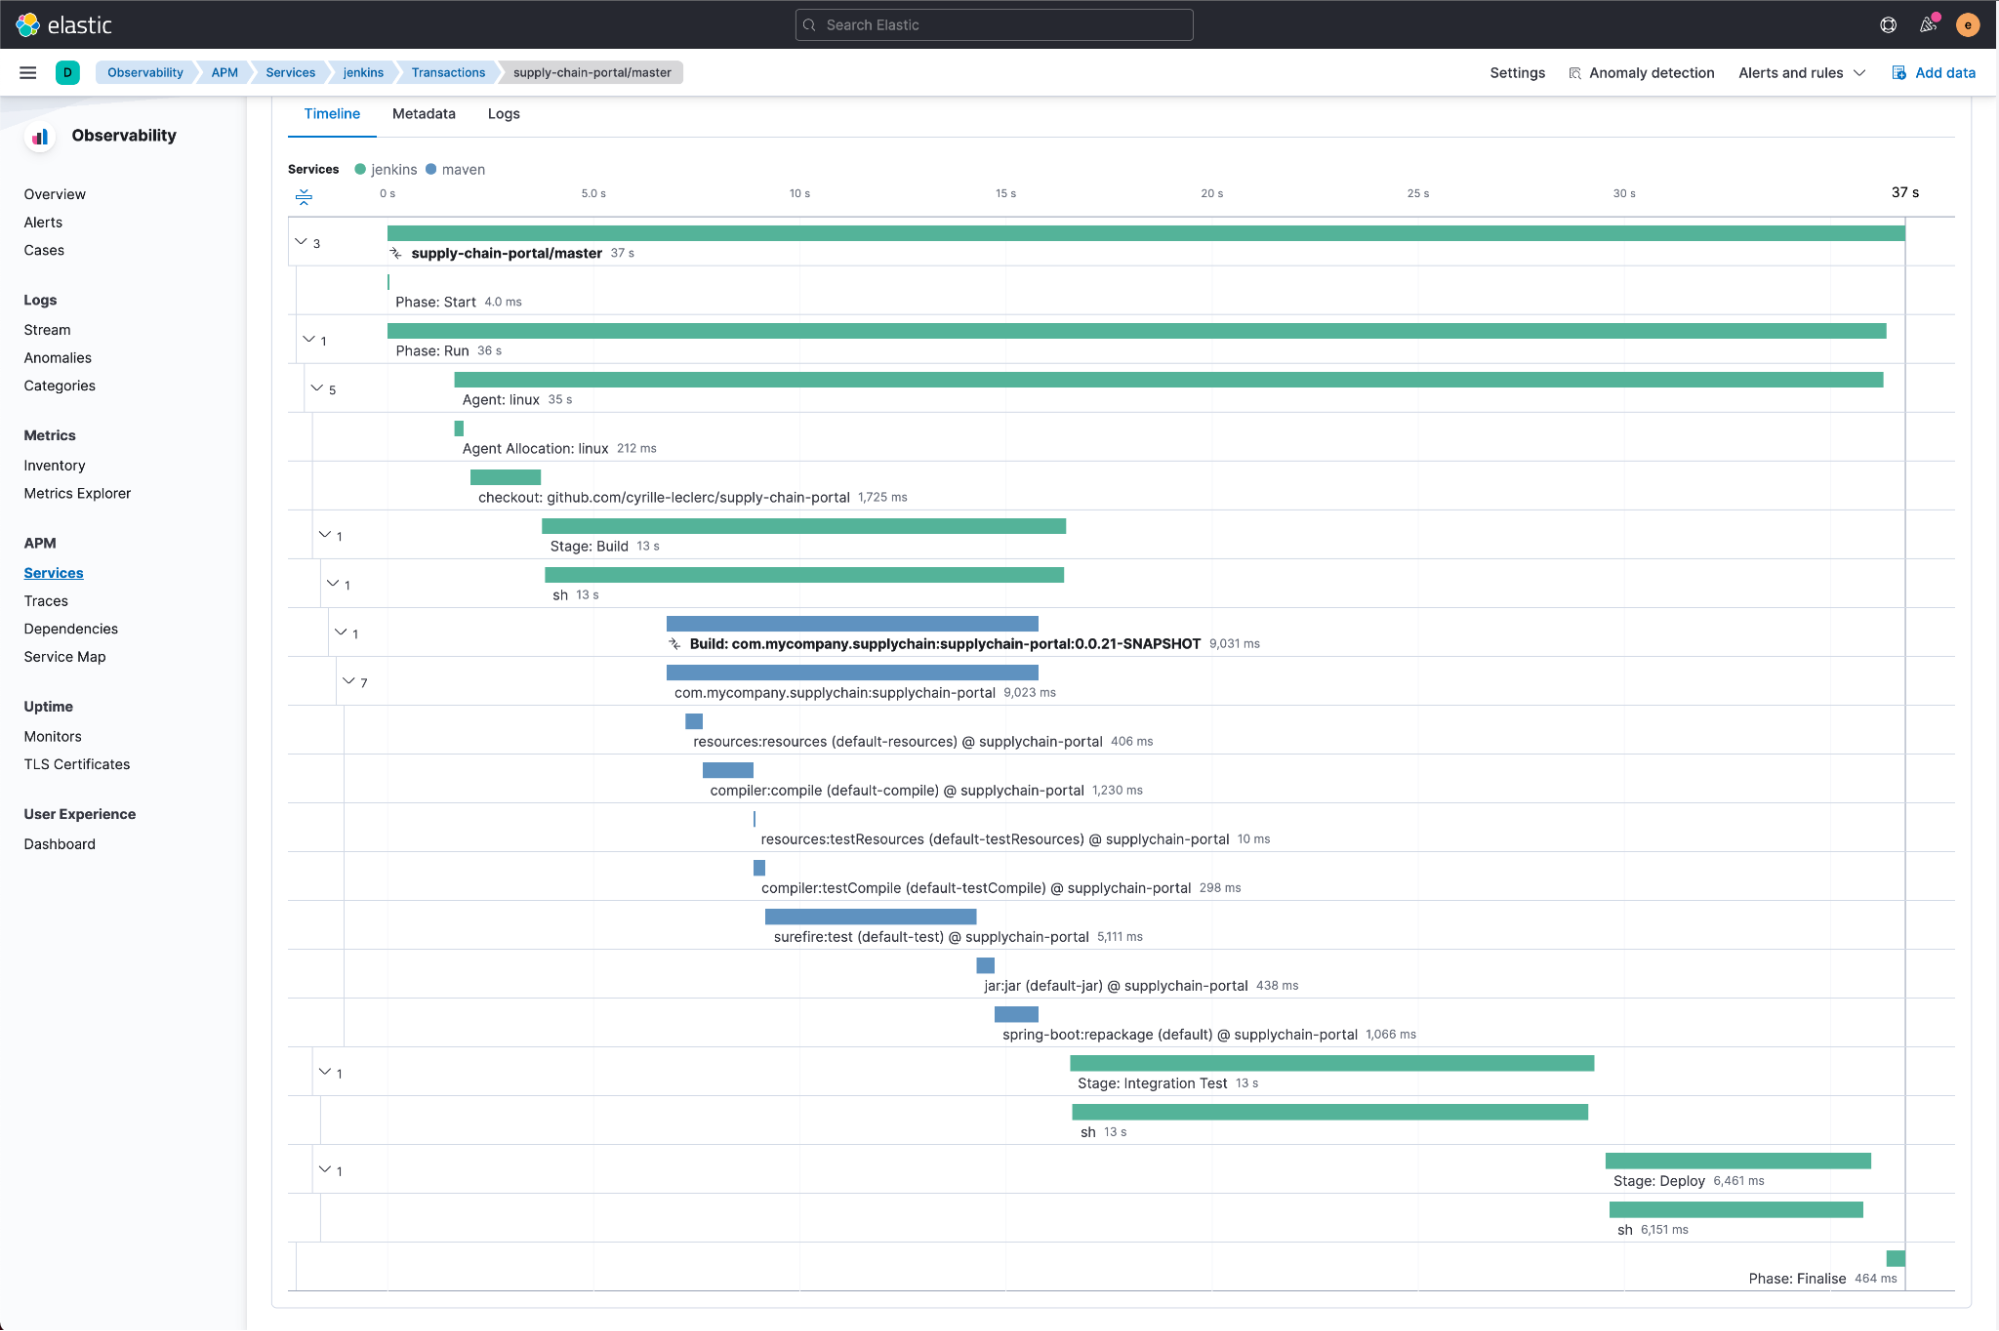
Deploy with confidence with CI/CD pipeline visibility
Identify and quantify application performance changes with continuous visibility during new or “blue vs. green” deployments. Find the root cause of the problem, narrowing down to a release, version or troublesome nodes alongside access to contextual traces, logs, and metrics. Get insight into error-prone jobs, slow builds, and flaky tests with Elastic contributed open standards based OpenTelemetry plugins for Jenkins, Maven and Ansible.
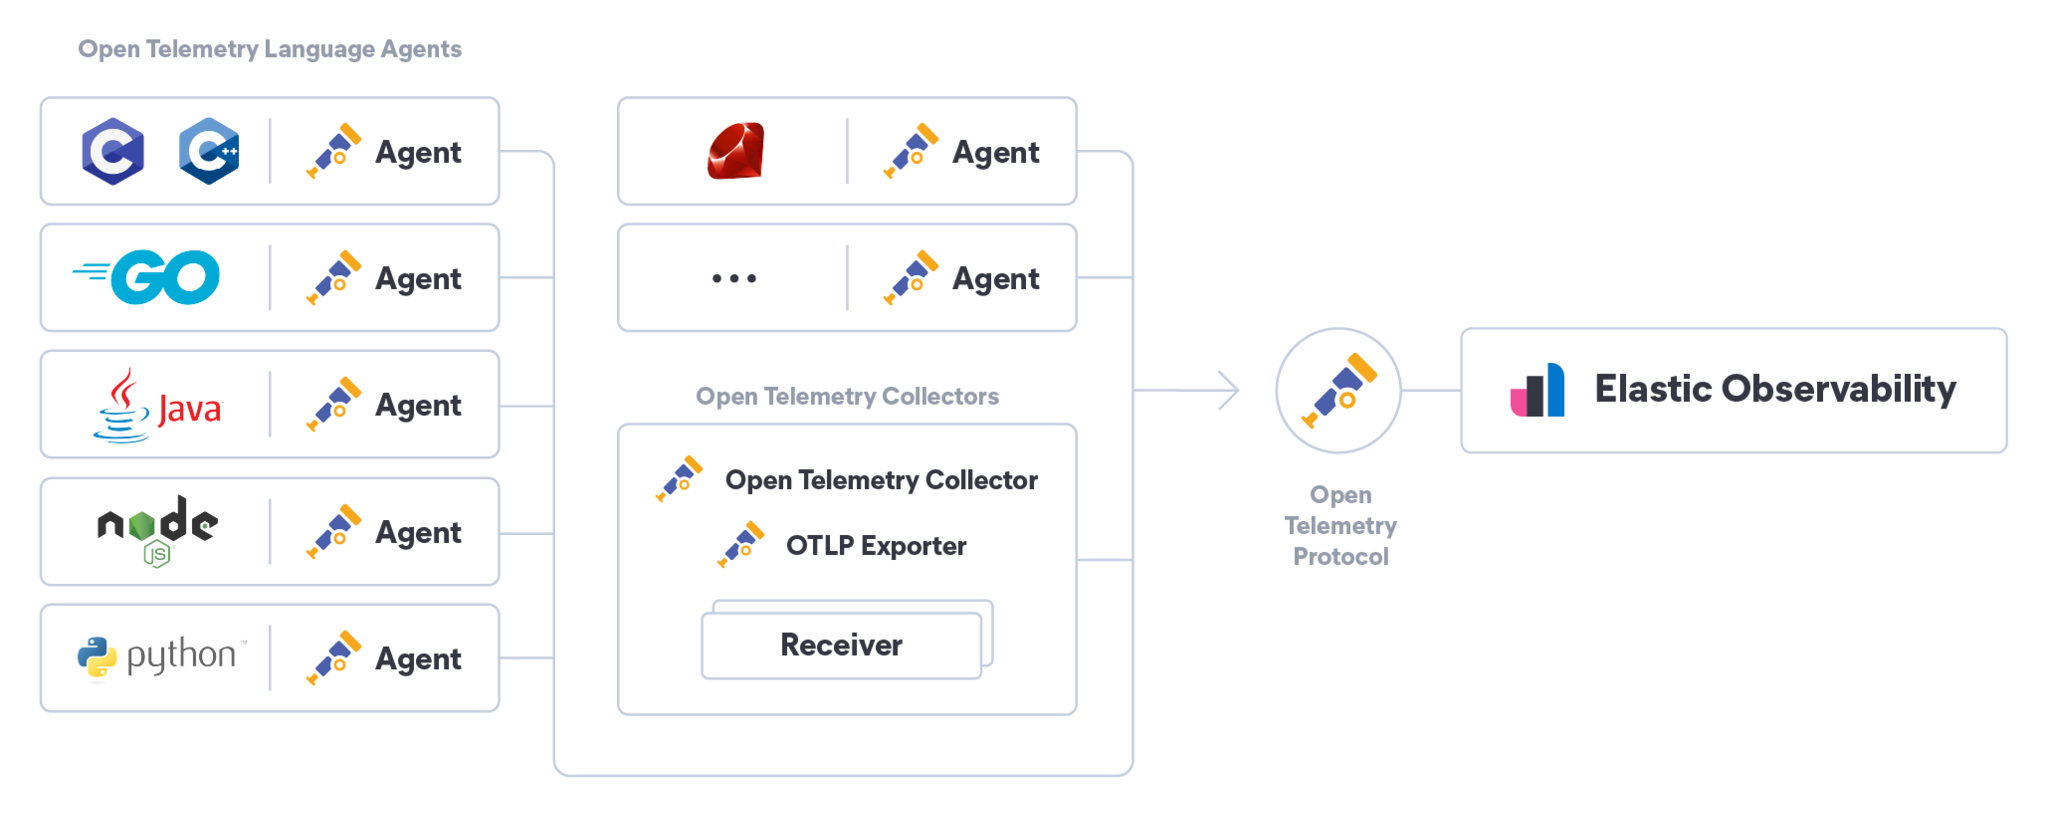
Developer-friendly, open standards support
Support for open standards includes native support for the OpenTelemetry protocol, W3C trace context, and Jaeger. OpenTelemetry and open standard data sources future-proof your observability investments by providing maximum flexibility and reducing the cost of future integration efforts.
Application performance monitoring (APM) is just one way to observe your apps
Monitor your infrastructure, your logs, and your users all within a single solution.

