Secure your cloud with Cloud Workload Protection in Elastic Security

 Share on Twitter
Share on Twitter

 Share on LinkedIn
Share on LinkedIn

 Share on Facebook
Share on Facebook

 Share by Email
Share by Email

 Print this page
Print
Getting Started with Cloud Workload Protection in Elastic Security
With the Elastic 8.2 release, we are excited to introduce the beginning of Cloud Security capabilities, with Cloud Workload Protection use cases, within Elastic Security. When Cmd joined forces with Elastic Security last August, we set out on a journey to bring cloud workload runtime security capabilities that allow customers to detect, prevent and respond to attacks on their workloads —- whether running on the cloud or in data centers.
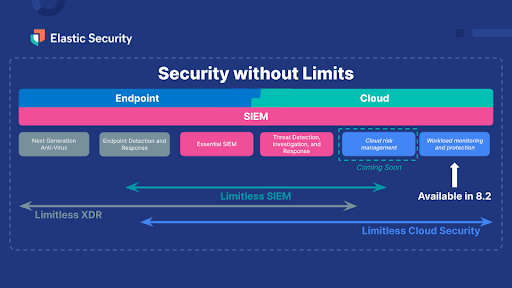
Now with 8.2, you get instant access to the new workload protection capabilities:
- Enhancing Data Collection for Cloud Workloads using eBPF: Linux is the de facto standard for highly available and reliable workloads. To protect workloads, we need an efficient way to capture runtime data from workloads. We have made additions to Endpoint Security data collection mechanisms to include eBPF. eBPF is a kernel technology that allows programs to run without modifying the kernel source code or adding additional modules, thereby making it performant and secure to run on Linux kernels. And to ensure all our users are protected, we remain compatible with a broad set of supported OSs using existing data collection mechanisms.
- Schema Extensions to Linux Logical Event Model: The Linux logical event model with events like fork, exec, process exit and setsid is the basic framework used to generate the data for Session View. A lot of work (detailed in this blog) has been done to define and convert this data model to Elastic Common Schema (ECS), so it can be easily searched and indexed in Elasticsearch. This allows security practitioners to get context around what’s happening in these workloads. For example, if a security alert was generated in a workload, we can dig into exactly what a user or service was doing in a session during a certain time.
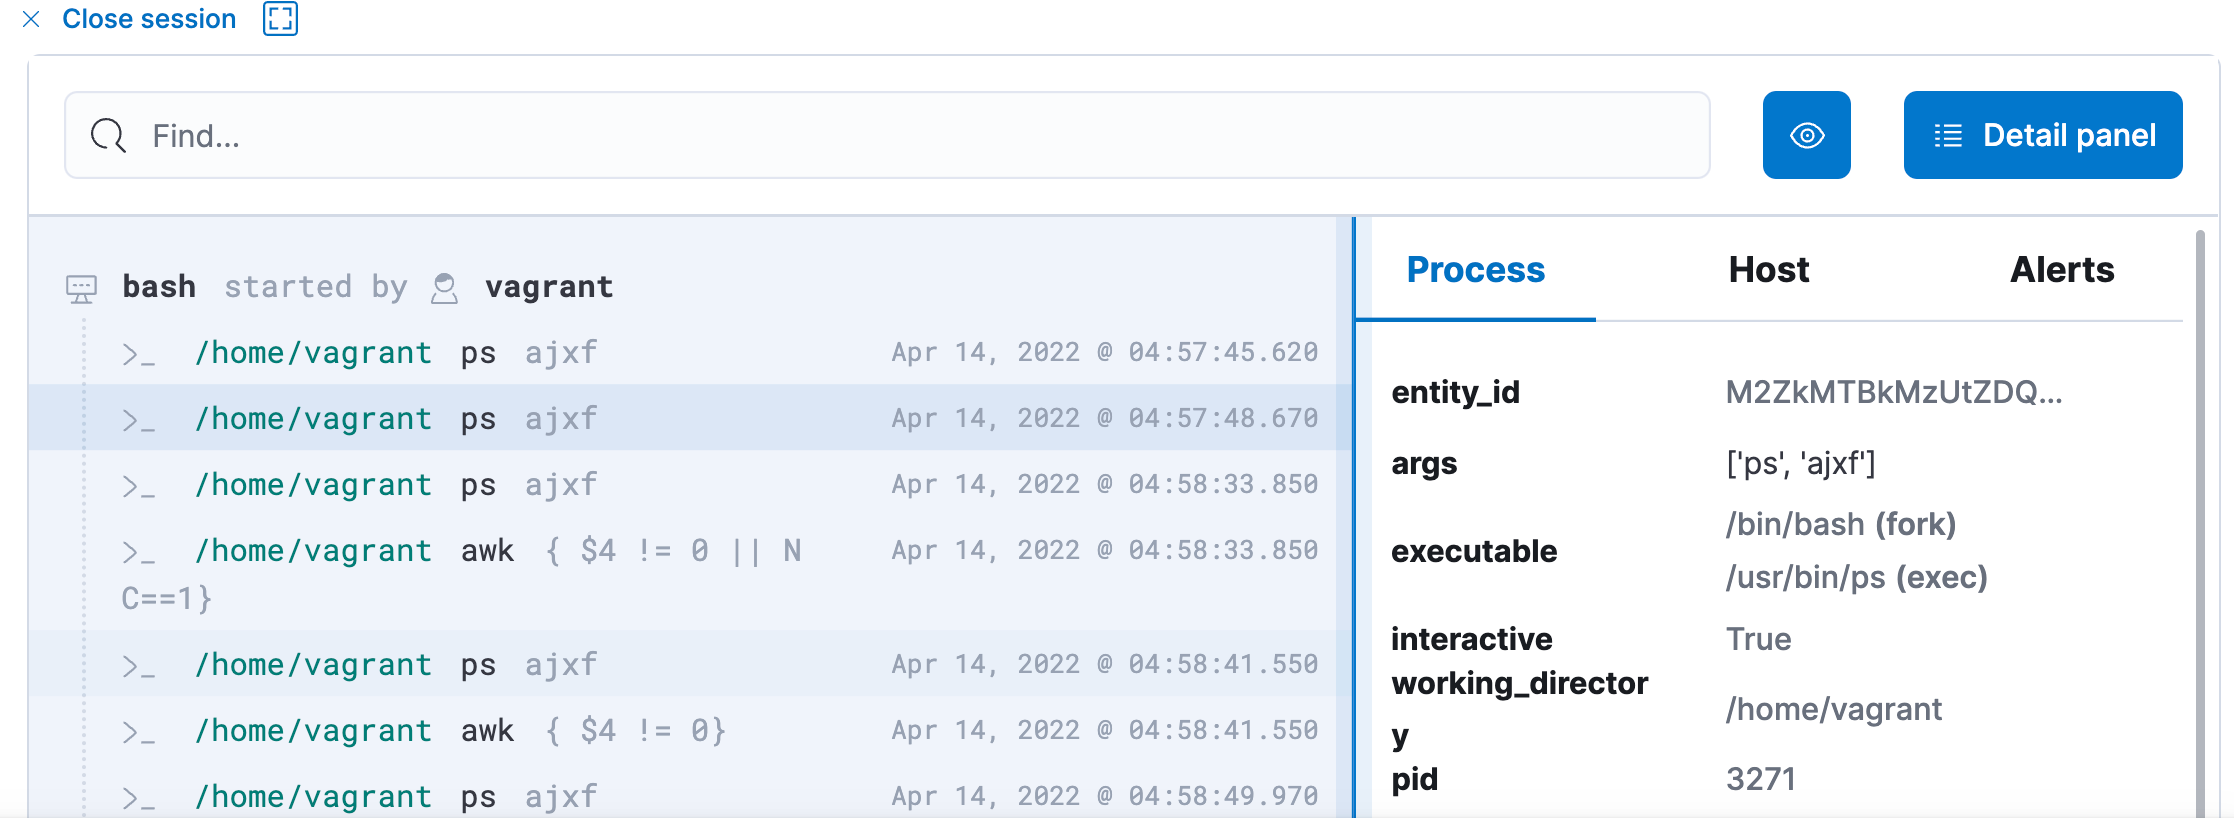
- Investigate Workloads in a Familiar Way using Session View: Finally, the trademark feature of Cmd — Session View — is now available in Beta. Session View presents a time-ordered series of process executions in your Linux workloads, appearing like a terminal shell. It can help practitioners investigate user and service behavior on workloads.
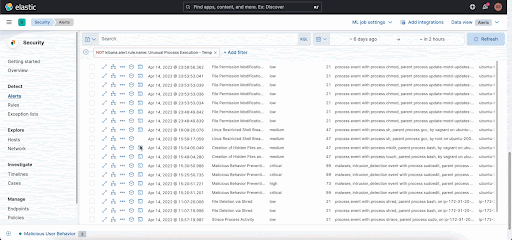
Session View is integrated into important workflows in Elastic Security, including alerting, investigation, and host exploration. This helps security analysts access rich environmental context while triaging an alert on a host. You can get additional information about each command executed like user name and arguments entered, and also information about parent process, entry leader, group leader. You can view alerts that are generated and take actions like opening a case and running an Osquery directly from Session View!
Getting Started with Cloud Workload Protection
With these exciting updates, I am sure you're wondering how to get started with protecting your cloud workloads. Follow these step-by-step instructions to begin. For this walk-through, I am going to use AWS EC2 instances as the workload I would like to monitor and protect.
- Start a Cloud Trial or upgrade your Elastic Security installation to 8.2.
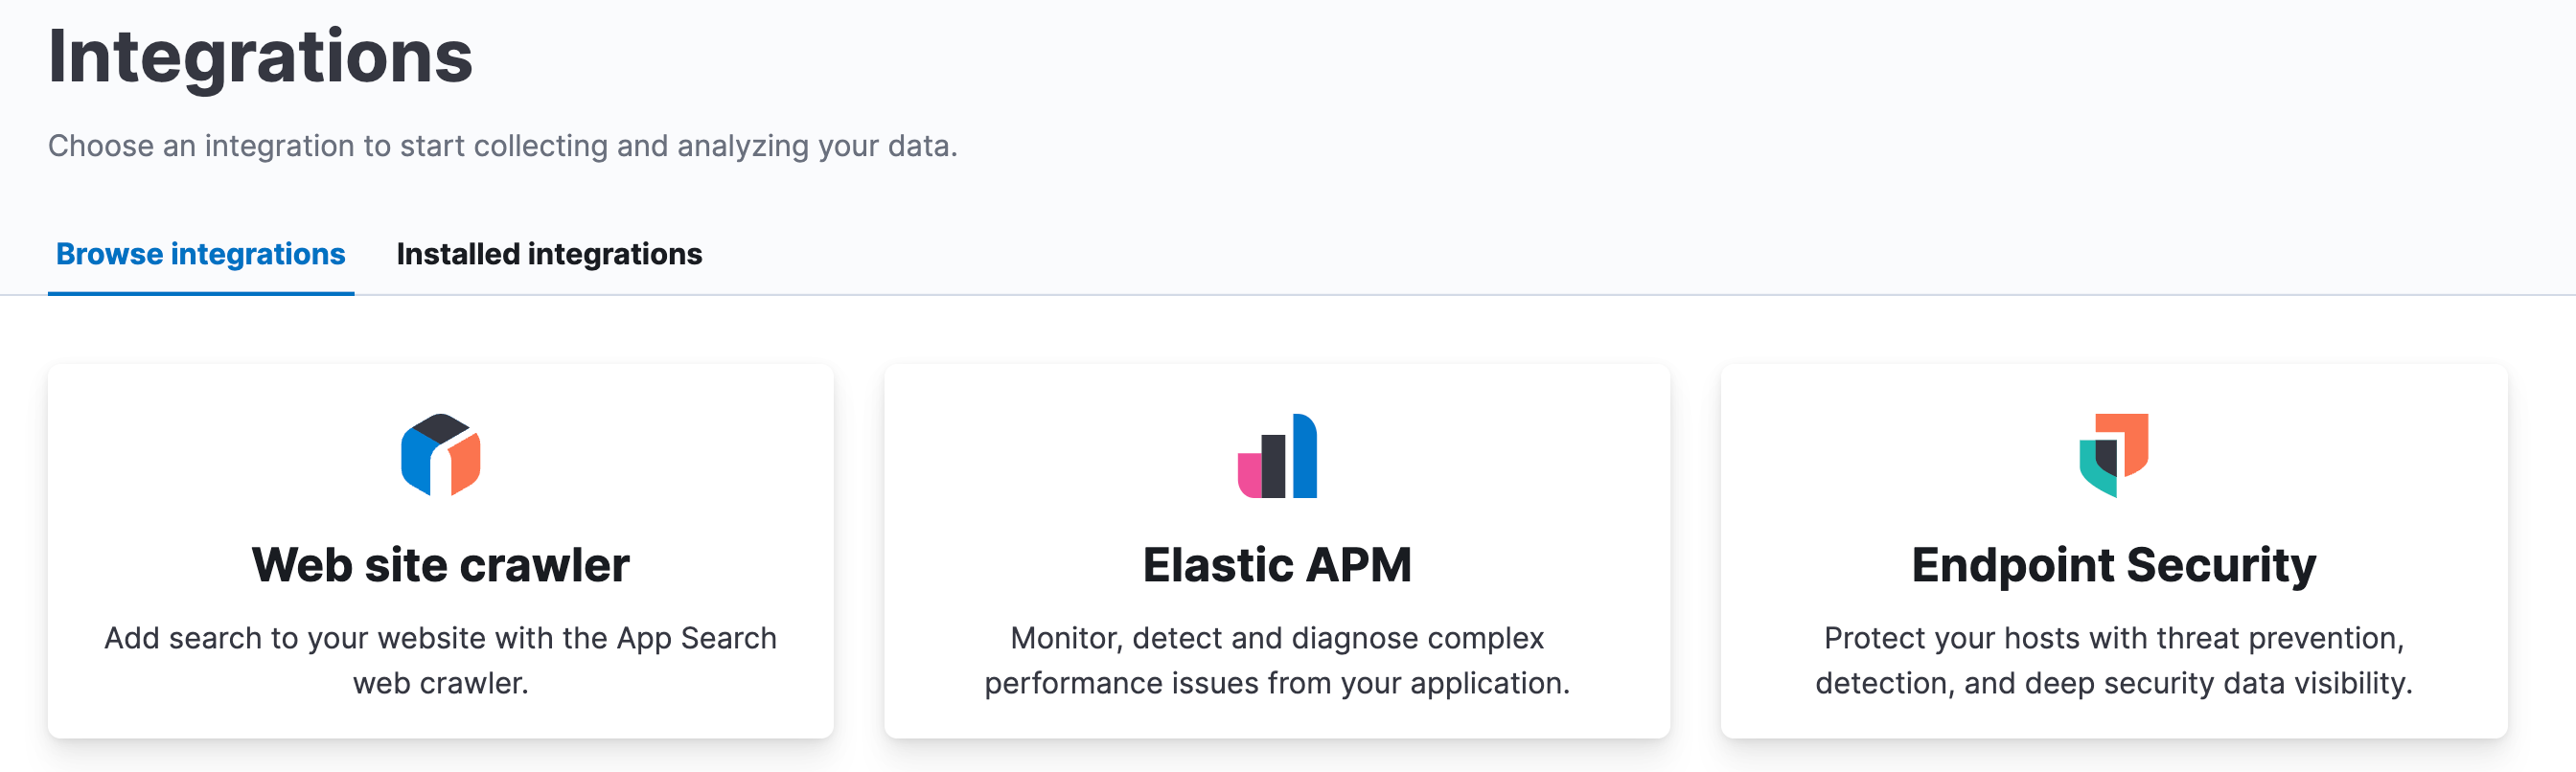
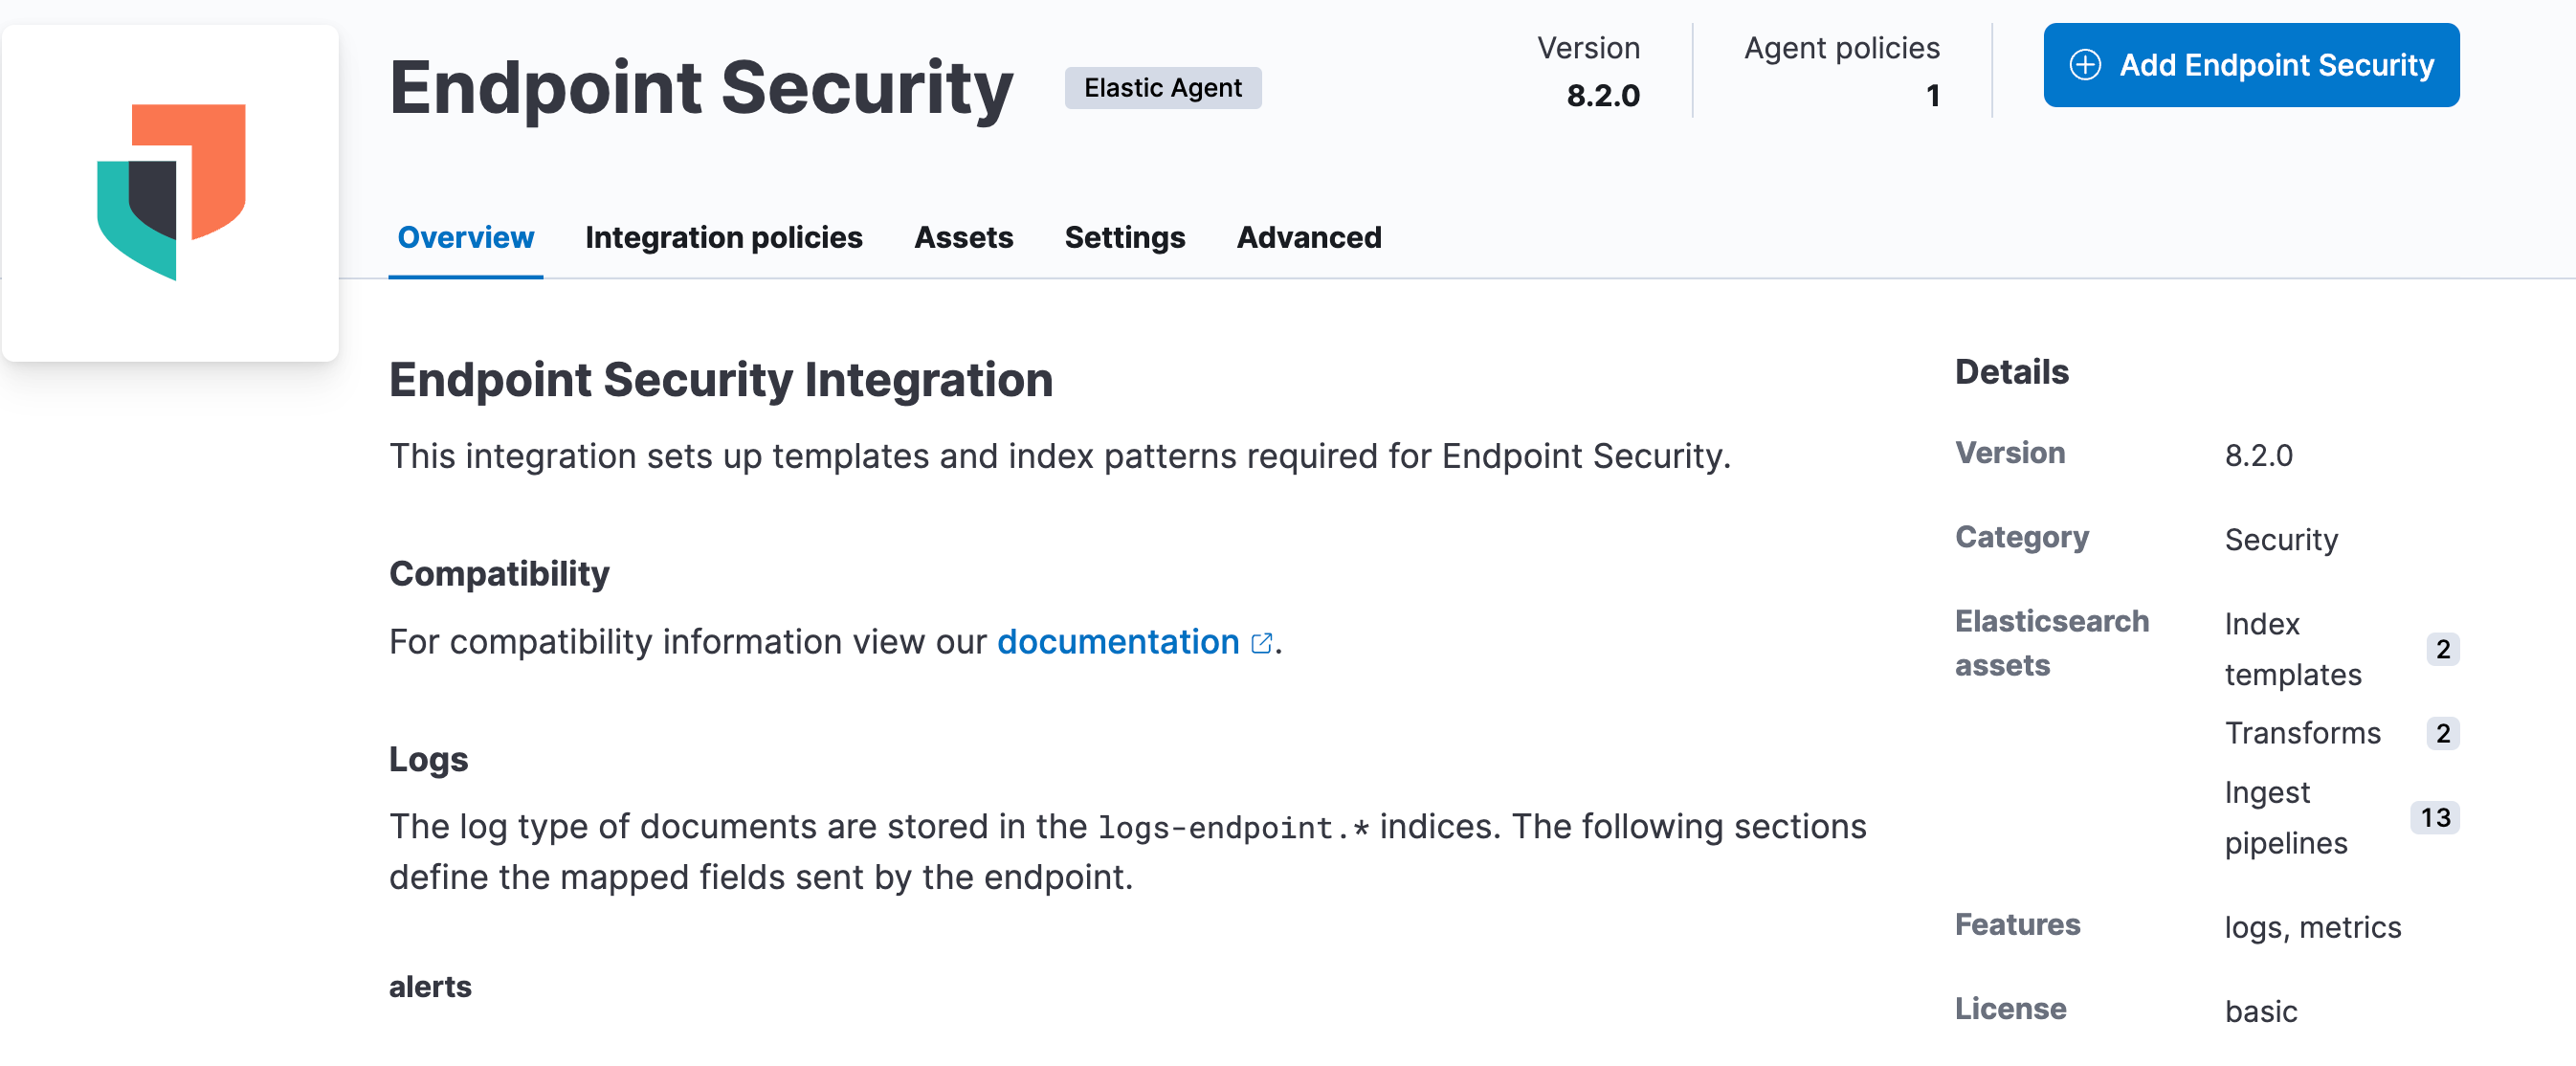
- Once you have upgraded to Elastic Security 8.2, navigate to Integrations, then Endpoint Security.
- Click the “Add Endpoint Security” button.
- Follow the steps on the next page. If necessary, create an Agent Policy.
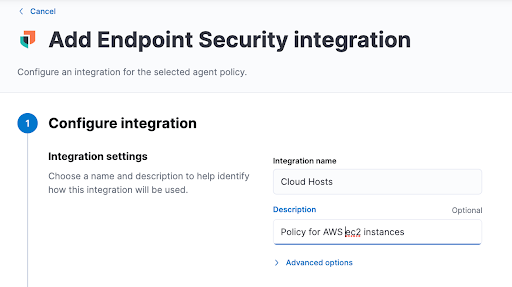
- Once you have added the integration to the policy, go to Integration policies and click on the new policy.
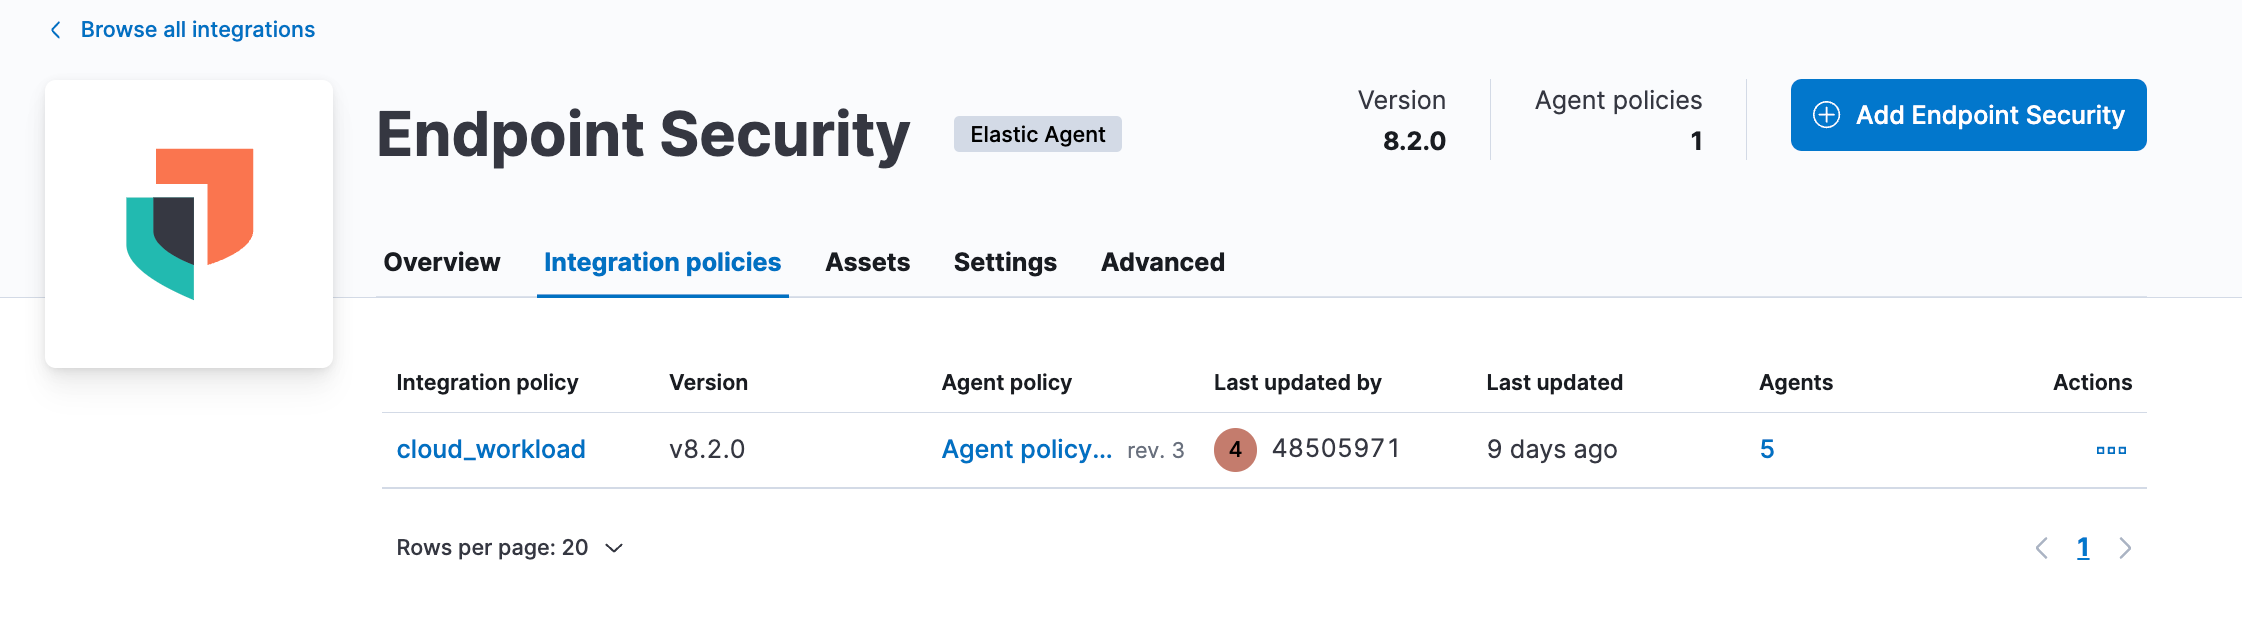
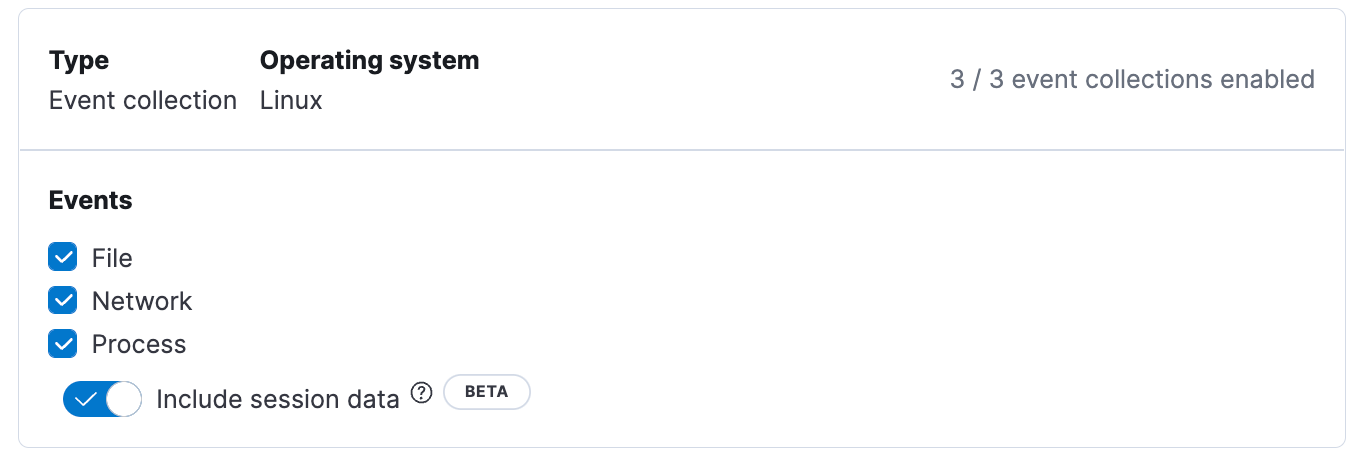
- From the Integration Policy page, navigate to the Event Collection section for Linux systems. Then enable Include Session Data and click Save. Note that you need to finish this step to enable session data on any new or existing host before you install the agent on the server or VM.
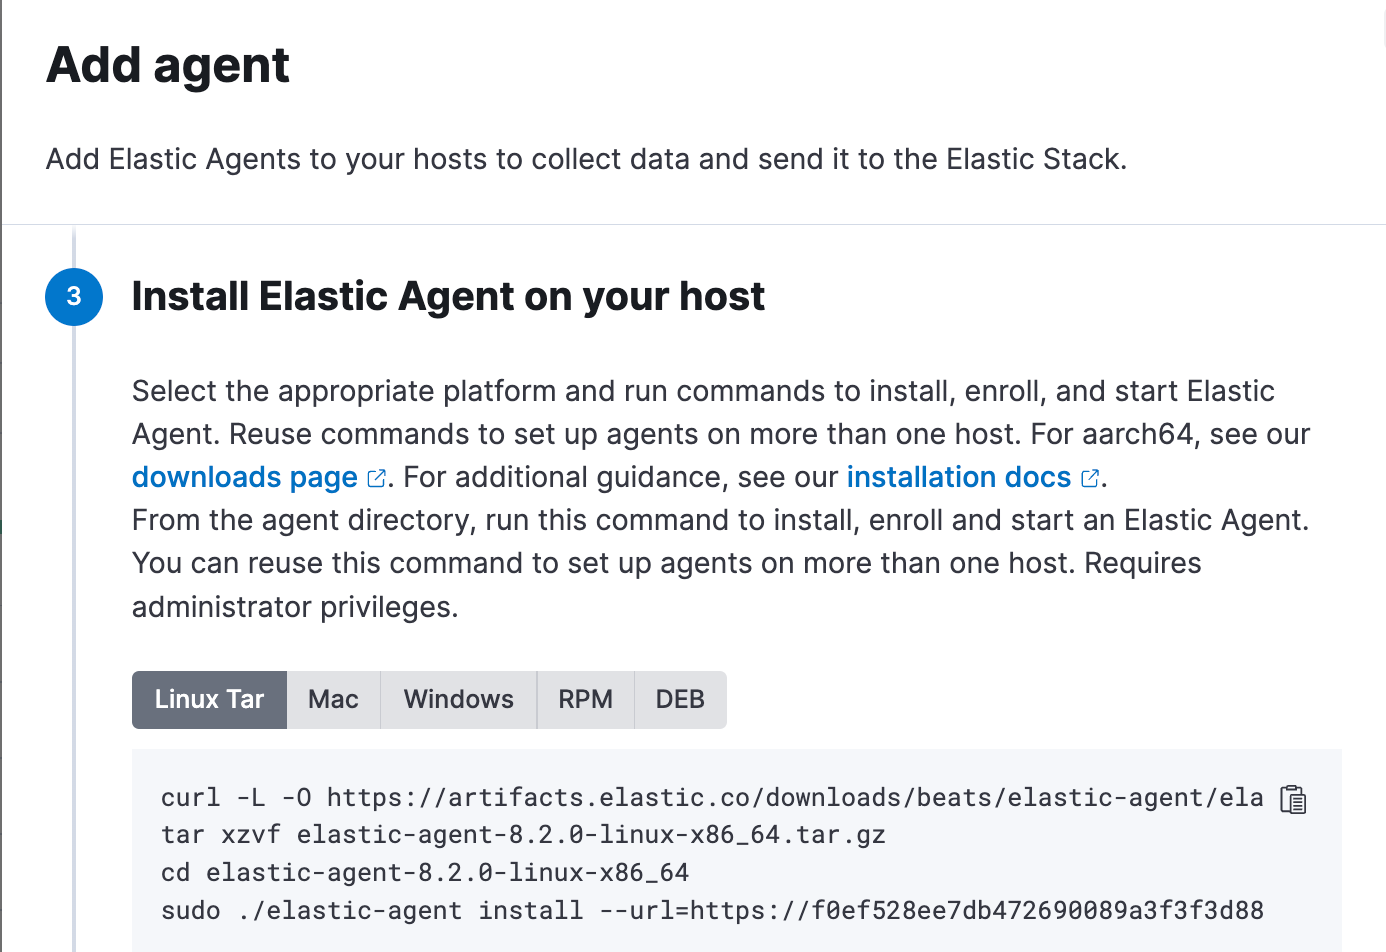
- Now login/SSH into your AWS Terminal Shell to install Agent and Endpoint. Follow the Add Agent instructions and install Elastic Agent on your EC2 instance.
- Ensure the Elastic Agent process is running by executing the following:
ps -aux | grep elastic - Navigate to Elastic Security → Hosts → Sessions Tab. You should see a Session Table which gives an audit trail of all the session leaders across various hosts.
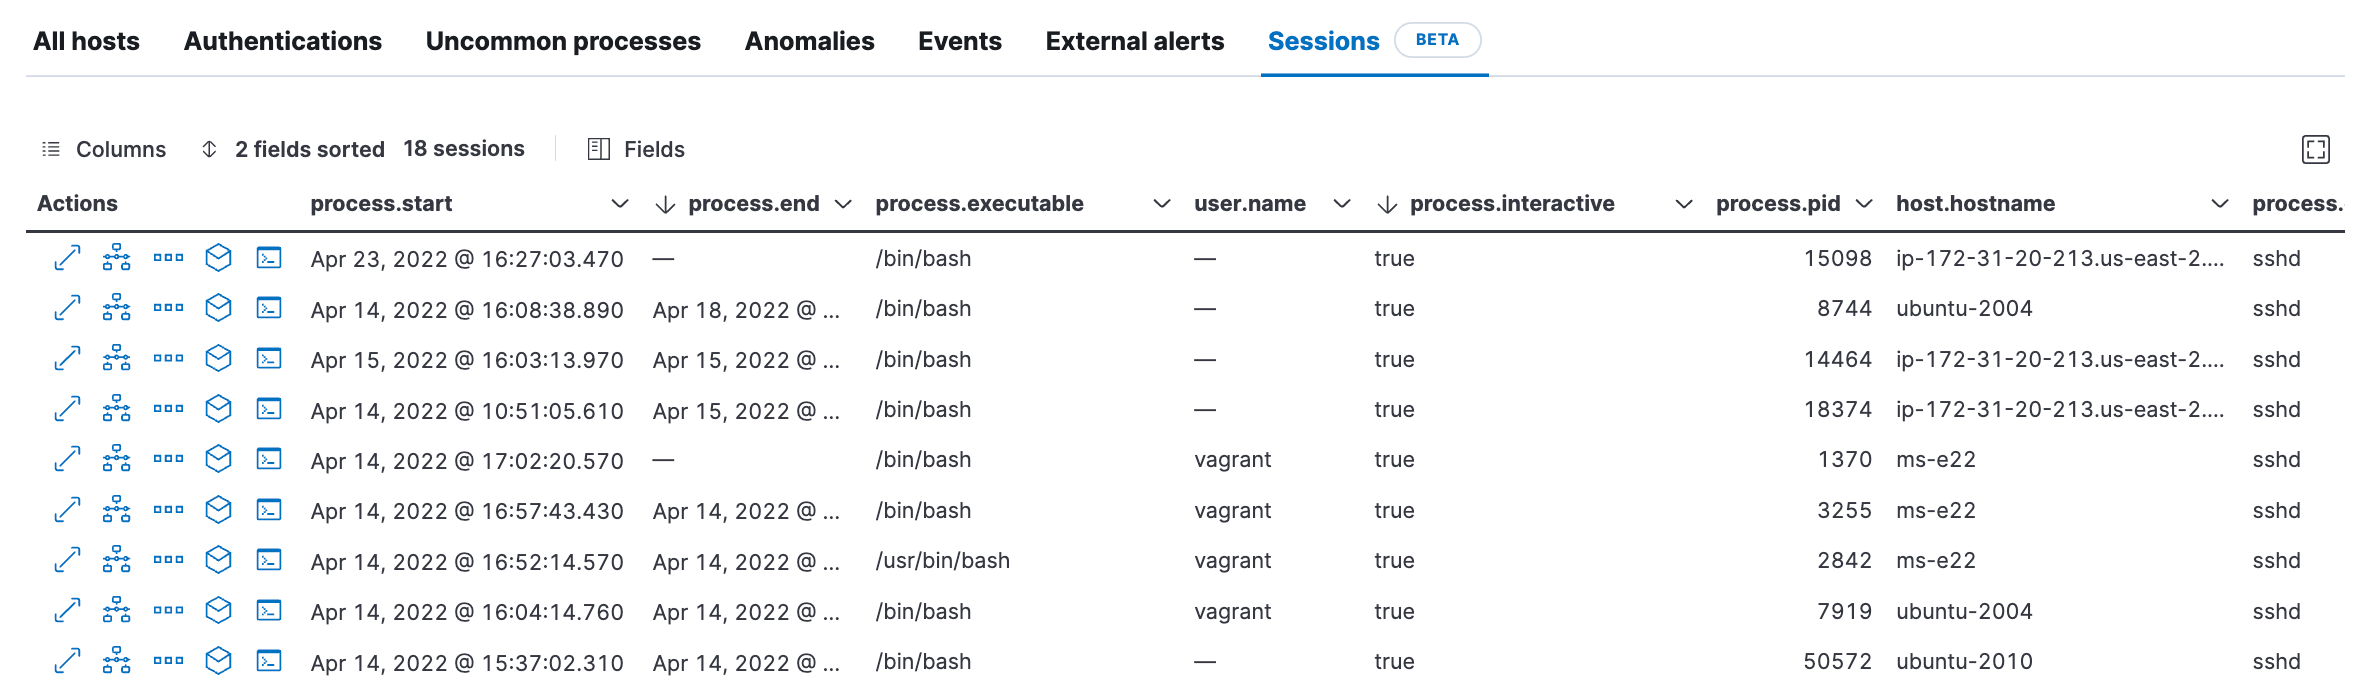
- Click on the Session View Icon [>_]to examine what's happening in each session by each user.
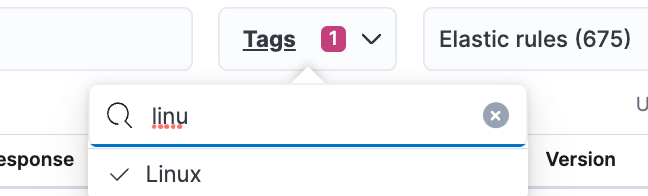
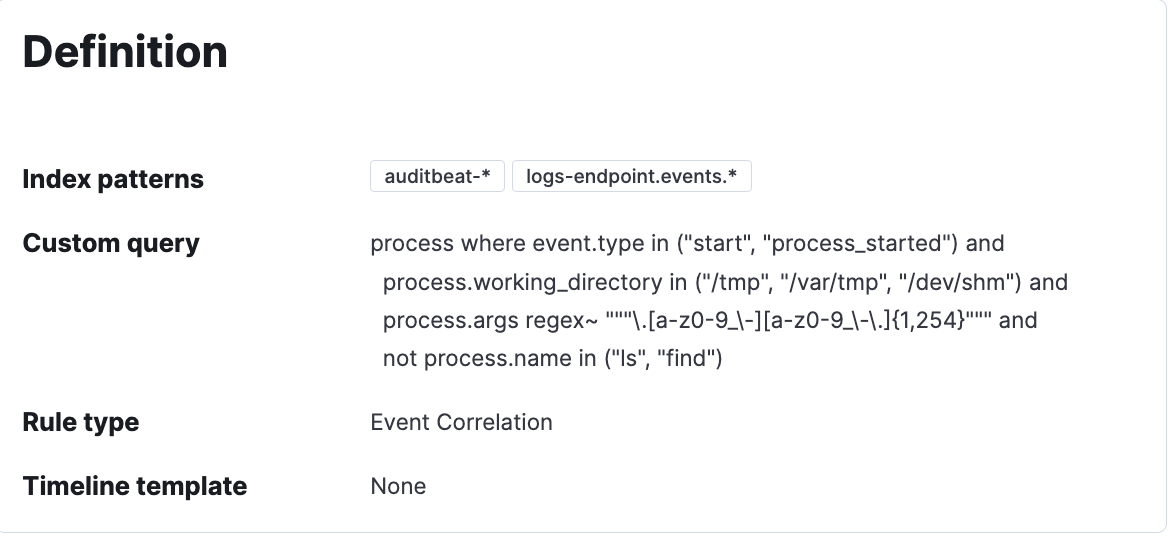
- Rules for Workload Protection : Navigate to Elastic Security → Detect → Rules . Enable the Linux tag and explore the rules which make sense for your workload and enable those rules. You can enable 68 prebuilt Linux rules and 18 Machine learning rules based on the MITRE framework. Note that any rule which has the index logs-endpoint-events* should enable Session Viewer.
Share
- Share on Twitter
Share on Twitter
- Share on LinkedIn
Share on LinkedIn
- Share on Facebook
Share on Facebook
- Share by Email
Share by Email
- Print this page
Print