Getting started with ES|QL (Elasticsearch Query Language)
Shorten your time to insights by creating aggregations, visualizations, and alerts directly from Discover with ES|QL


 Share on Twitter
Share on Twitter

 Share on LinkedIn
Share on LinkedIn

 Share on Facebook
Share on Facebook

 Share by Email
Share by Email

 Print this page
Print
What is ES|QL (Elasticsearch Query Language)?
ES|QL (Elasticsearch Query Language) is Elastic®'s new innovative piped query language, designed to speed up your data analysis and investigation processes by offering powerful computing and aggregation capabilities.
Navigate through the complexities of identifying unfolding cyber attacks or pinpointing production issues with enhanced ease and efficiency.
ES|QL not only simplifies searching, aggregating, and visualizing massive data sets but also empowers users with advanced features like lookups and real-time processing, all from a single screen in Discover.
ES|QL adds 3 powerful capabilities to the Elastic Stack
-
A new and fast Distributed & Dedicated Query Engine that powers _query. The new ES|QL query engine delivers advanced search capabilities with concurrent processing, improving speed and efficiency irrespective of data source and structure. The performance of the new engine is measured and is public. Follow along with performance benchmarking in this public dashboard.
-
A new and powerful piped language. ES|QL is Elastic’s new piped language that transforms, enriches, and simplifies data investigations. Learn more about ES|QL language’s capabilities in the documentation.
-
A new and unified data exploration/investigation experience that accelerates resolution by creating aggregations and visualizations from one screen delivering an uninterrupted workflow.
Why did we invest time and effort into ES|QL?
Our users need agile tools that not only present data but also offer efficient methods to make sense of it, as well as the ability to act on insights in real time and post ingest data processing.
Elastic’s commitment to enhancing users’ data exploration experience drove us to invest in ES|QL. It is designed to be accessible for beginners and powerful for experts. With ES|QL’s intuitive interface, users can start quickly and dive deep into their data without steep learning curves. The auto-complete and in-app documentation ensure that crafting advanced queries becomes a straightforward workflow.
Moreover, ES|QL doesn’t just show you numbers; it brings them to life. Contextual visualizations powered by Lens suggestion engine automatically adapt to the nature of your queries, providing a clear view of your insights.
Additionally, a direct integration into Dashboards and Alerting functionalities reflects our vision of a cohesive, end-to-end experience.
In essence, our investment in ES|QL was a direct response to the evolving needs of our community — a step toward a more interconnected, insightful, and efficient workflow.
Delving deeper into security and observability use cases
Our commitment to ES|QL also stems from a deep understanding of the challenges faced by our users (e.g., site reliability engineers (SREs), DevOps, and threat hunters).
For SREs, observability is essential. Every second of downtime or glitch can have a cascading effect on user experience and, consequently, the bottom line. An example of that is ES|QL’s Alerting feature: with its emphasis on highlighting meaningful trends over isolated incidents, SREs can proactively pinpoint and address system inefficiencies or failures. This reduces the noise and ensures they are reacting to genuine threats to system stability, making their response more timely and effective.
DevOps teams are consistently in a race against time, deploying multiple updates, patches, and new features. With ES|QL’s new and powerful data exploration and data visualization, they can quickly assess the impact of every deployment, monitor system health, and receive real-time feedback. This not only enhances the quality of deployments but also ensures rapid course correction, if needed.
For threat hunters, the security landscape is constantly evolving and changing. An example of how ES|QL empowers them in this changing landscape is the ENRICH feature. This feature allows them to look up data across different data sets, thereby unveiling hidden patterns or anomalies that might indicate a security threat. Additionally, contextual visualizations mean they don’t just see raw data but get actionable insights, presented visually. This drastically reduces the time taken to discern potential threats, ensuring quicker reactions to vulnerabilities.
Whether you’re an SRE trying to decipher a spike in server load, a DevOps professional assessing the impact of the latest release, or a threat hunter investigating a potential breach, ES|QL complements the user, rather than complicating the journey.
The next sections of the blog post will help you get started with ES|QL and showcase some tangible examples of how powerful it is when exploring your data.
How to get started with ES|QL in Kibana
To begin using ES|QL, navigate to Discover and simply select Try ES|QL from the data-view picker. It’s user-friendly and straightforward.
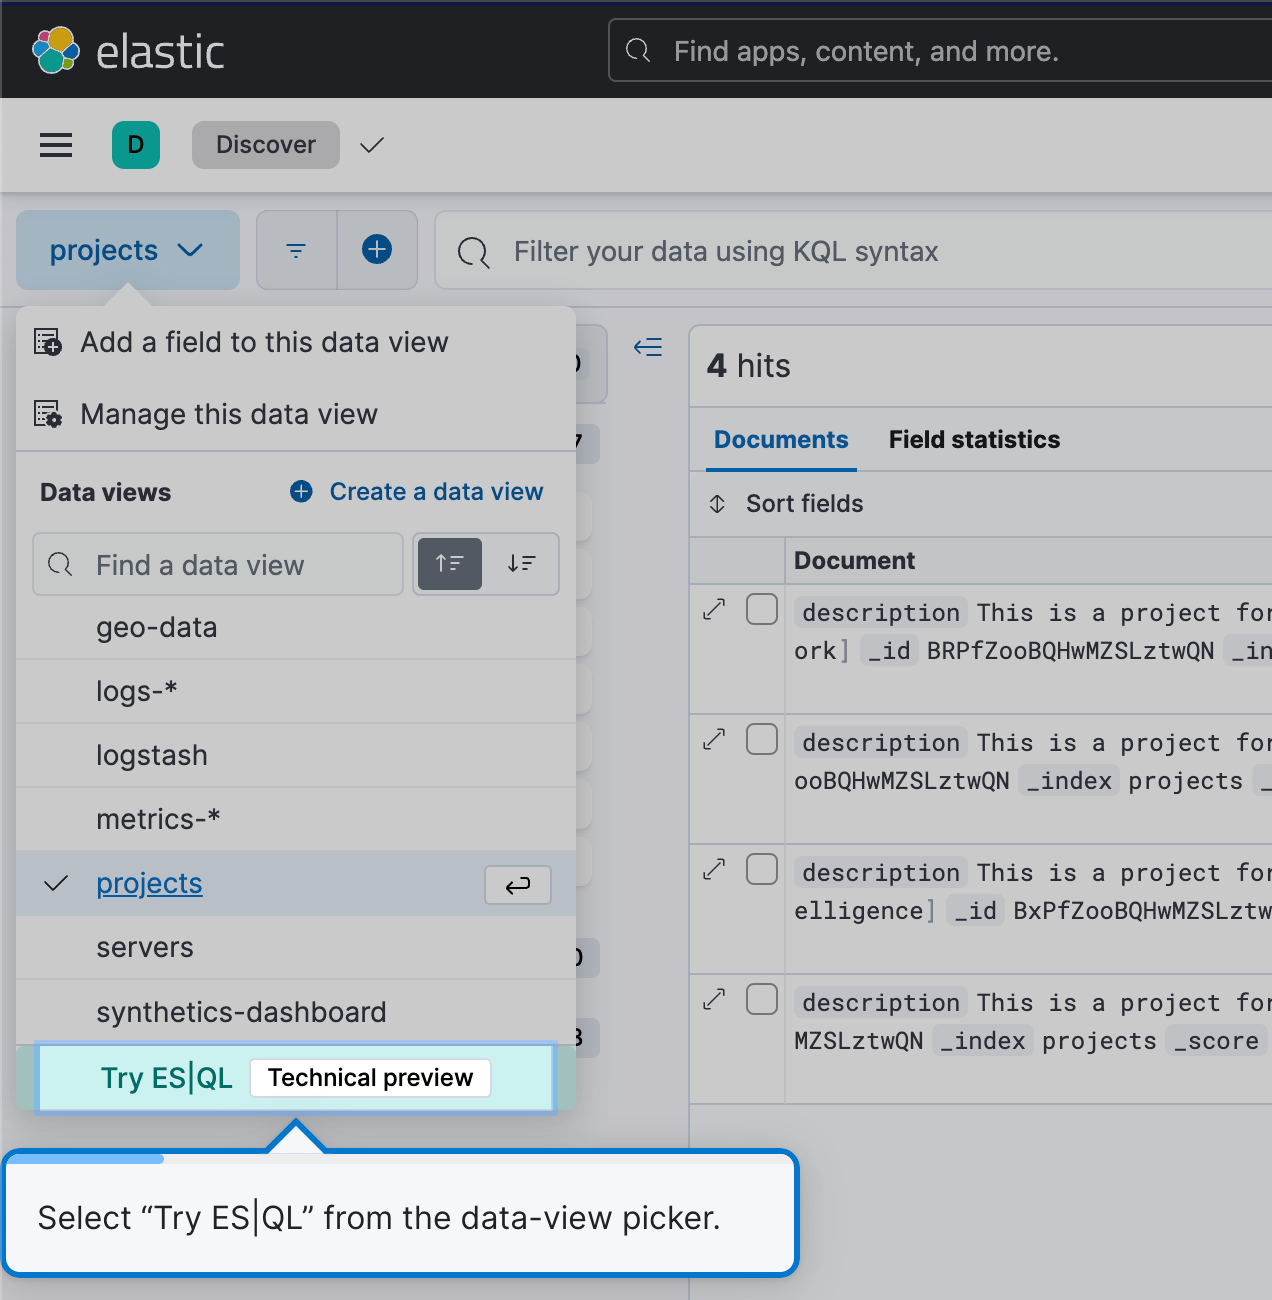
This will get you into ES|QL mode in Discover.
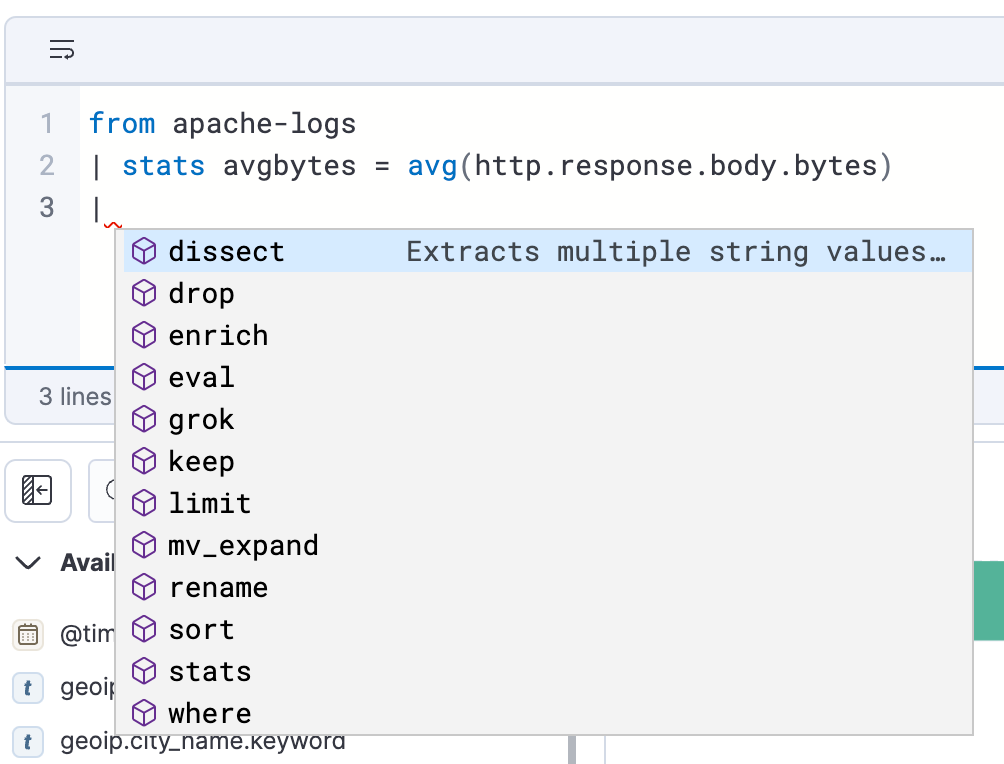
Efficient and easy query building
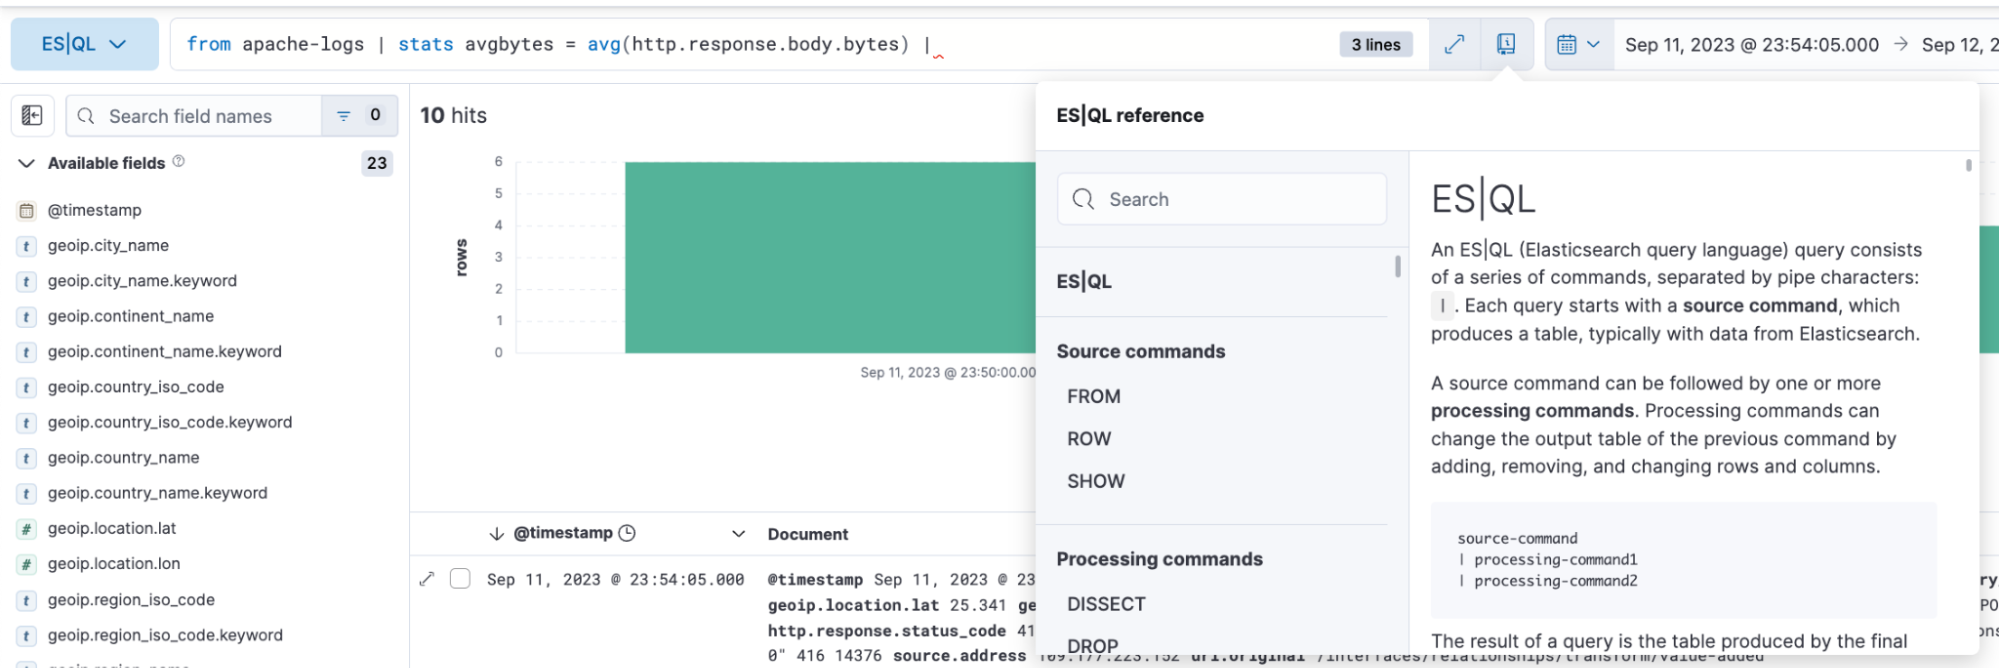
ES|QL in Discover offers auto-complete and in-app documentation, making it easy to craft powerful queries right from the query bar.
How to analyze and visualize data with ES|QL
With ES|QL, you can do comprehensive and powerful data exploration. It allows you to conduct ad-hoc data exploration within Discover, create aggregations, transform data, enrich data sets, and more, directly from the query builder. Results are presented in a tabular format or as visualizations — it depends on the query you are executing.
Below you will find examples of ES|QL queries for observability and how the results are represented in both a tabular format and as a visual representation.
ES|QL query with metrics use case:
from metrics*
| stats max_cpu = max(kubernetes.pod.cpu.usage.node.pct), max_mem = max(kubernetes.pod.memory.usage.bytes) by kubernetes.pod.name
| sort max_cpu desc
| limit 10The above query is showcasing how you can utilize following source command, aggregation functions, and processing commands:
from source command (documentation)
from metrics*: This initiates a query from index patterns that match the pattern “metrics*.” The asterisk(*) acts as a wildcard, meaning it will select data from all index patterns whose names start with “metrics.”
stats…by aggregations (documentation), max (documentation), and by (documentation)
This segment aggregates data based on specific statistics. It breaks down as follows:
max_cpu=max(kubernetes.pd.cpu.usage.node.pct): For each distinct “kubernetes.pod.name,” it finds the maximum CPU usage percentage and stores that value in a new column named “max_cpu.”
max_mem = max(kubernettes.pod.memory.usage.bytes): For each distinct “kubernetes.pod.name,” it finds the maximum memory usage in bytes and stores that value in a new column named “avg_mem.”
Processing commands (documentation)
- sort (documentation)
- limit (documentation)
sort max_cpu desc: This sorts the resulting data rows by the “max_cpu” column in descending order. This means the row with the highest “max_cpu” value will be at the top.
limit 10: This limits the output to the top 10 rows after sorting.
In summary, the query:
- Groups data from all metric indices using an index pattern
- Aggregates the data to find the maximum CPU usage percentage and maximum memory usage for each distinct Kubernetes pod
- Sorts the aggregated data by the maximum CPU usage in descending order
- Outputs only the top 10 rows with the highest CPU usage
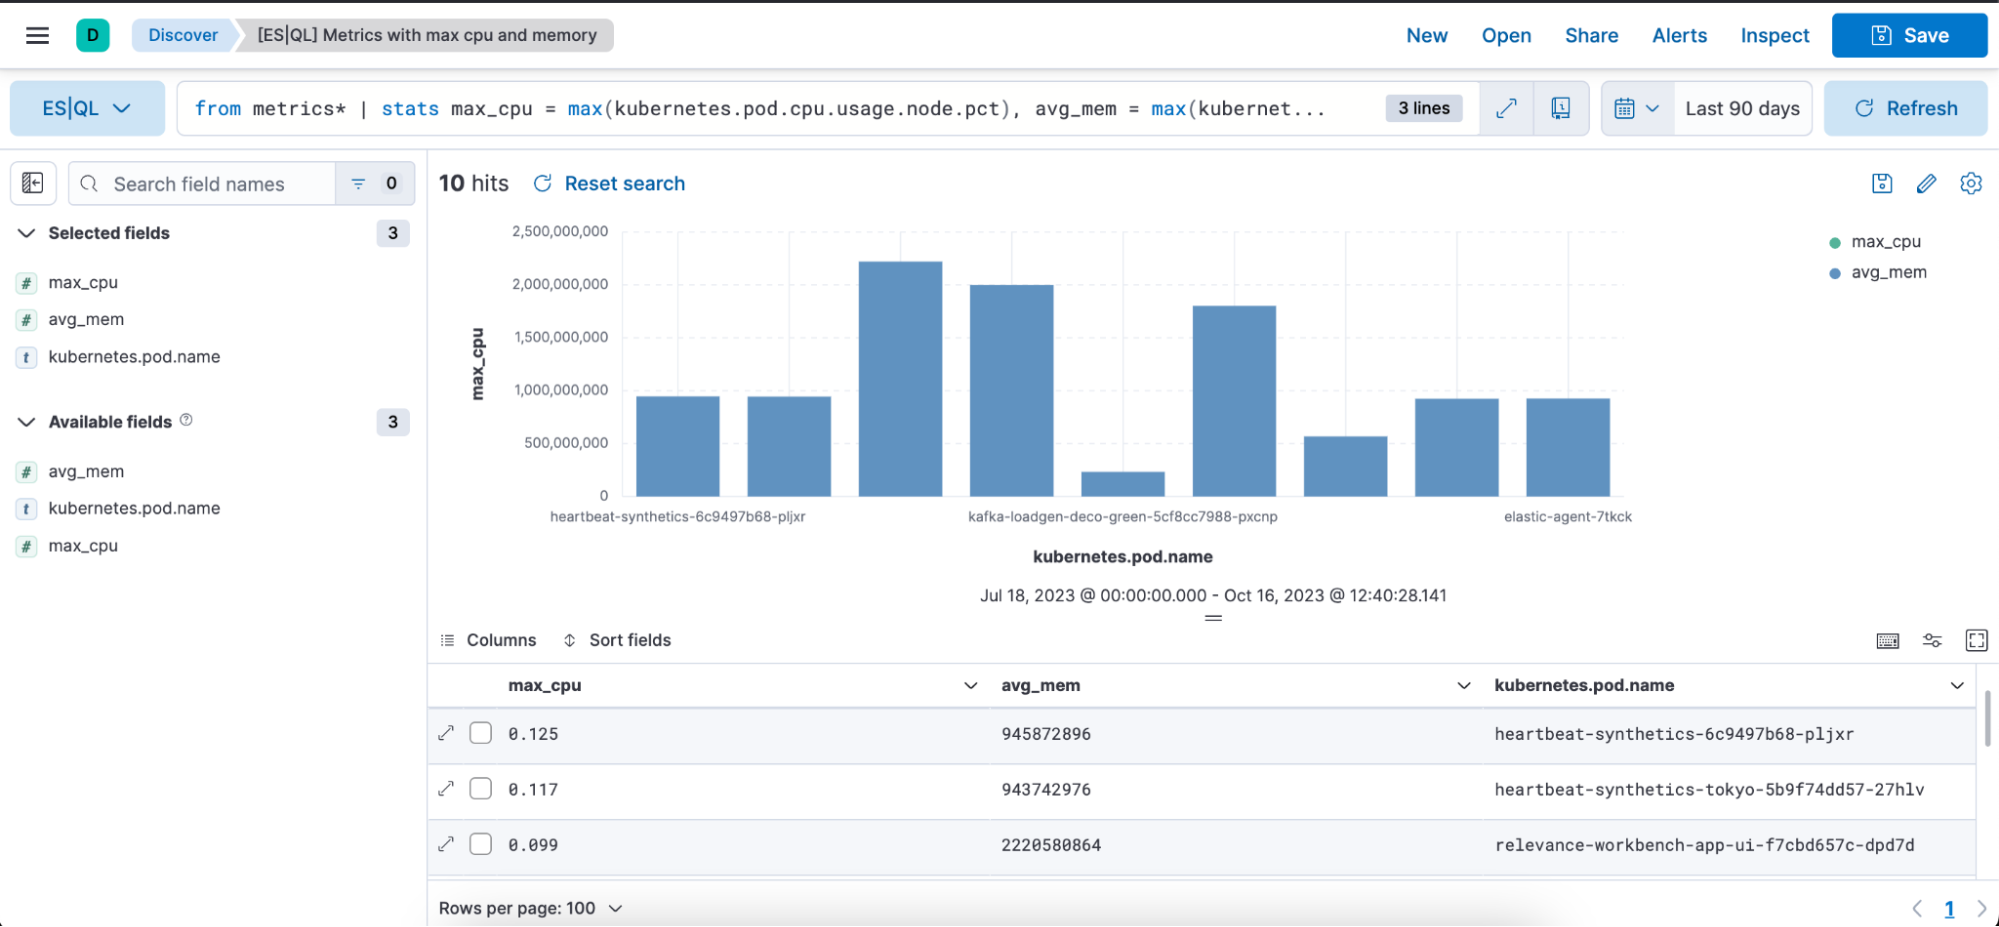
Contextual visualizations: When writing ES|QL queries in Discover, you’ll receive visual representations powered by the Lens suggestion engine. Your query’s nature determines the type of visualization you get, whether it’s a Metric, Histogram Heatmap, etc.
Below is a visual representation in the form of a bar chart and a table representation of the above query with columns max_cpu, avg_mem, and kubernetes.pod.name:
Example of an ES|QL query with Observability and time-series data use case:
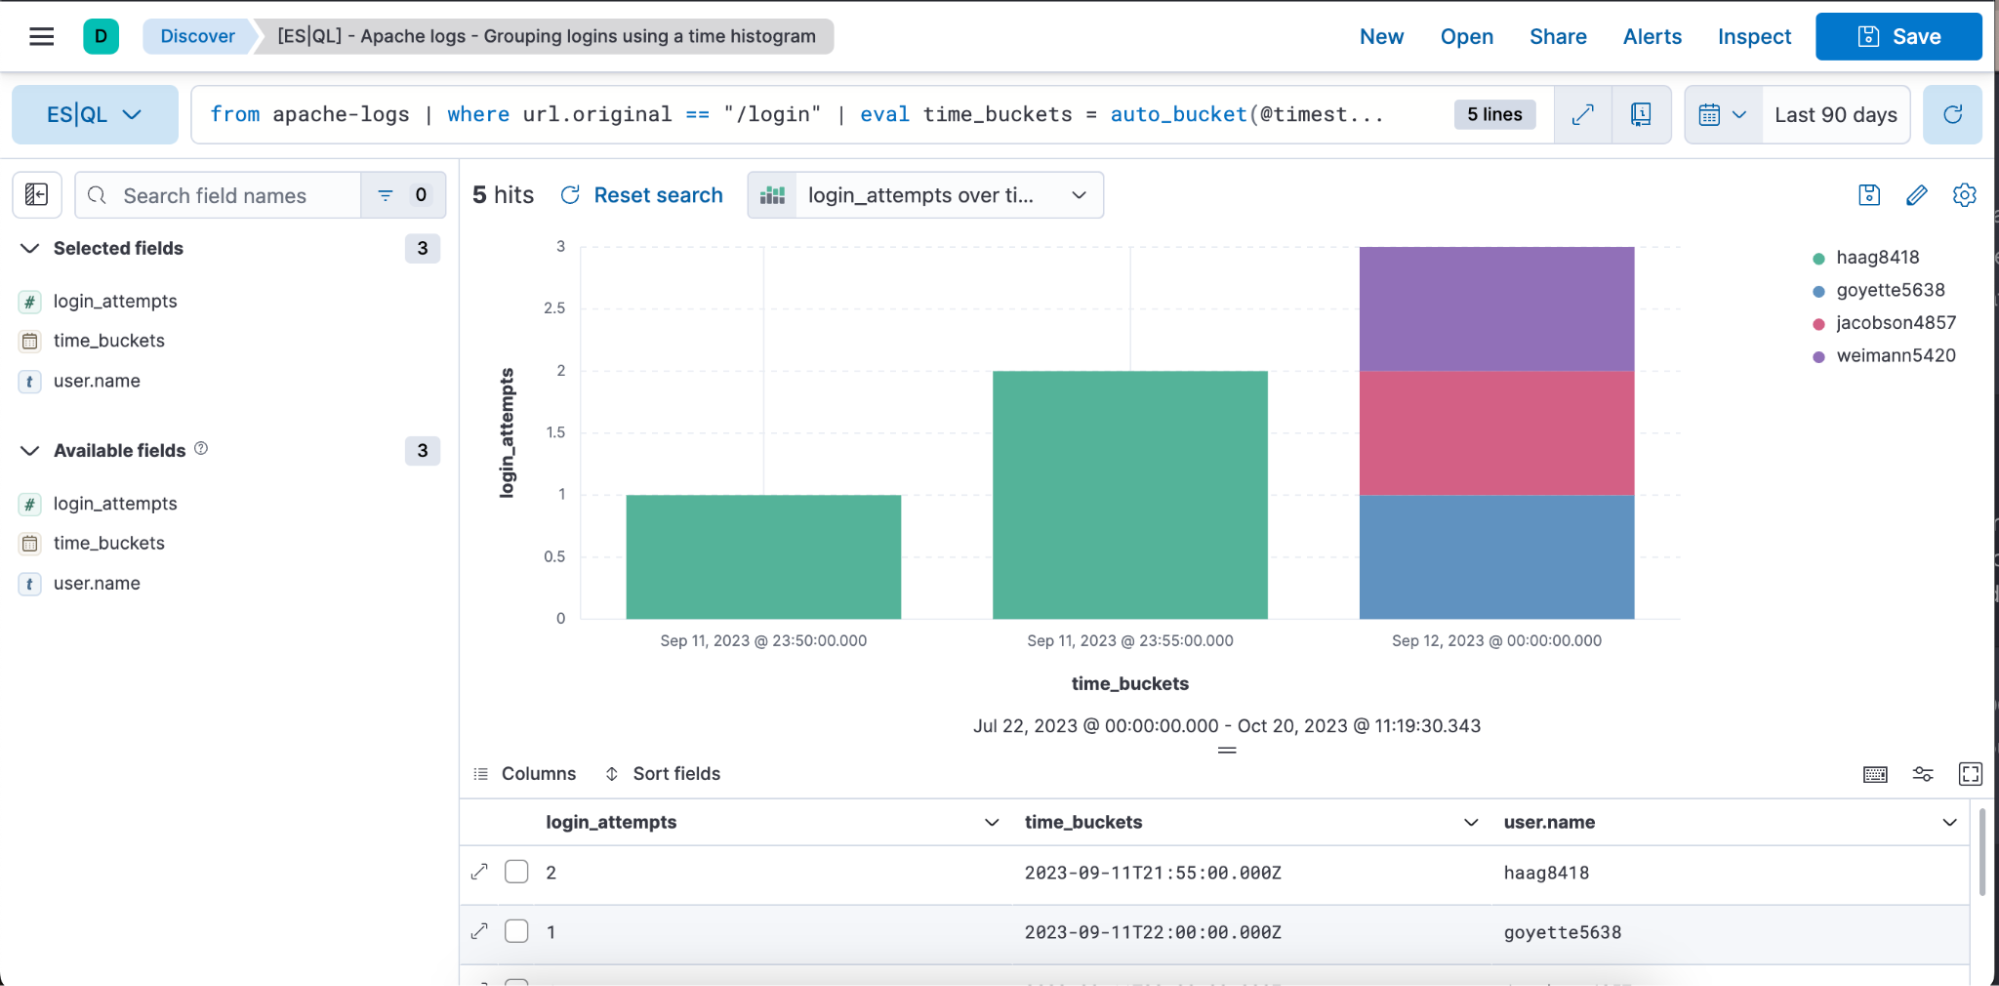
from apache-logs |
where url.original == "/login" |
eval time_buckets = auto_bucket(@timestamp, 50, "2023-09-11T21:54:05.000Z", "2023-09-12T00:40:35.000Z") |
stats login_attempts = count(user.name) by time_buckets, user.name |
sort login_attempts descThe above query is showcasing how you can utilize the following source command, aggregation functions, processing commands, and functions.
from source command (documentation)
from apache-logs: This initiates a query from an index named “apache-logs.” This index contains log entries related to Apache web server traffic.
where (documentation)
where url.original==”/login”: Filters the records to only those where the “url.original” field equals “/login.” This means we are only interested in log entries pertaining to login attempts or accesses to the login page.
eval (documentation) & auto_bucket (documentation)
eval time_buckets =... : This creates a new column named “time_buckets.”
“auto_bucket” function creates human-friendly buckets and returns a datetime value for each row that corresponds to the resulting bucket the row falls into.
“@timestamp” is the field containing the timestamp of each log entry.
“50” is the number of buckets.
“2023-09-11T21:54:05.000Z”: Start time for bucketing
“2023-09-12T00:40:35.000Z”: End time for bucketing
This means that log entries from “2023-09-11T21:54:05.000Z” to “2023-09-12T00:40:35.000Z” will be divided into 50 equally spaced intervals, and each entry will be associated with a specific interval based on its timestamp.
The goal isn’t to provide exactly the target number of buckets, it’s to pick a range that you are comfortable with that provides at most the target number of buckets. If you ask for more buckets, then auto_bucket can pick a smaller range.
stats…by aggregations (documentation), count (documentation), and by (documentation)
stats login_attempts = count(user.name) by time_buckets, user.name: Aggregates the data to calculate the number of login attempts. It does this by counting the occurrences of “user.name” (representing unique users attempting to log in).
The count is grouped by both the “time_buckets” (the time intervals we created) and “user.name.” This means for each time bucket, we will see how many times each user attempted to log in.
sort (documentation)
Sort login_attempts desc: Finally, the aggregated results are sorted by the “login_attempts” column in descending order. This means the result will show the highest number of login attempts at the top.
In summary, the query:
- Selects data from the “apache-logs” index
- Filters for log entries related to the login page
- Buckets these entries into specific time intervals
- Counts the number of login attempts for each user in each of those time intervals
- Outputs the results sorted by the highest number of login attempts first
Below is a visual representation in the form of a bar chart and a table representation of the above query with columns login_attempts, time_buckets, and user.name.
In-line visualization editing in Discover & Dashboard
Edit ES|QL visualizations directly within Discover and Dashboards. No need to navigate to Lens for quick edits; you can make changes seamlessly.
Below you can see a video of an end-to-end workflow or read the step-by-step guide:
Writing an ES|QL query
Getting contextual visualization based on the nature of the query
In-line edit the visualization
Save it to a Dashboard
Be able to edit the visualization from a Dashboard
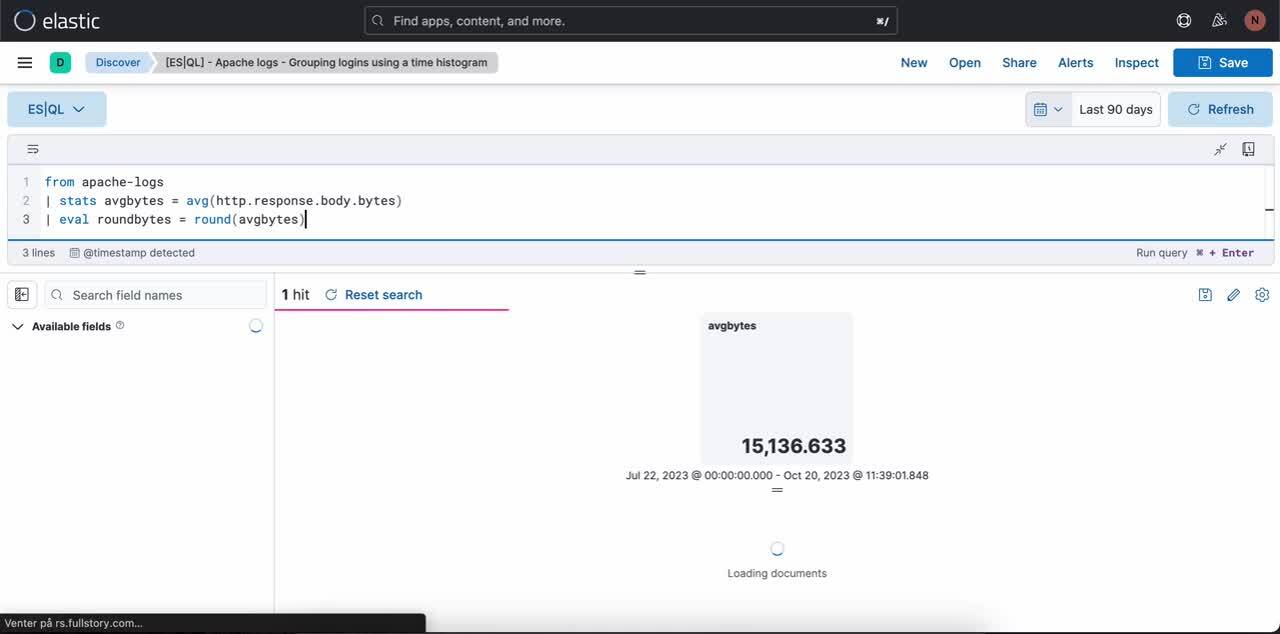
Step 1. Writing an ES|QL query. Query example that produces a metric visualization:
from apache-logs
| stats avgbytes = avg(http.response.body.bytes)
| eval roundbytes = round(avgbytes)
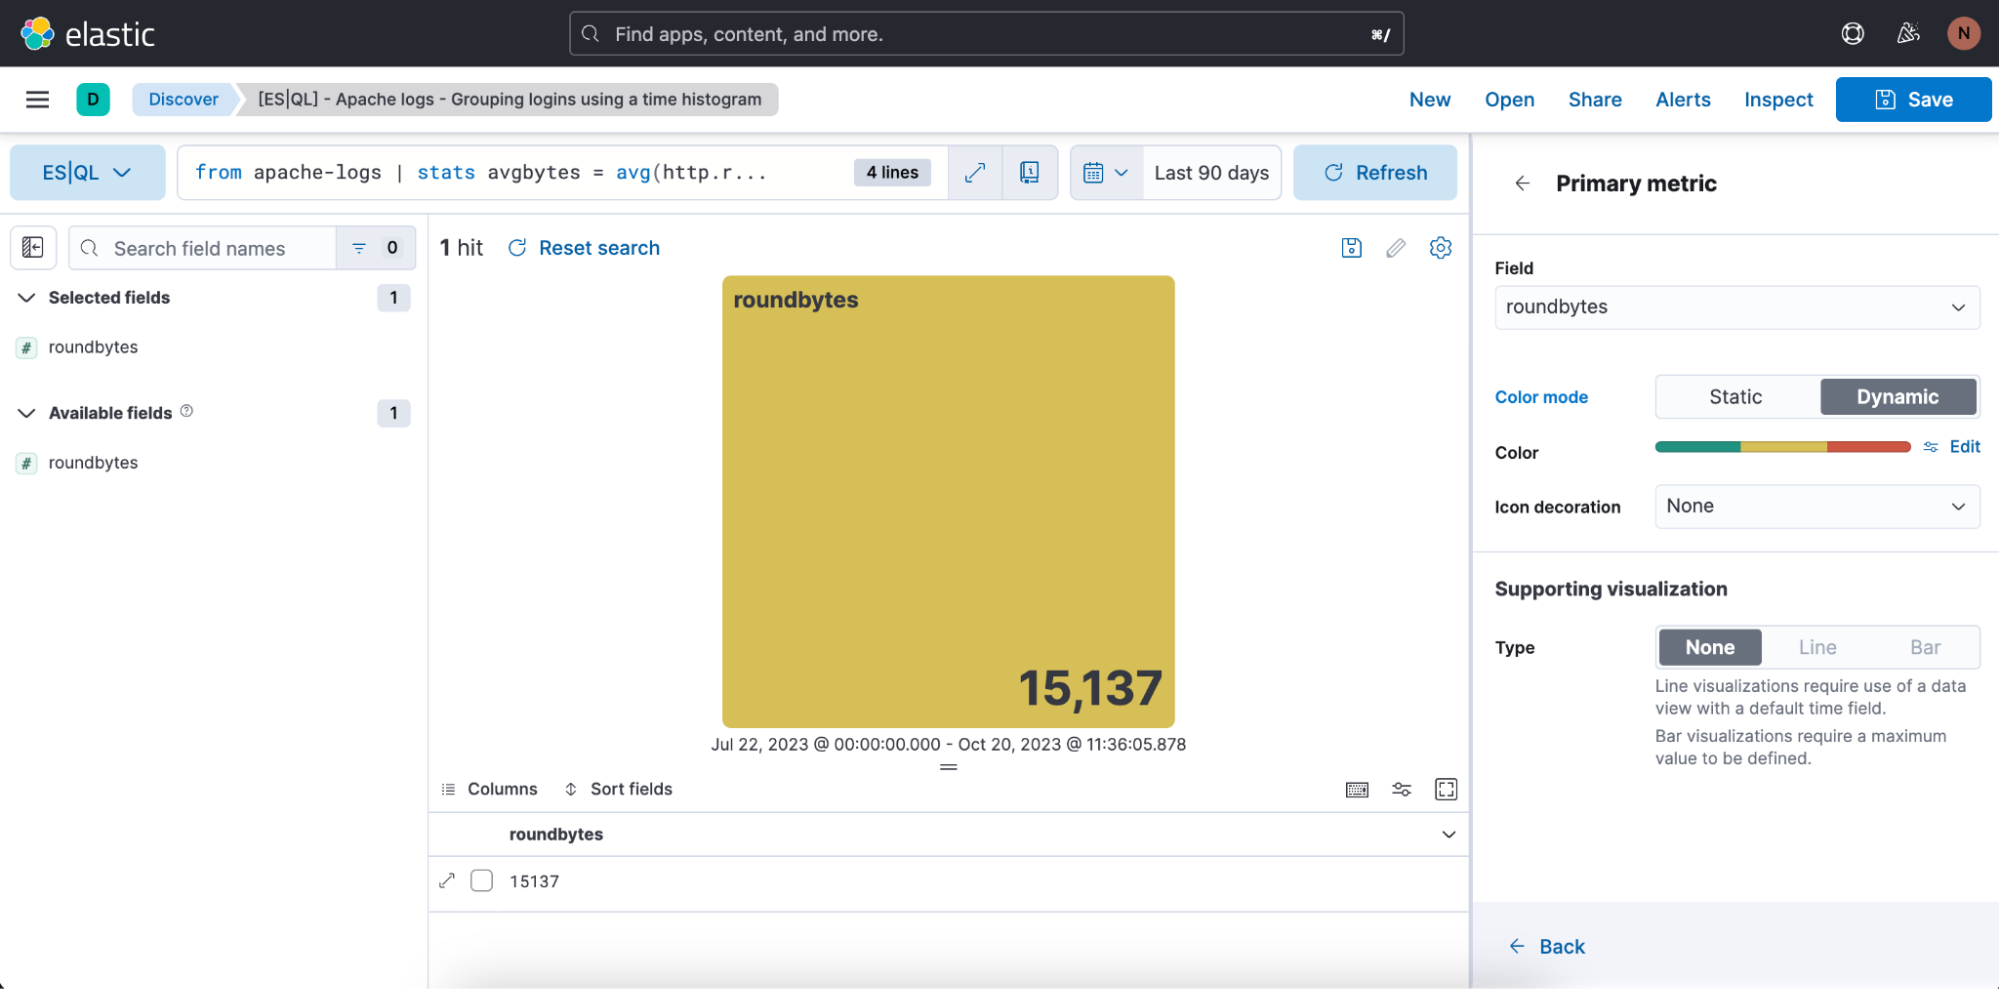
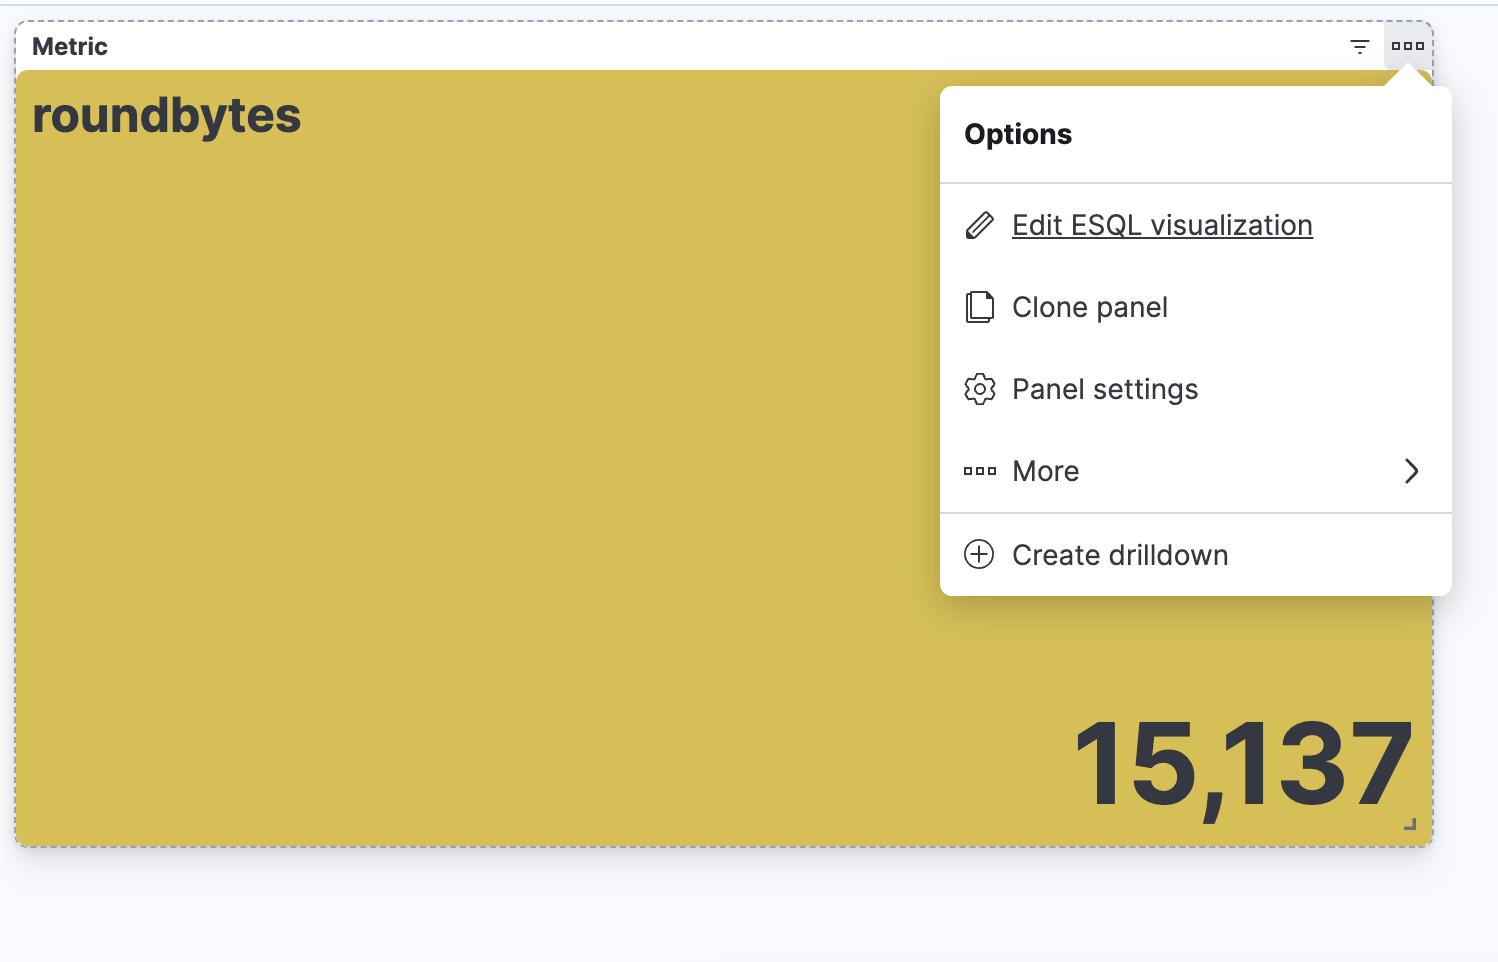
| drop avgbytesStep 2. Getting contextual visualization (in this case a metric visualization) based on the nature of the query. You can then select the pencil icon to go into in-line editing mode.
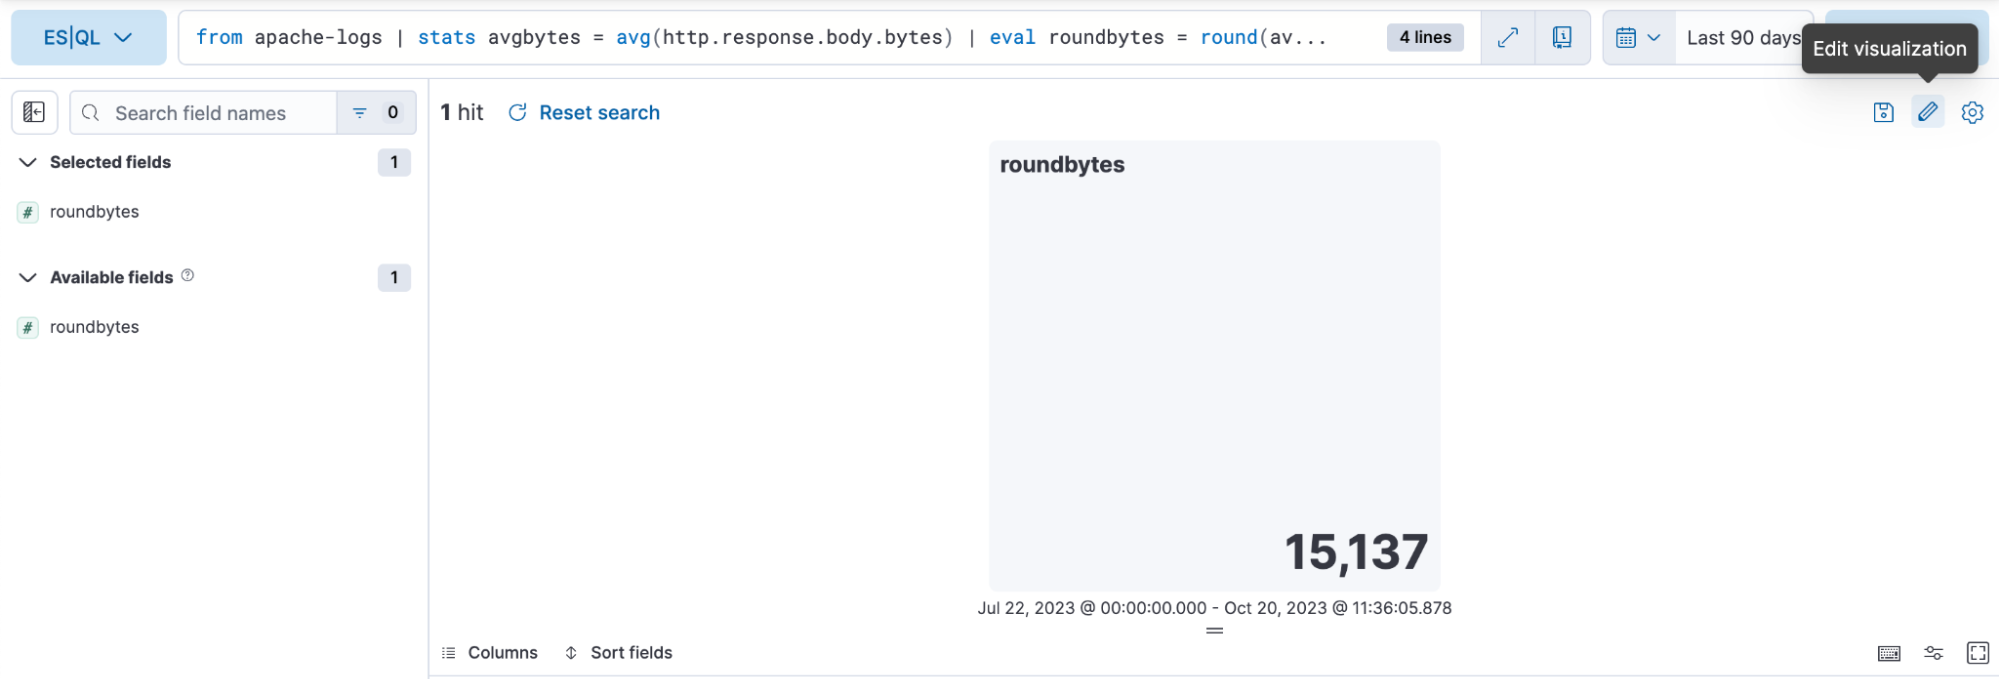
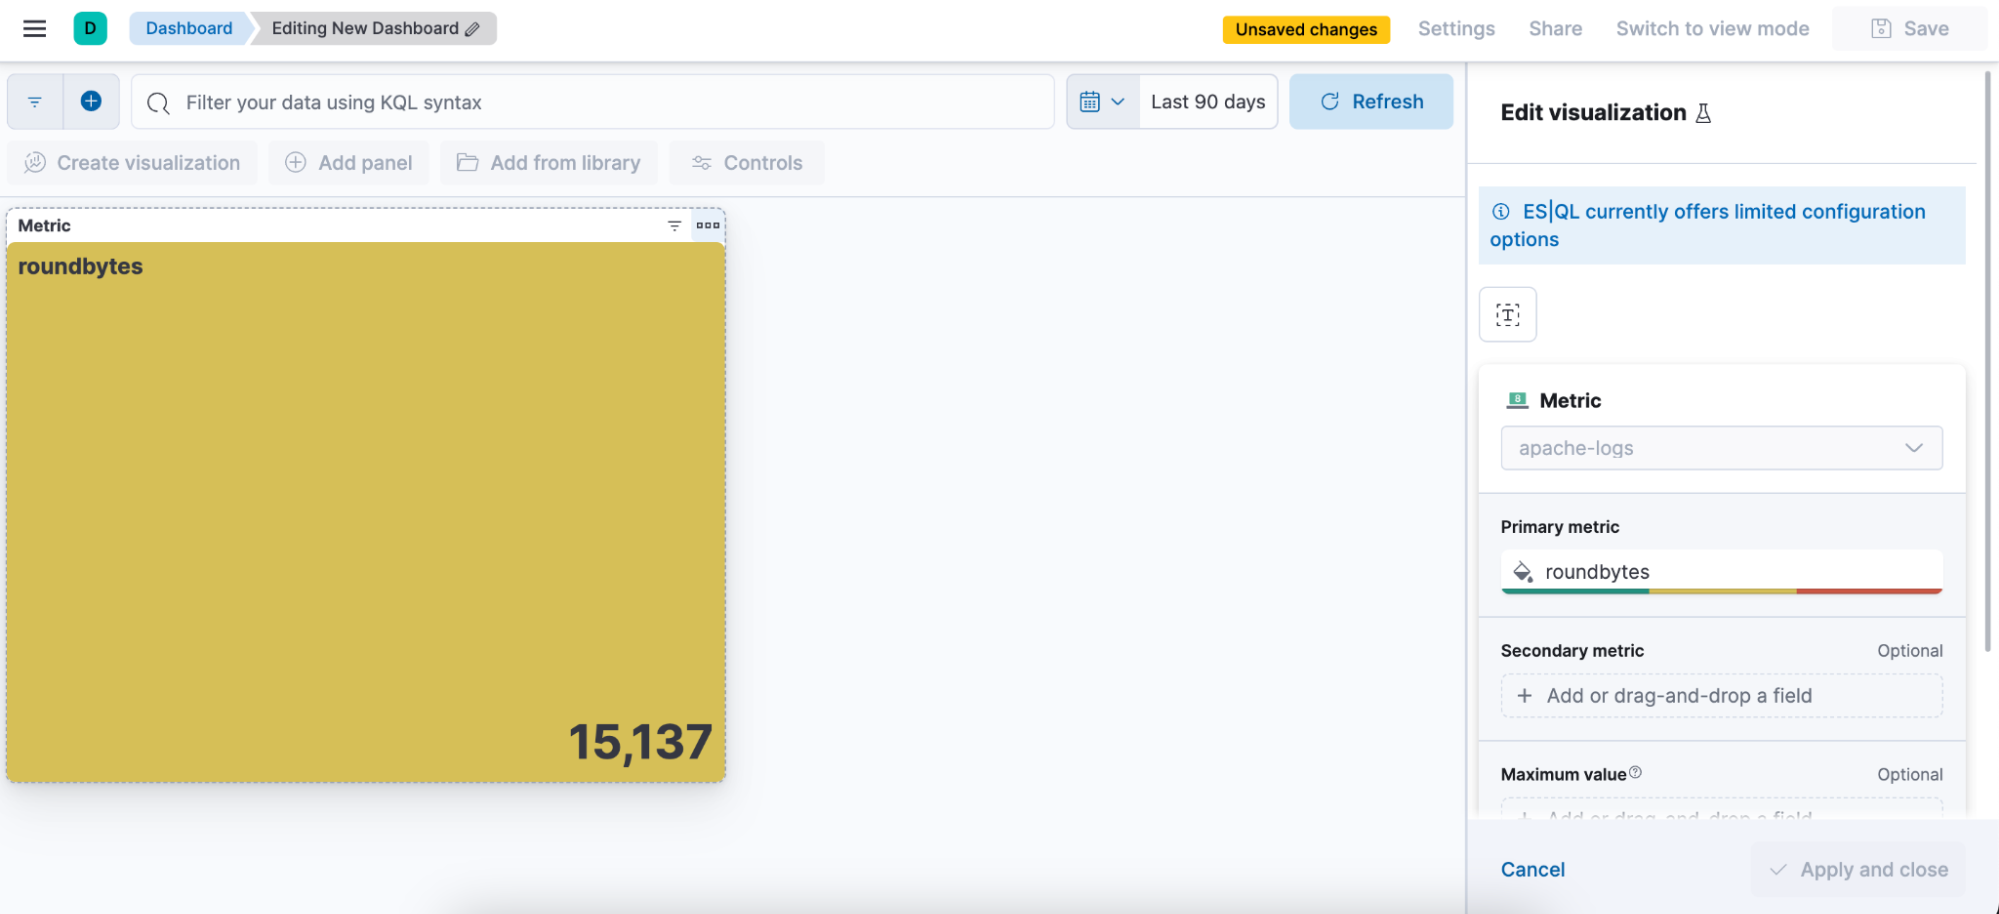
Step 3. Editing the visualization using in-line editing mode
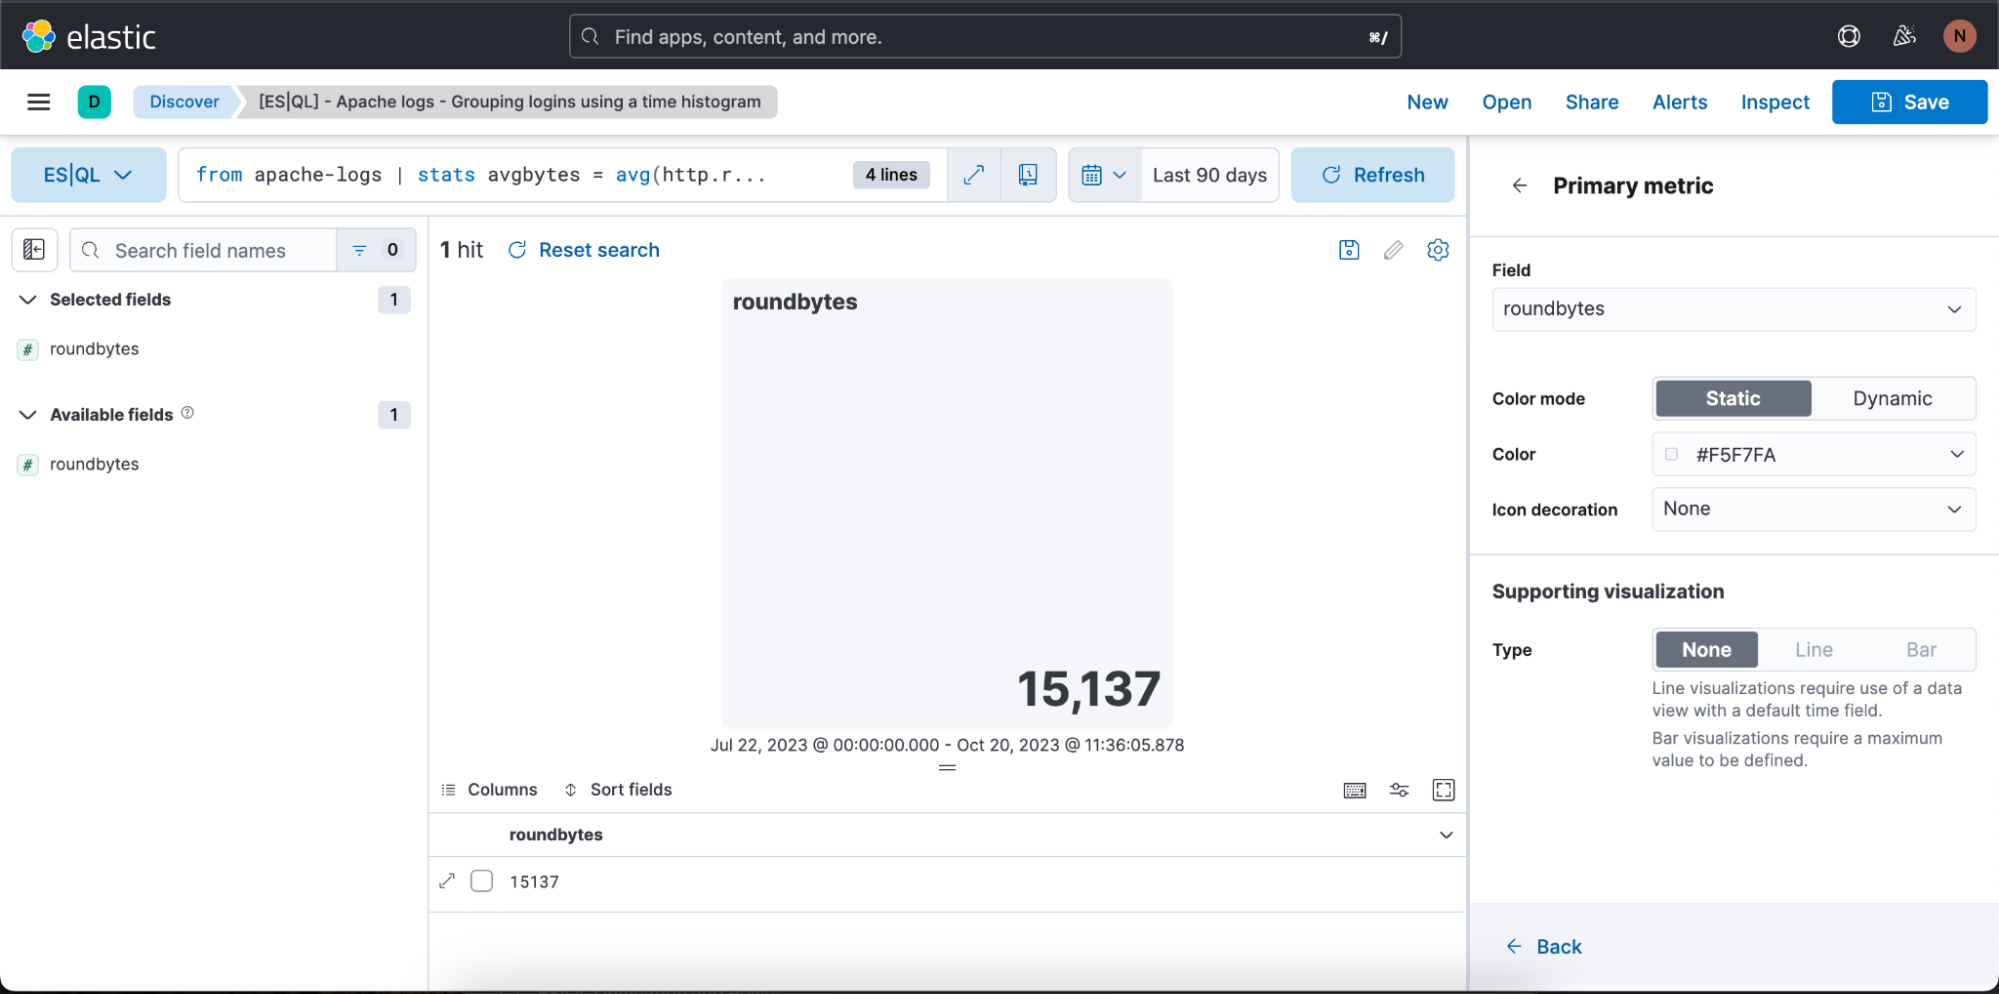
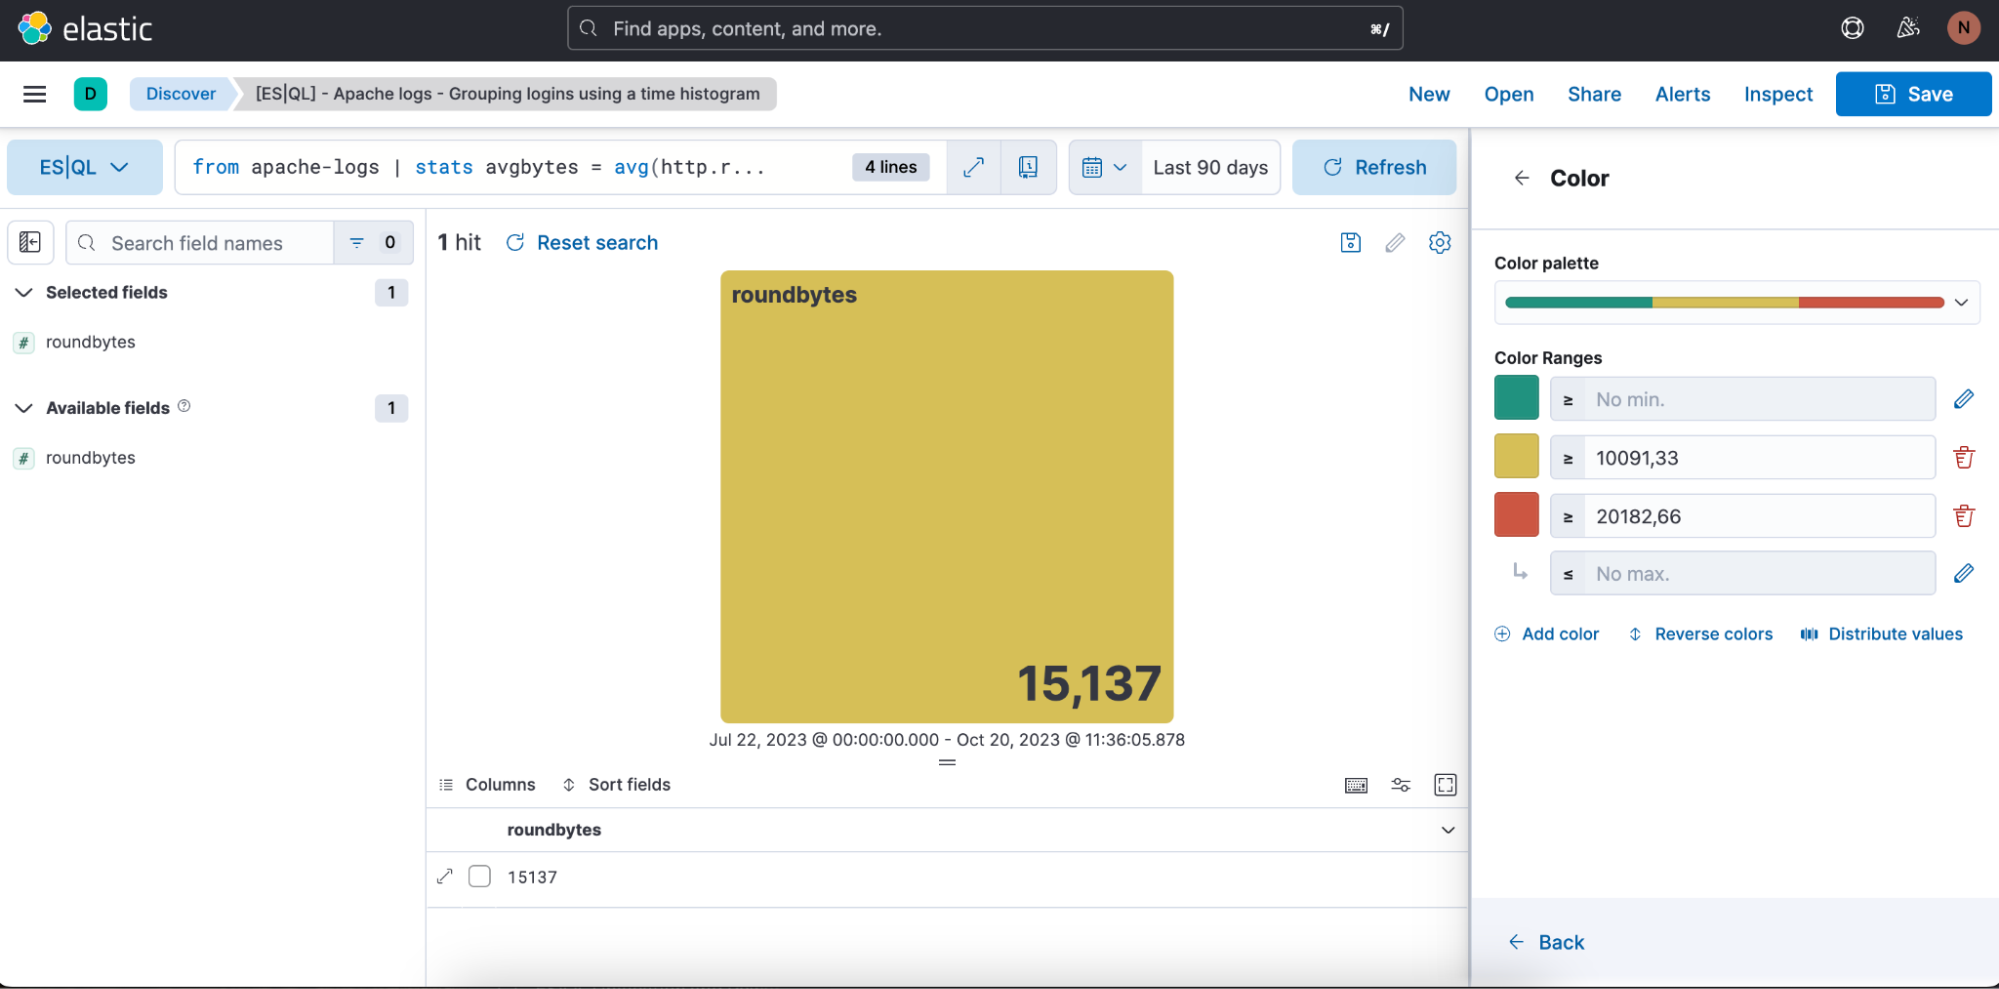
In the above case, we want the visualization to be in dynamic color mode, so we switch it to “Dynamic.”
We also have the opportunity to define the color ranges we want to use:
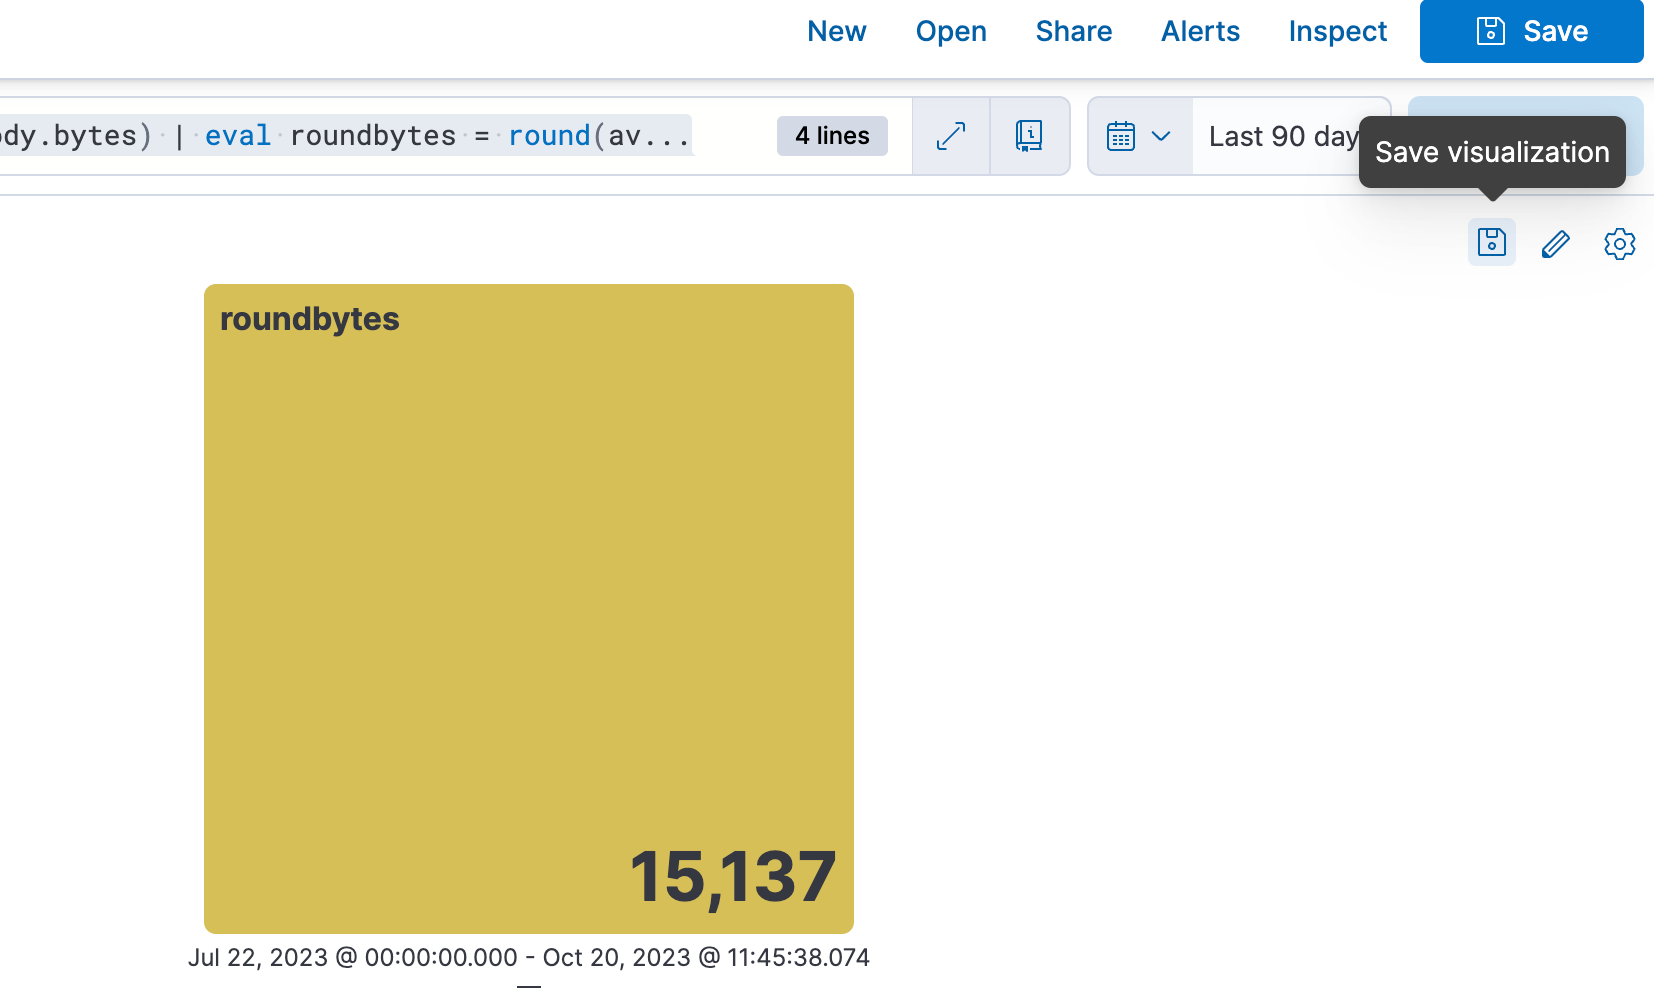
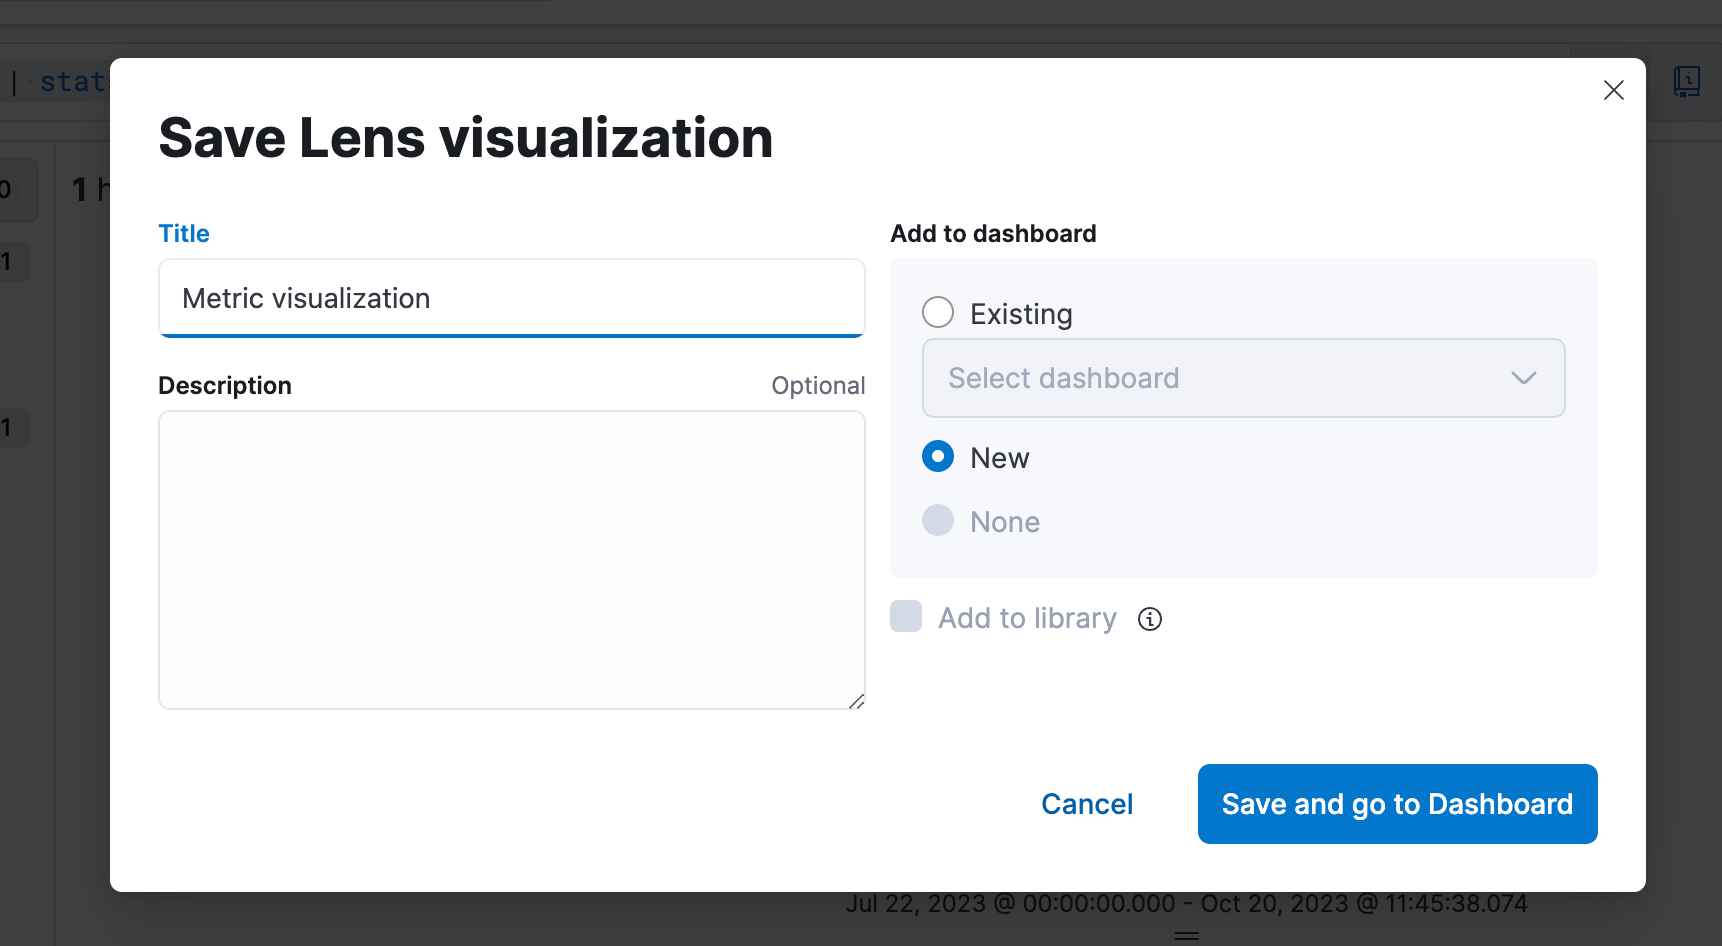
Step 4. Saving to a Dashboard
Step 5. Be able to edit the visualization from a Dashboard
Creating an ES|QL alert directly from Discover
You can utilize ES|QL for observability and security alerts, setting aggregated values as thresholds. Enhance detection accuracy and receive actionable notifications by emphasizing meaningful trends over isolated incidents, reducing false positives.
Below, we will focus on how to create an ES|QL alert rule type from Discover.
The new alert rule type is available under the existing Elasticsearch rule type. This rule type brings all the new functionalities that are available within ES|QL and unlocks new alerting use cases.
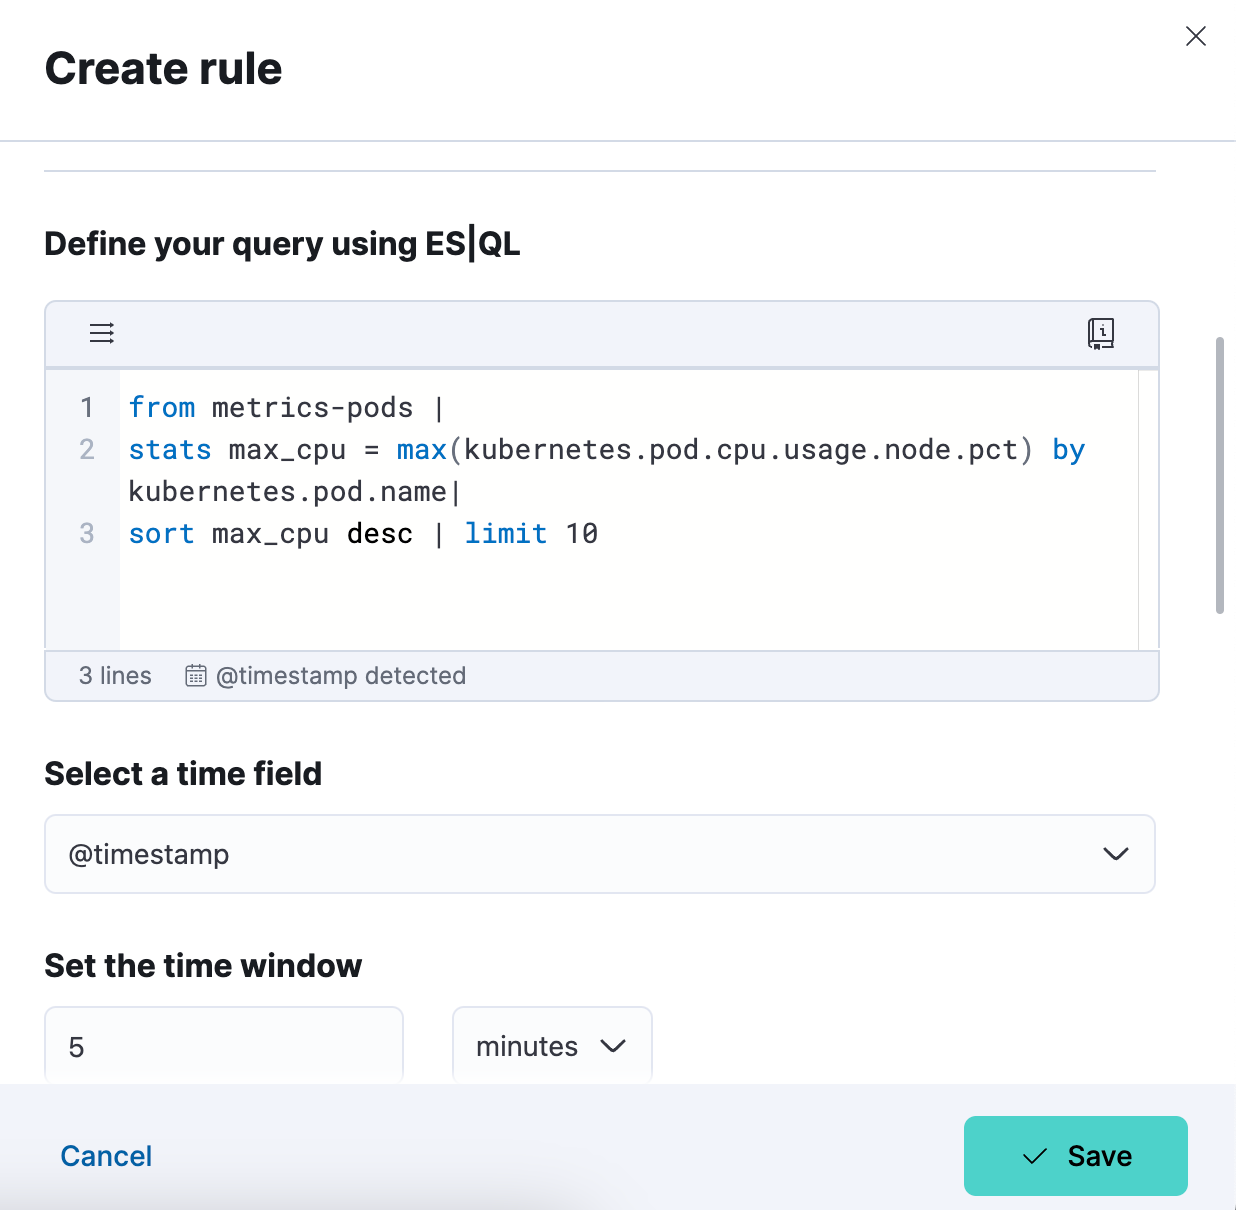
With the new type, users will be able to generate a single alert based on a defined ES|QL query and preview the query result before saving the rule. When the query returns an empty result, no alerts will be generated.
Query example for an alert:
from metrics-pods |
stats max_cpu = max(kubernetes.pod.cpu.usage.node.pct) by kubernetes.pod.name|
sort max_cpu desc | limit 10
How to create an alert from Discover
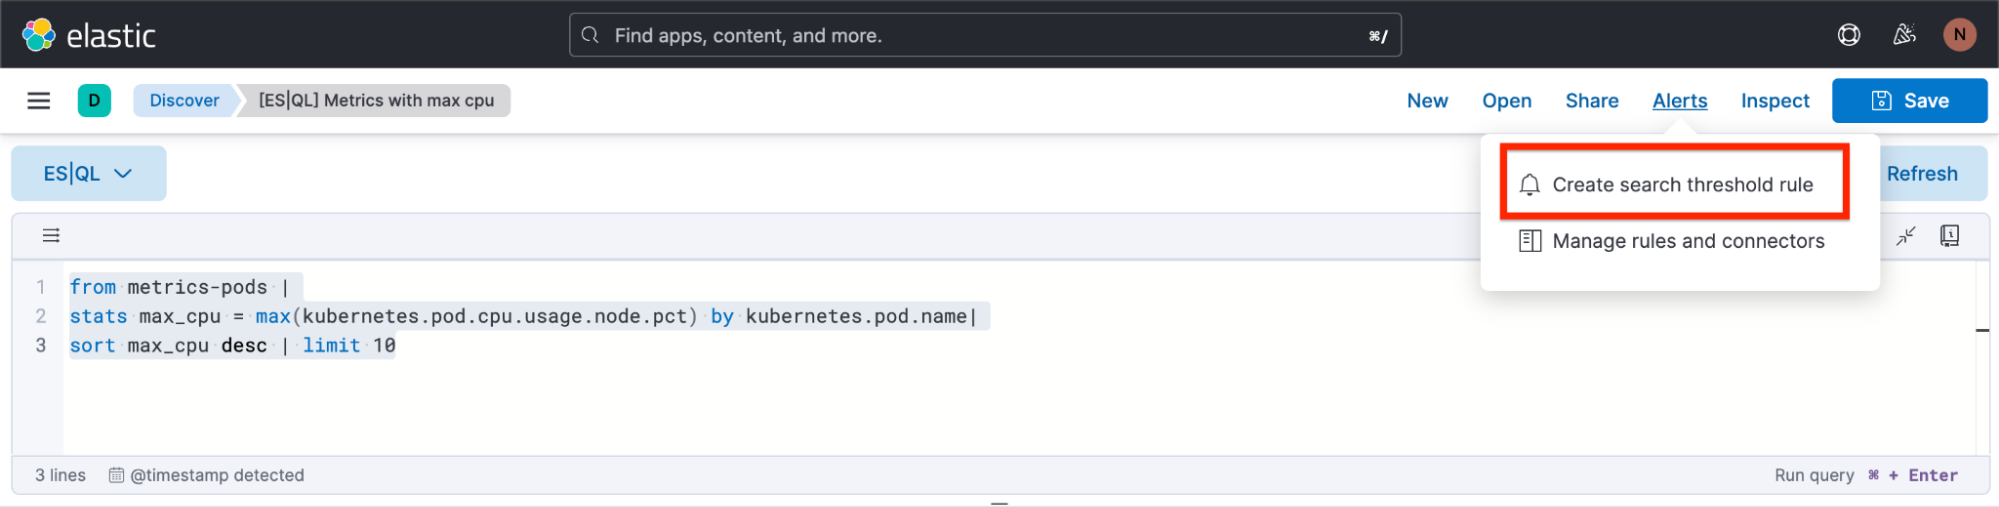
Step 1. Click on “Alerts” and then “Create search threshold rule.” You can start creating your ES|QL alert rule type either after you have defined your ES|QL query in the query bar or before you have defined your ES|QL query. The benefit of doing it after you have defined it is that the query automatically gets pasted into the “Create Alert” flyout.
Step 2. Start defining your ES|QL alert rule type
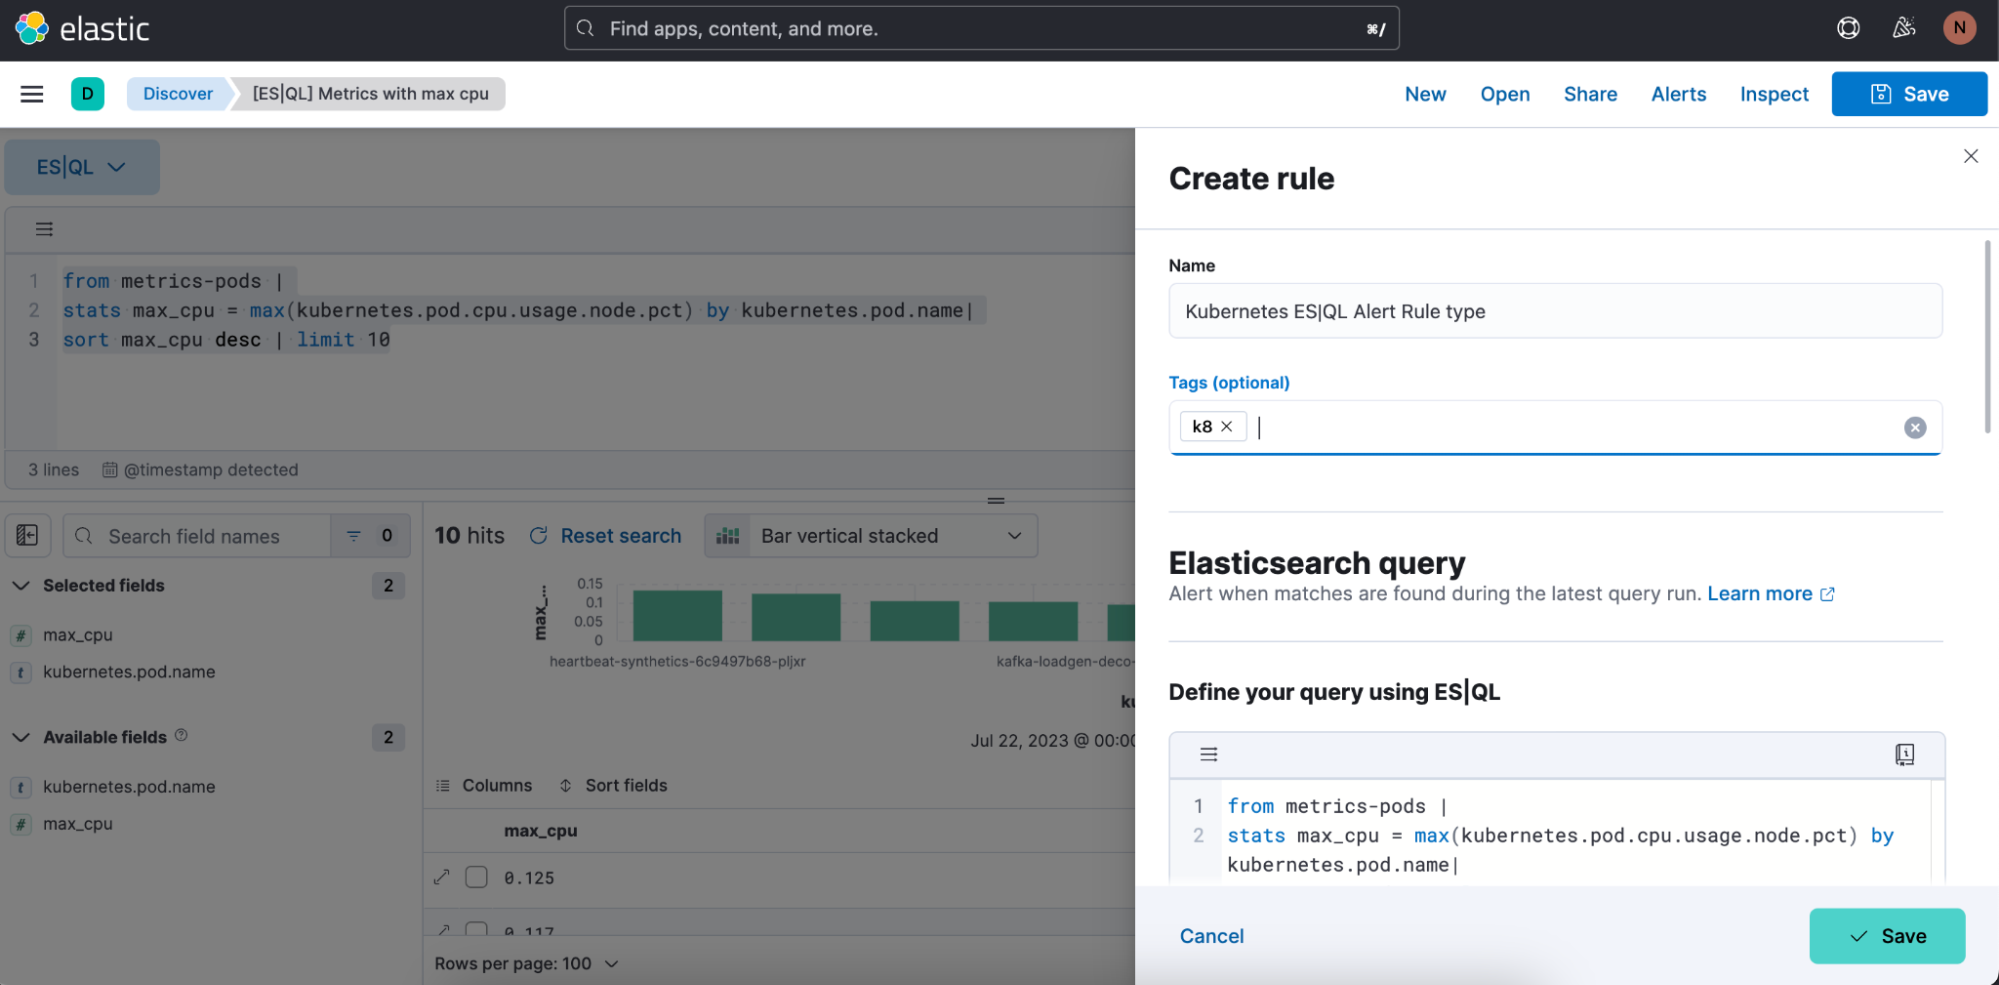
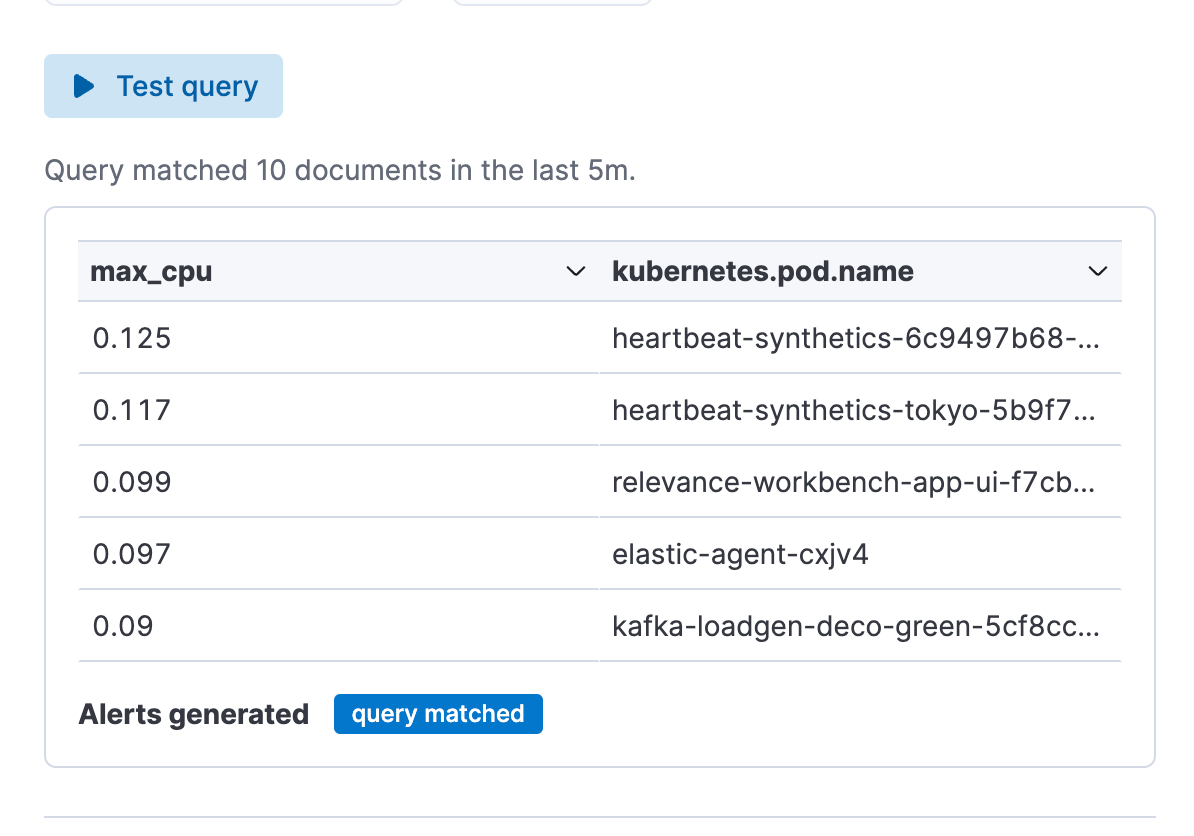
Step 3. Test your alert rule type query. You can iterate on the ES|QL query that is pasted in and test it by clicking on “Test query.” This will give you a preview of the results in a table.
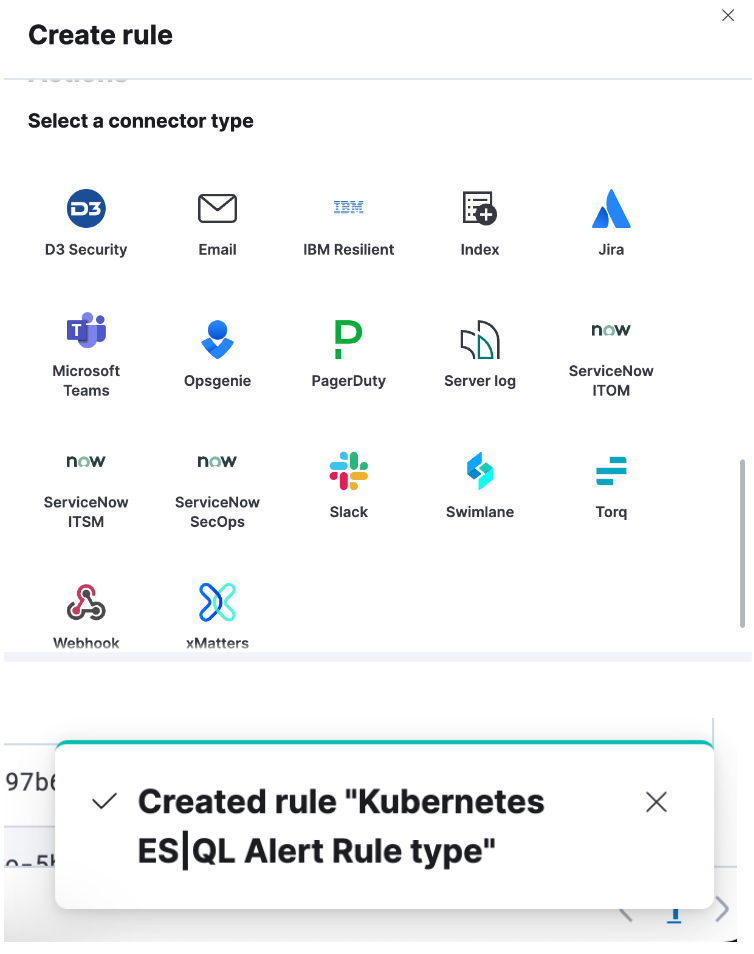
Step 4. Set up your connector and “Save.” You have now successfully created an ES|QL alert rule type!
Enrich your query data set with fields from another data set
You can use the enrich command (documentation) to enhance your query data set with fields from another data set, complete with in-context suggestions for the selected policy (i.e., hinting the matching field and enriched columns).
Query example using ENRICH, where a enrich policy :”servers-to-project” is being utilized via the query to enrich the data set with name, server_hostname, and cost:
from projects* | limit 10 |
enrich servers-to-project on project_id with name, server_hostname, cost |
stats num_of_servers = count(server_hostname), total_cost = sum(cost) by project_id |
sort total_cost desc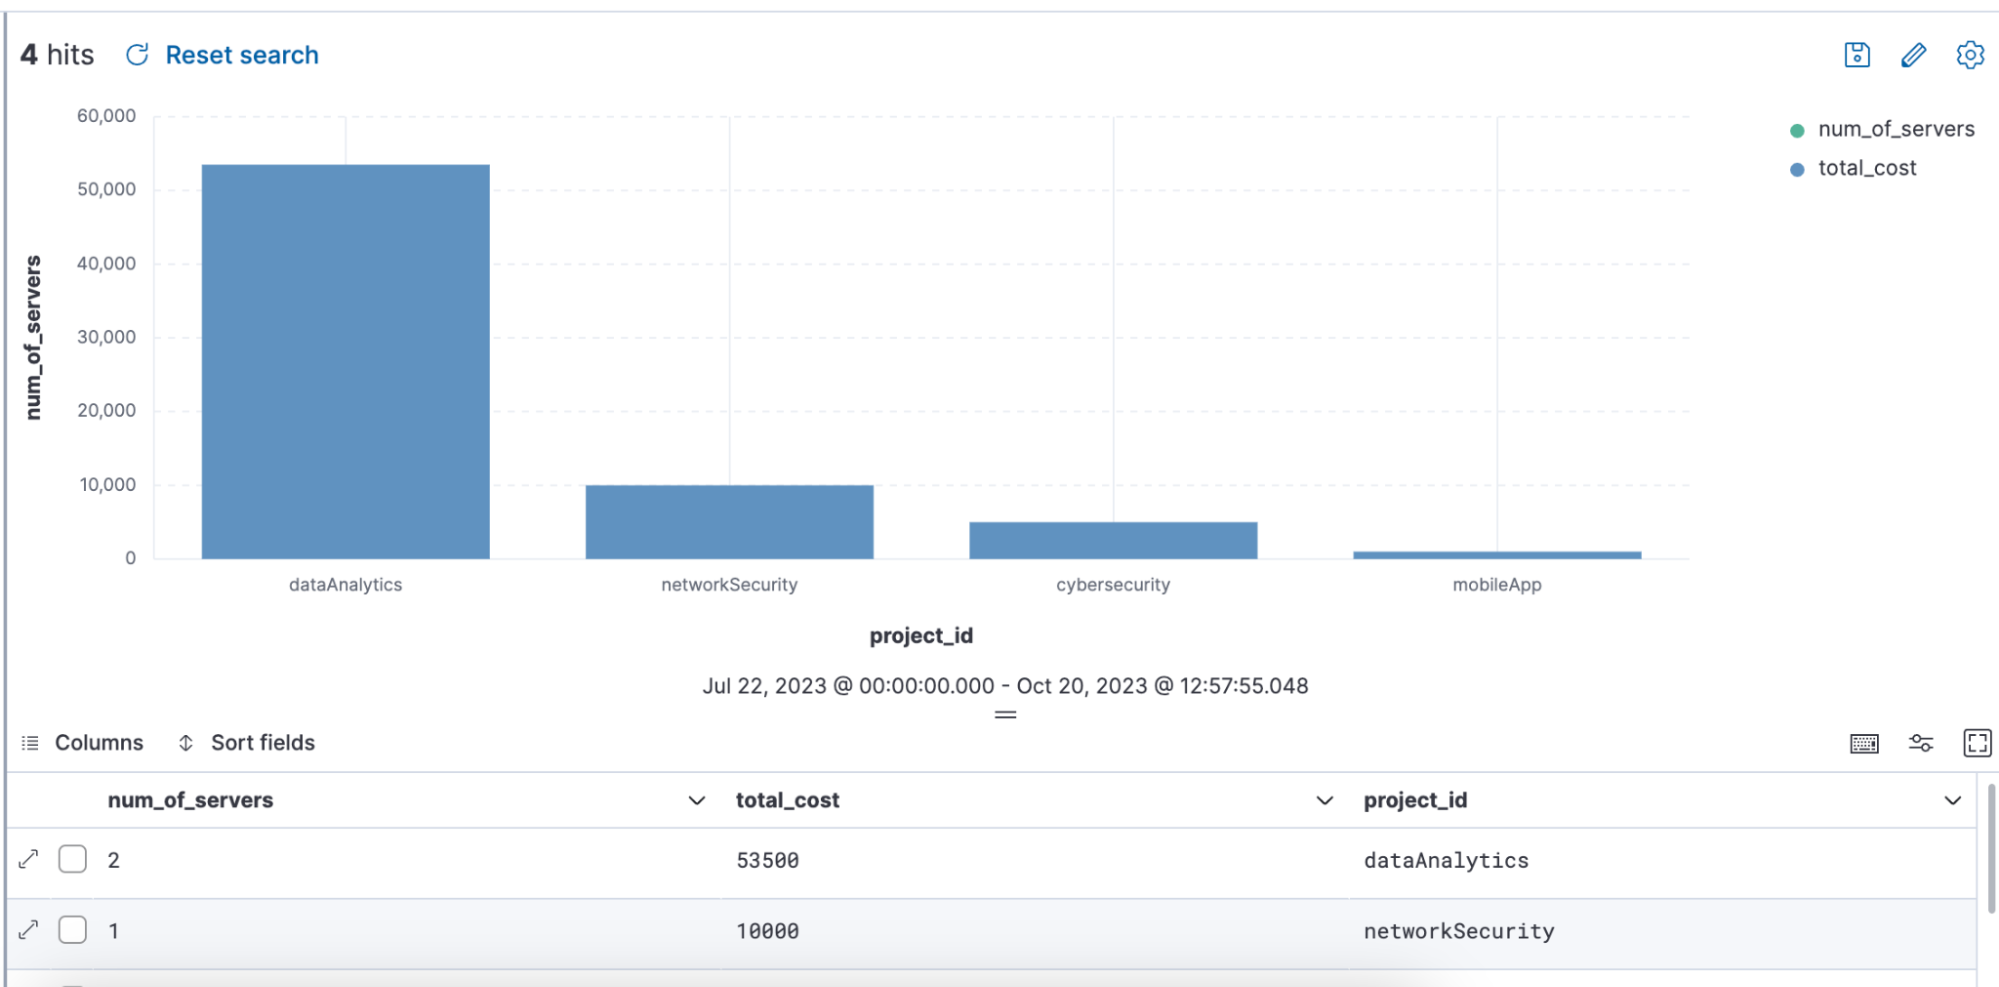
We have also made it easy for users to create enrich policies by adding an overview and a wizard to create enrich policies.
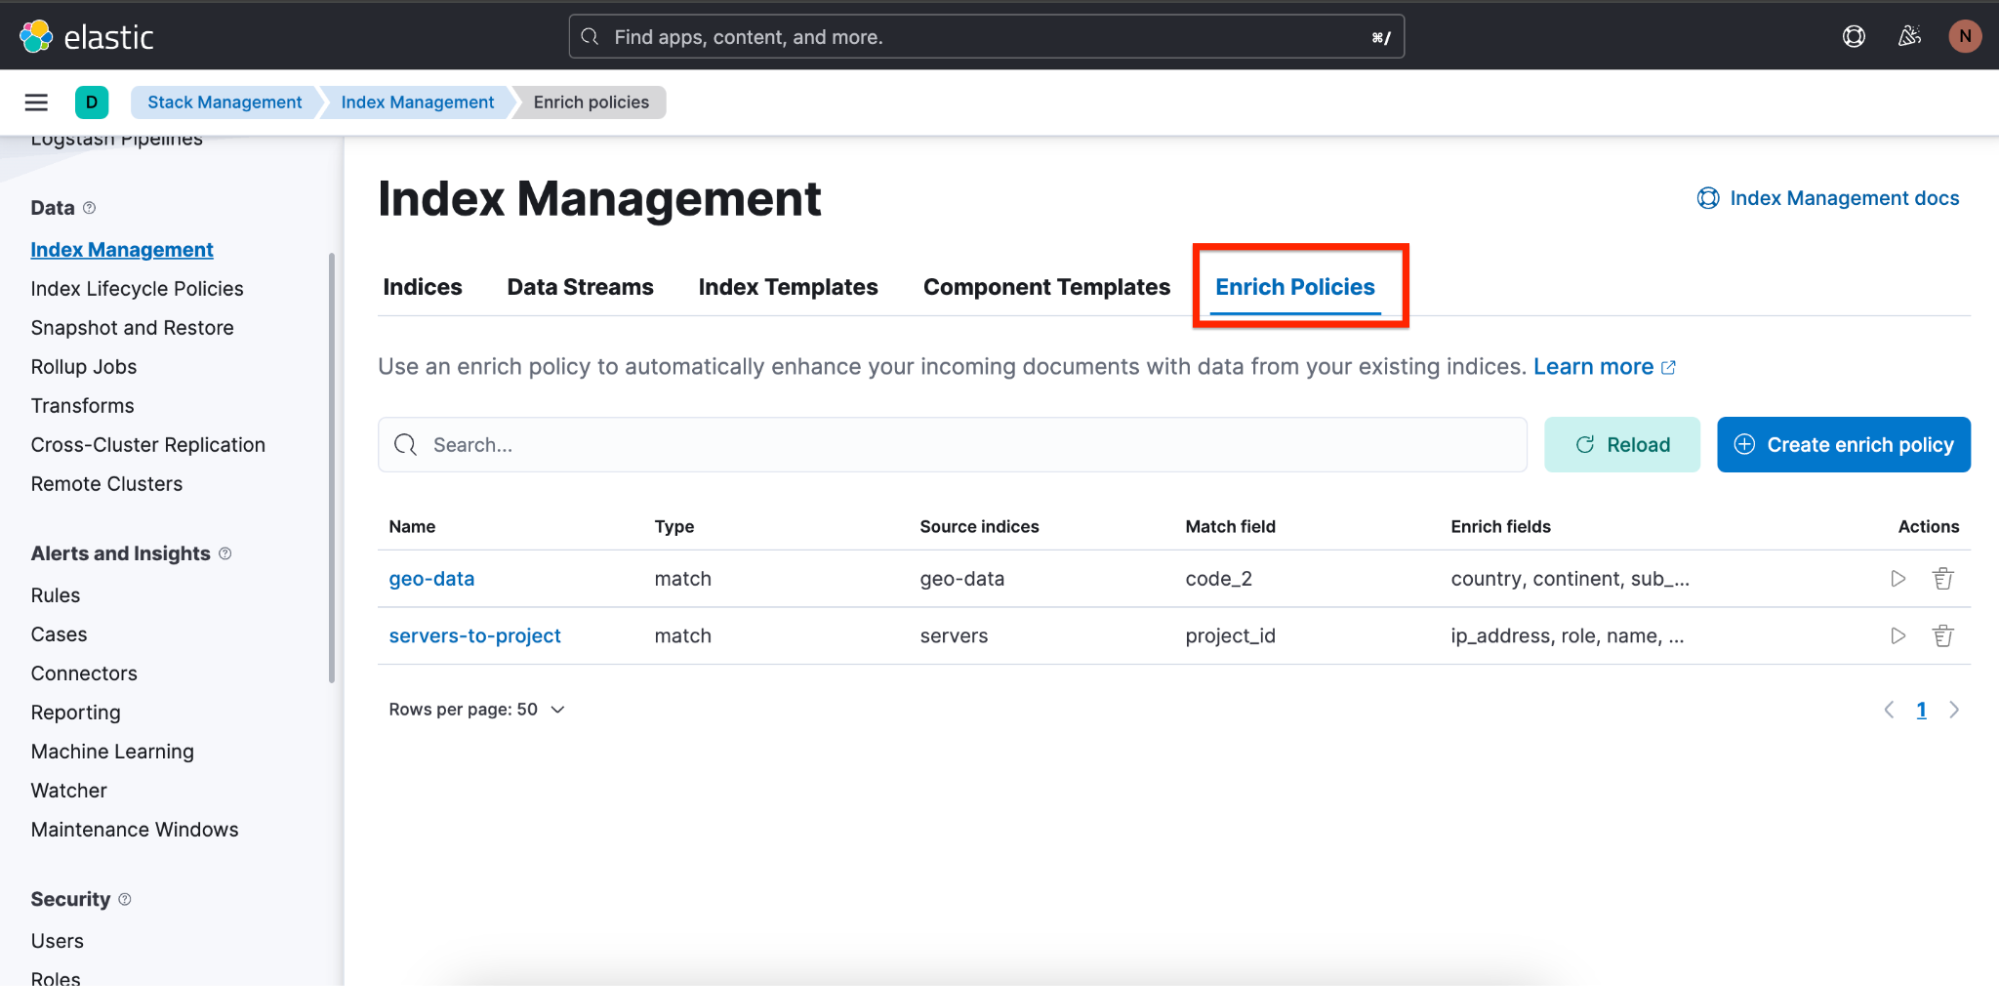
To find an overview of enrich policies, navigate to Stack Management ⇒ Index Management, and there you will see a tab called Enrich Policies:
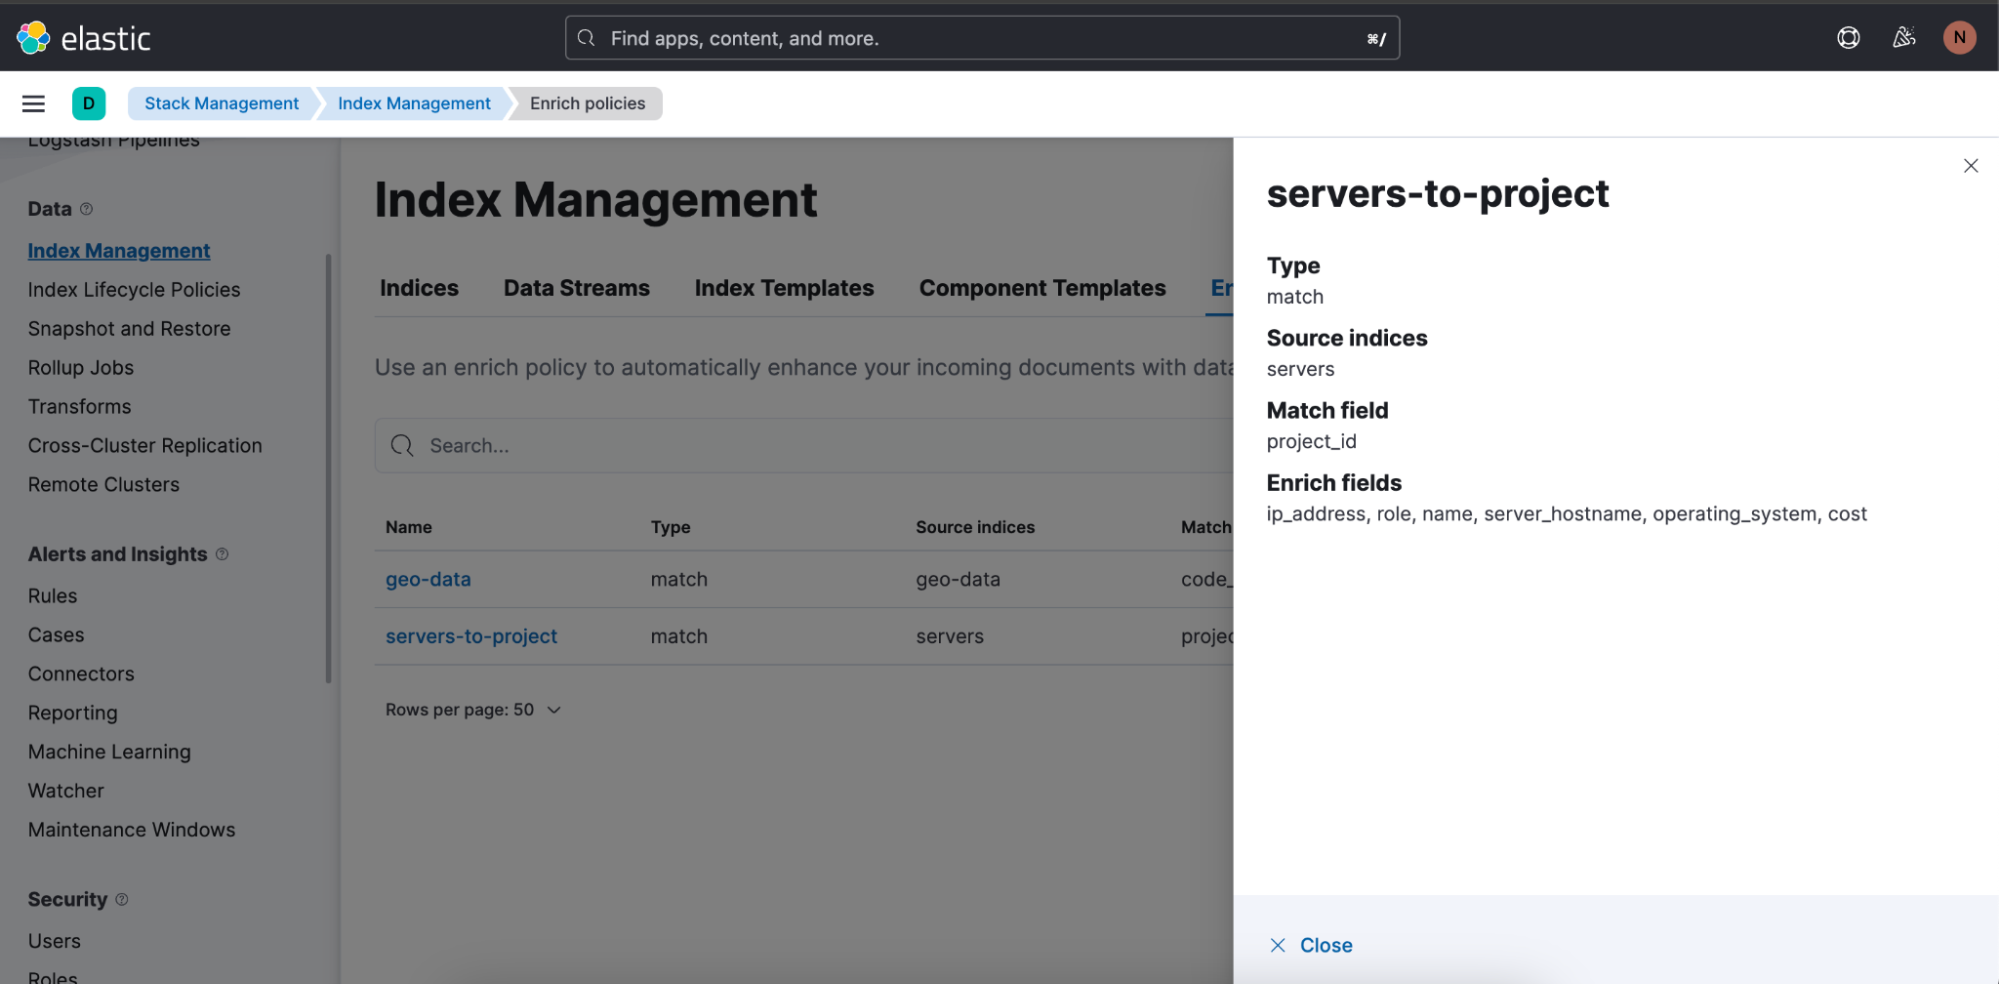
Here is the enrich policy used in above query: “servers-to-project”:
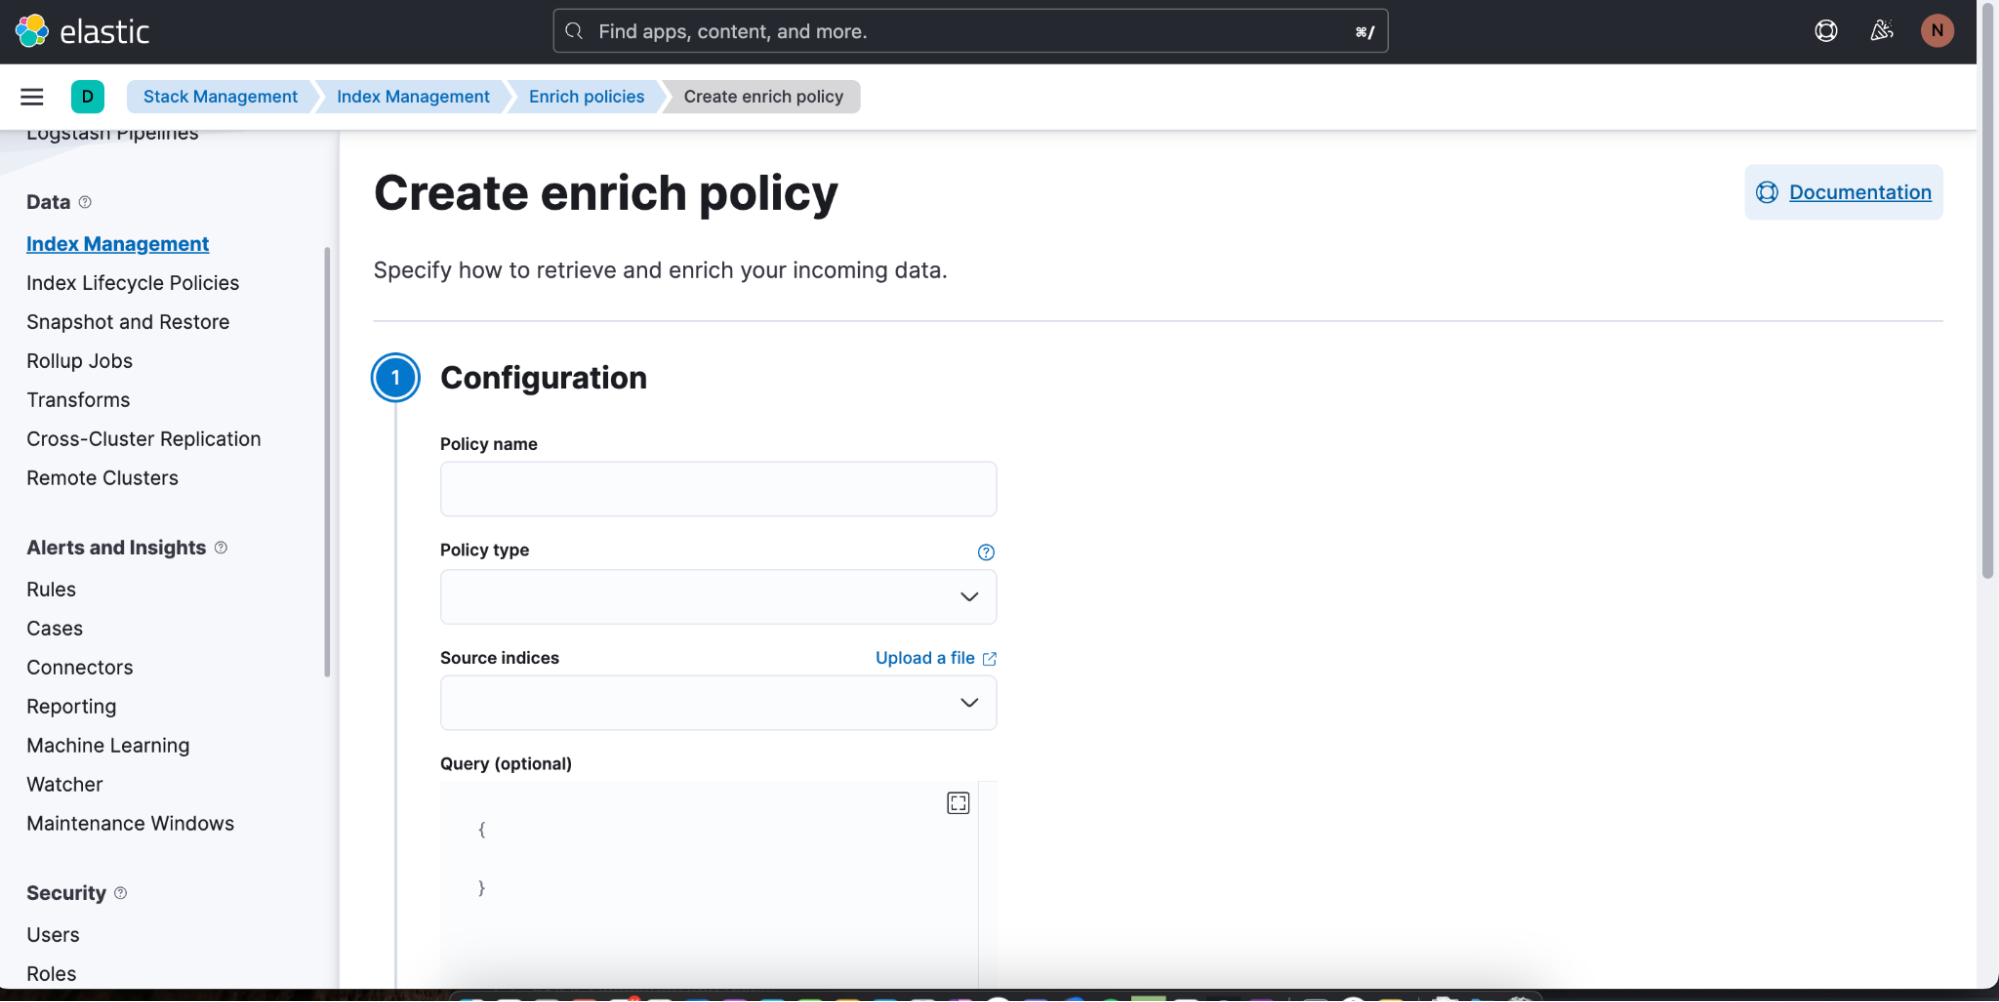
You can easily start creating a new enrich policy by clicking on Create enrich policy. As soon as you have created and executed one, it can then be used in an ES|QL query in Discover.
Elevating data exploration: The power and promise of ES|QL
ES|QL is Elastic’s latest innovation to advance data analysis and exploration. It’s not just about showing data; it’s about making it understandable, actionable, and visually appealing. Powered by a fast, distributed, and dedicated query engine, designed as a new piped language and wrapped in a unified data exploration experience, ES|QL meets the challenges of users such as site reliability engineers, DevOps, threat hunters, and other types of analysts.
ES|QL empowered SREs to tackle system inefficiencies effectively, aids DevOps in ensuring quality deployments, and provides threat hunters with tools to quickly discern potential security threats. Its direct integration into Dashboards, in-line visualization editing, alert functionalities, and abilities like enrich commands provide a seamless and efficient workflow. The ES|QL interface combines both power and user-friendliness, allowing users to dive deep into their data, making their analysis simpler and more insightful. The launch of ES|QL is just a continuation of Elastic’s journey around enhancing data exploration experiences and addressing the evolving needs of our user community.
You can try all of the capabilities of ES|QL today! To do so, sign up for an Elastic trial account or test it out on our public demo environment.
The release and timing of any features or functionality described in this post remain at Elastic's sole discretion. Any features or functionality not currently available may not be delivered on time or at all.
Share
- Share on Twitter
Share on Twitter
- Share on LinkedIn
Share on LinkedIn
- Share on Facebook
Share on Facebook
- Share by Email
Share by Email
- Print this page
Print