What is Application Performance Monitoring?
Application performance monitoring meaning
APM, application performance monitoring, is the process for organizations to quickly identify and resolve any performance issues in their application and code.
APM solutions collect, monitor, and analyze telemetry data from websites, software applications, and services. Teams get end-to-end visibility across their applications so they can understand application and service dependencies and address any errors or slowdowns. APM solutions also store and utilize historical data to surface trends and detect outliers for key performance indicators, such as latency and throughput, as well as business KPIs.
What does application performance monitoring do?
Application performance monitoring provides continuous and detailed insight into how applications are performing. Teams can leverage these insights to be more proactive, rather than waiting for customer complaints. APM has several uses. For example, teams can set up alerts for degradations in user experience, gauge the impact of the latest release, and make informed decisions on where to make improvements. It can also be used to help with root-cause analysis and drive down mean time to detection (MTTD) and mean time to resolution (MTTR).
Why is APM important?
Applications are the lifeblood for modern organizations. They are the gateway to the products, services, and tools people use every day, and they are also becoming increasingly complex. With the rise of distributed applications — cloud-native technologies and microservices — teams simply cannot keep up with the volume of telemetry data streaming in. They need a way to monitor everything in order to deliver exceptional user experiences.
APM ensures that applications perform as expected. To maintain customer confidence, APM tools can alert teams to potential issues so they are resolved fast.
History of APM
Since its founding in the 1990s, APM has given IT teams visibility into applications where previously they were blind. Throughout the years, several companies have experimented with distributed tracing. But it wasn’t until the 2010s that more robust APM solutions entered the market. These platform solutions offer more high-level tracking and end-to-end monitoring capabilities.
APM vs. Observability
On the surface, observability and APM are similar. They both use telemetry to gather data and deliver insights on performance. While APM is more application-focused — tracking and monitoring transactions — observability covers both application and infrastructure performance. Observability enables deep dives into the technical details for improved understanding of systems. It can help teams understand the context and root cause behind a performance issue by correlating across logs, metrics, and traces.
How does application performance monitoring work?
APM uses a set of tools and methodologies to monitor and manage the performance of software applications. APM tools typically include monitoring of key metrics such as response time, throughput, and error rate to identify and diagnose performance bottlenecks and issues.
APM tools can also provide detailed tracing and debugging information to help developers understand and fix issues in the code. This often includes alerting and reporting functionality to keep stakeholders informed of the performance of the application.
APM agents
An agent is a piece of software that is usually instrumented in the application. It monitors and transmits trace and telemetry data to the APM server and/or other monitoring tools. Agents can be used to monitor a wide range of systems and applications. They can be configured to collect data about specific aspects of performance.
APM instrumentation
Instrumentation is the process of adding monitoring code to an application to collect performance data. It can be used to collect metrics for response times, error rates, resource utilization, logs, and other key indicators of an application's health and performance.
Instrumentation can be done manually using a vendor specific APM SDK (software development kit) or with open standards, like OpenTelemetry, where traces are started and stopped using spans.
Alternatively it can be done by using agents that auto instrument the code. After installing the agents, teams can instrument specific parts of an application or transaction for analysis and then send the data to an endpoint — usually an APM platform. Instrumentation is usually set up in a tool’s UI or via an API. Examples of configurations include environment names, sampling rates, and other metrics.
APM analysis and alerting
Once performance data is collected, it can be analyzed. It is important when selecting a tool that it includes dashboards and views that make it easy to track a user’s experience and identify errors and issues at-a-glance. Most teams start investigations around reported issues, and then work to identify the root cause. Having a platform approach to APM avoids tool switching at this stage. Alerts can also be set up moving forward to avoid future issues.
What does APM measure?
APM tools can measure:
- Server health: Monitor server CPU usage, memory demands, and read/write speeds
- Error rates: Track performance degradation and identify issues
- Response time: Determine whether app performance is being impacted
- Instances: Understand how many server or app instances are running to scale efficiently and manage overall costs. This metric is critical for cloud-based applications.
- Request rates: Evaluate user traffic to understand why there are spikes or users are inactive
- Availability: Track uptime for the application
What are the benefits of APM?
When applications stop working, it is better to know ahead of time before creating a negative experience for users. APM allows teams to identify and resolve issues quickly, and even prevent them in the future. With a comprehensive APM tool, teams can:
- Increase stability and uptime
- Reduce incidents
- Resolve issues faster
- Release high-quality software
- Identify infrastructure improvements
- Improve productivity
- Create better user experiences
- Drive revenue
What are the challenges of APM?
APM tools do not come without challenges. Teams are dealing with massive amounts of data streaming in real time. Complex, distributed applications — especially those using cloud-native technologies — can make APM instrumentation a challenge. If there are issues across an environment or complex root cause analysis cases, many tools can struggle.
APM solutions need to monitor end-to-end transactions, applications, and code-level performance to give organizations comprehensive coverage. Having a single platform provides the most comprehensive coverage, and can simplify workflows and speed issue resolution. It is important to choose the right APM solution that can use a combination of monitoring methods to meet business goals.
Key features of APM tools
What should you look for when selecting the right APM tool? While there are several different APM solutions that can monitor end-to-end transactions, applications, and code-level performance, it is important to select one that matches your technical needs now and in the future.
Technical capabilities
Create a checklist for your organization. Then you can compare tool features to your needs. Some examples of APM technical capabilities include:
- Track website and/or application performance
- Map and manage application and service dependencies
- Collect distributed traces for end-to-end visibility
- Provide real-time user monitoring (client and server)
- Connect app performance to business goals
- Leverage machine learning and AI-based analytics
- Support for a variety of data types, data sources, and languages
End-to-end visibility
APM data has the ability to inform organizations about what is actually happening in their application. But you need to be able to monitor everything well to get a clear vision into how it is working.
Because individual traces only show part of this story, your APM tool should go one step further and monitor transactions all the way through their journey. Then, traces can be linked together to go from a bird's-eye view into code-level concerns.
End-to-end visibility is also a critical element for AIOps.
Integrations
Integrations with third-party services and applications is what allows your APM tool to seamlessly fit into your organization’s larger ecosystem. From authentication to CI/CD frameworks, it is important to investigate these integrations up front.
Ease of Use
There are various people within your organization that will need access to APM features. Cater to their needs with an intuitive UI. Also, verify how easy it is to deploy, manage, and scale your APM solution.
Deployment options
If you are looking to reduce operating and administrative costs, you may want to consider a cloud-based SaaS option. But, there are other deployment options to consider. While some APM tools can support multi-cloud or hybrid strategies, others could have limitations based on your preferred cloud provider.
Support for open standards/open data
The observability space is constantly evolving. As new tools and standards enter the market, you need a flexible platform that can adapt. Using open standards and technologies like OpenTelemetry can also help to future-proof your toolset.
Learn more about telemetry data building blocks
Security
When evaluating your tools, consider the vendor’s commitment to security. How the APM tool is built and delivered could either enhance or weaken your existing security framework. Traffic between components should be encrypted. Third-party extensions could also represent a security concern. Also, make sure that your APM tool supports your existing identity access management solution with granular permissions.
Application performance monitoring with Elastic
In 2023, Elastic was named a visionary (for the third consecutive year) in the Gartner® Magic Quadrant™ for APM and Observability. Elastic offers companies a full-stack approach to observability with APM monitoring built-in. Teams do not need to work with multiple tools to get 360 degree views into their product. Elastic offers teams:
- Visibility across hybrid and multi-cloud: Accelerate your digital transformation with observability for cloud-native technologies, such as Kubernetes and serverless. Elastic also offers native support for OpenTelemetry.
- Improved troubleshooting and efficiency: Break down silos across your organization and consolidate metrics, logs, and traces with a single view into your environment.
- Powerful machine learning and analytics: Automate root cause analysis for your teams with innovative AIOps capabilities, such as APM correlations and anomaly detection.
- User experience monitoring: Get a detailed view of how your users interact with your site with real user monitoring (RUM). Proactively catch web performance issues before your customers do with synthetic monitoring.
APM glossary
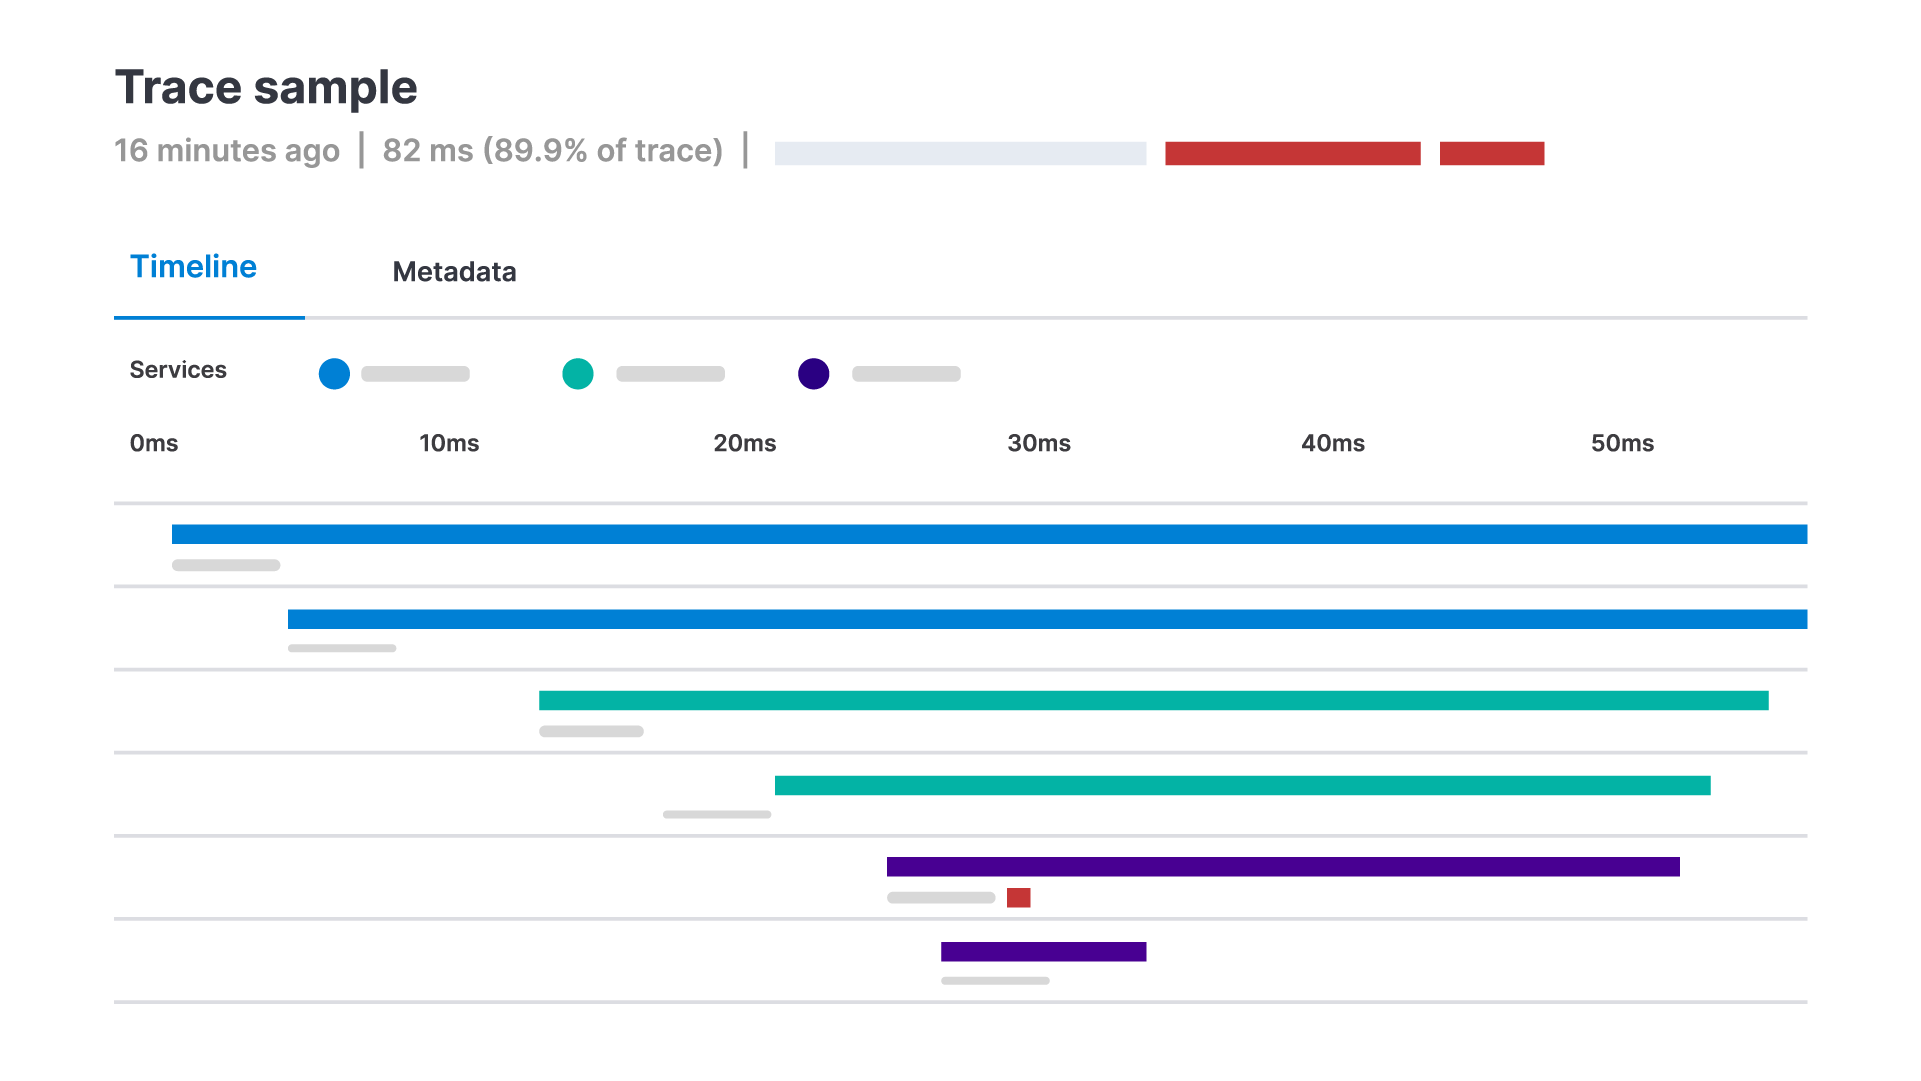
| Distributed tracing | Distributed tracing is the method of tracking and analyzing the flow of requests and responses through an application from frontend to backend services. It helps teams understand how different parts of an application are interacting with each other and identify potential bottlenecks or issues.
|
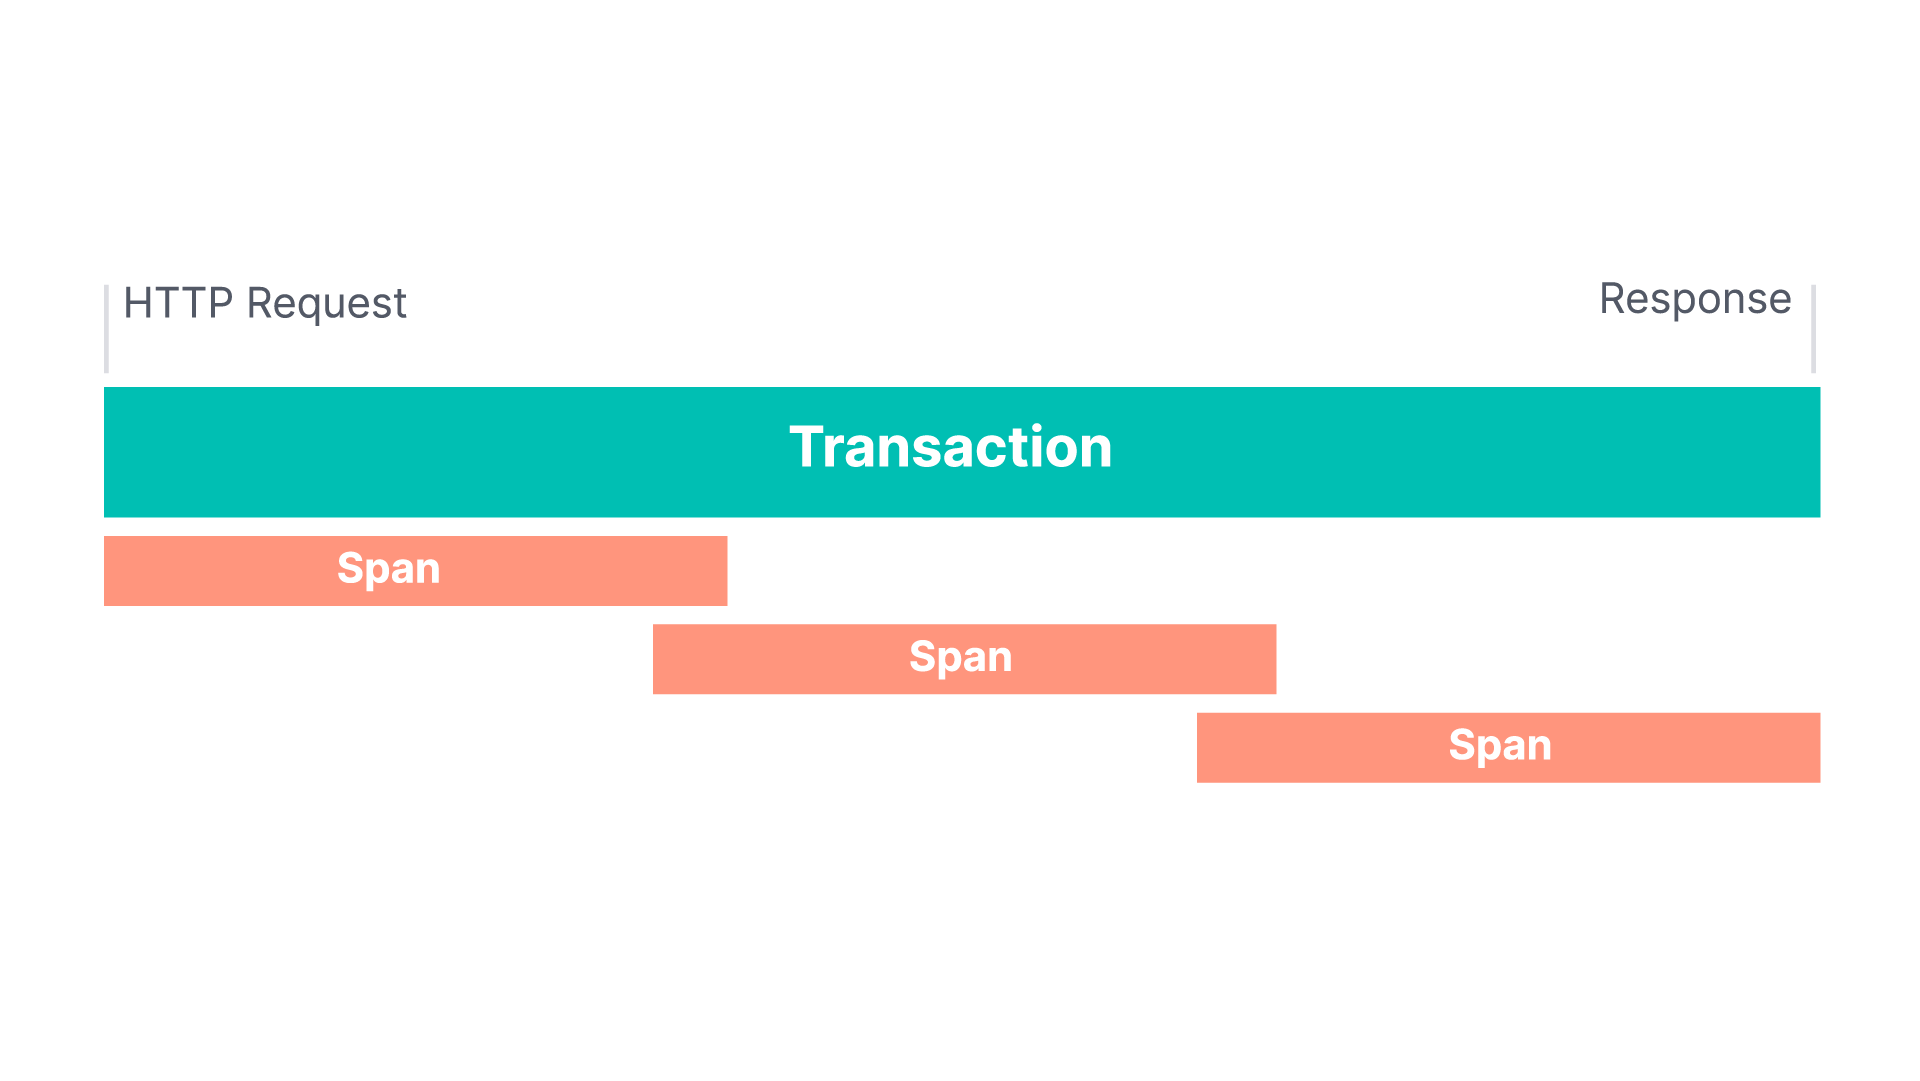
| Spans | Spans are each a piece of the workflow. They measure from the start to the end of an activity and contain execution information. Common span attributes are:
|
| Transactions | Transactions are events that correspond to a logical unit of work. They are often associated with an incoming request or similar task for a monitored service. Transactions can include multiple spans as well as additional attributes, like data about the environment in which the event is recorded. A few examples of transactions include:
In APM solutions, transactions usually refer to web transactions and are inclusive of all activity from the time a request is submitted to when a response is received. |
| Traces | Traces are a detailed code-level record of the actions performed by an application. They measure the status and duration of method or function calls made in relation to an application request. |
| Services | A service is a self-contained piece of software that performs a specific task or set of tasks. They are designed to be loosely coupled and highly reusable, and are often used in a microservices architecture. Services are often deployed using container technologies, such as Docker and Kubernetes. |
| OpenTelemetry | OpenTelemetry is an open-source framework for collecting and exporting telemetry data from applications, services, and libraries. It provides libraries and APIs for instrumenting code and collecting data, as well as tools and integrations for analyzing, visualizing, and storing the data. OpenTelemetry is vendor-neutral and extensible. It is considered the standard for collecting and exporting telemetry data. |