


Observability: Create a Synthetic Monitor
Overview
Introduction to Elastic Observability
Get more familiar with Elastic Observability as well as an overview on how to ingest, view, and analyze customer logs from your applications using Elastic Cloud. Learn how you can modernize applications and adopt the cloud with confidence.
Let's get started
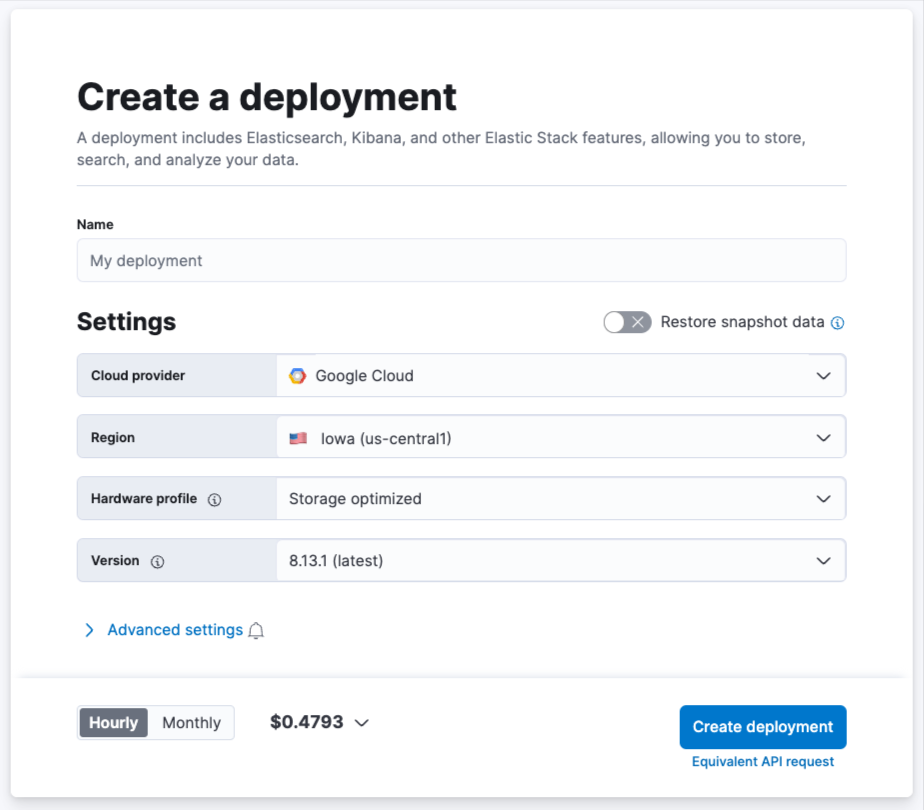
Create an Elastic Cloud account
Once you go to cloud.elastic.co and create an account, follow this video to learn how to launch your first Elastic stack in any one of our 50+ supported regions globally.
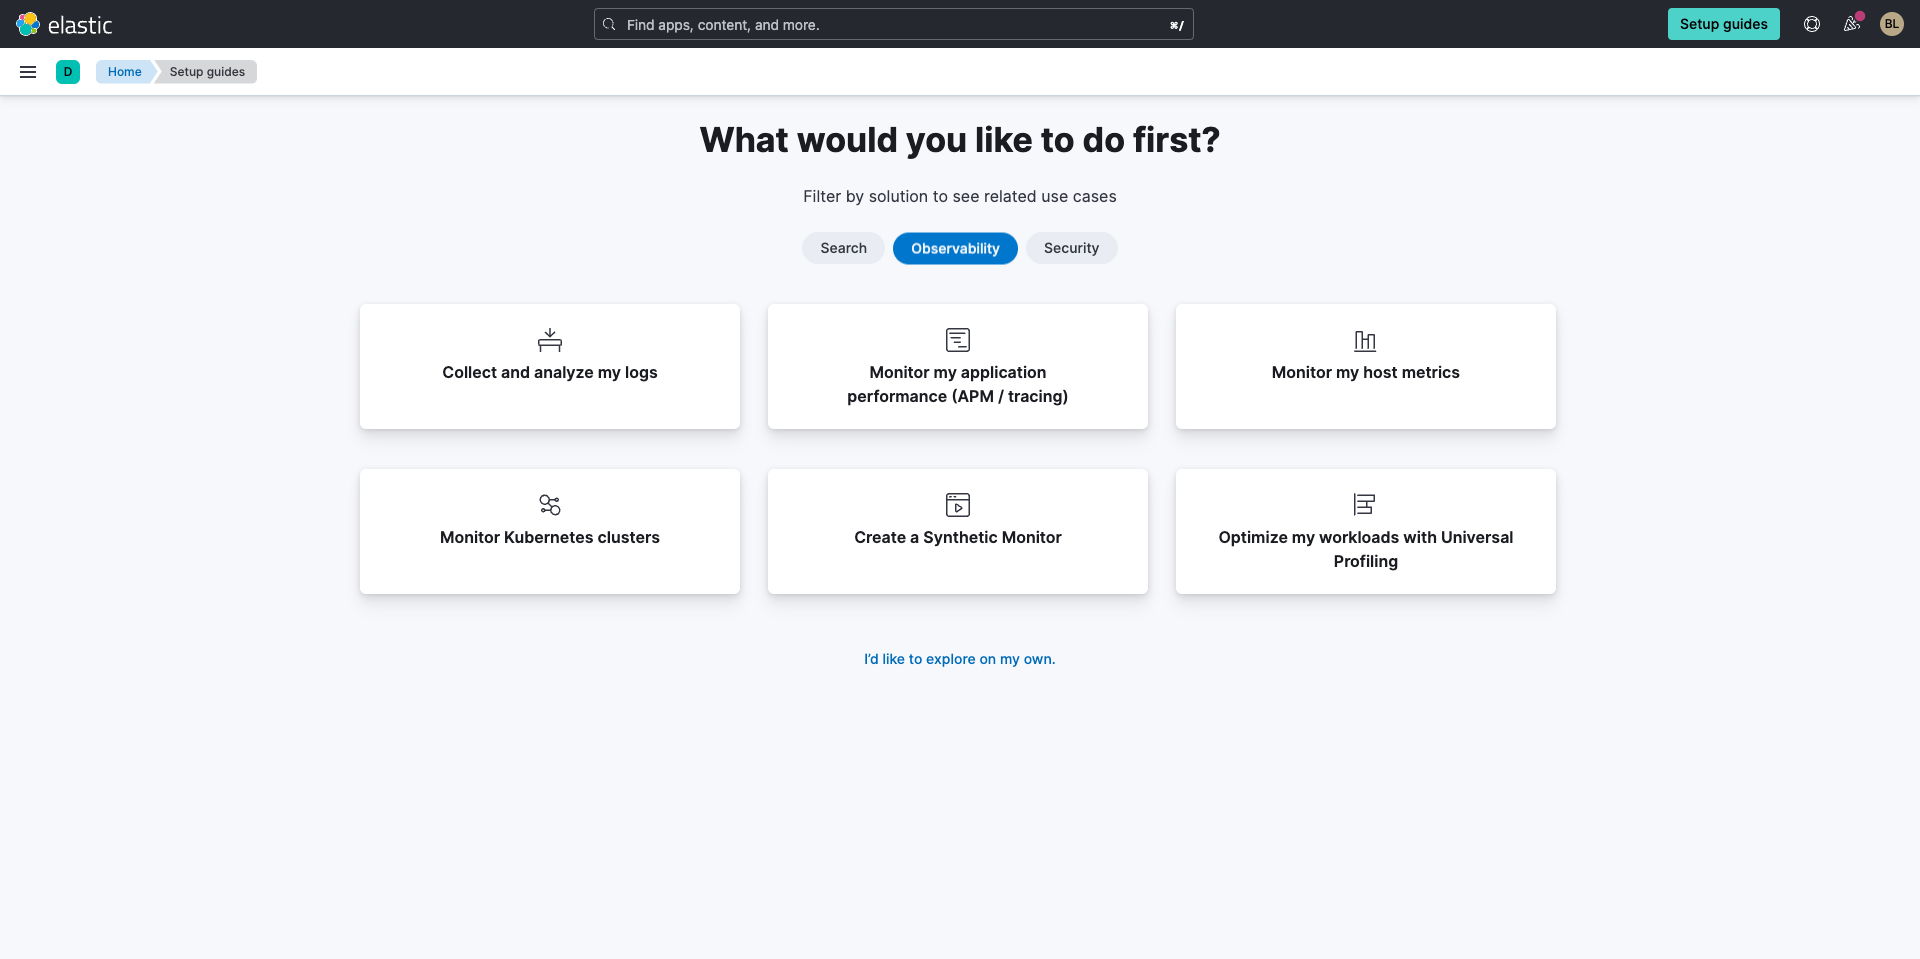
Once your deployment is complete, under the Observability tab, select Create a Synthetic Monitor.
There are two ways to run synthetic monitors which will depend on if the website or app being tested are accessible from:
- Elastic's global managed testing infrastructure: With Elastic's global managed testing infrastructure, you can create and run monitors in multiple locations without having to manage your own infrastructure. Elastic takes care of software updates and capacity planning for you. This is perfect for testing websites or applications that are accessible from the public internet.
- Private Locations: Private Locations allow you to run monitors from your own premises. To use Private Locations you must create a Private Location before continuing. For step-by-step instructions, refer to Monitor resources on private networks.
For the purpose of this guide, we'll show you how to leverage Elastic's global managed testing infrastructure.
NOTE: Projects are the most powerful and sophisticated way to configure synthetic monitors in the Elastic Stack. Projects let you define your infrastructure as code, more commonly known as IaaC or Git-ops. With project monitors you organize your YAML configuration and JavaScript- or TypeScript-defined monitors on the filesystem, use Git for version control, and deploy via a CLI tool, usually executed on a CI/CD platform.
Check out the following guide to create monitors with project monitors.
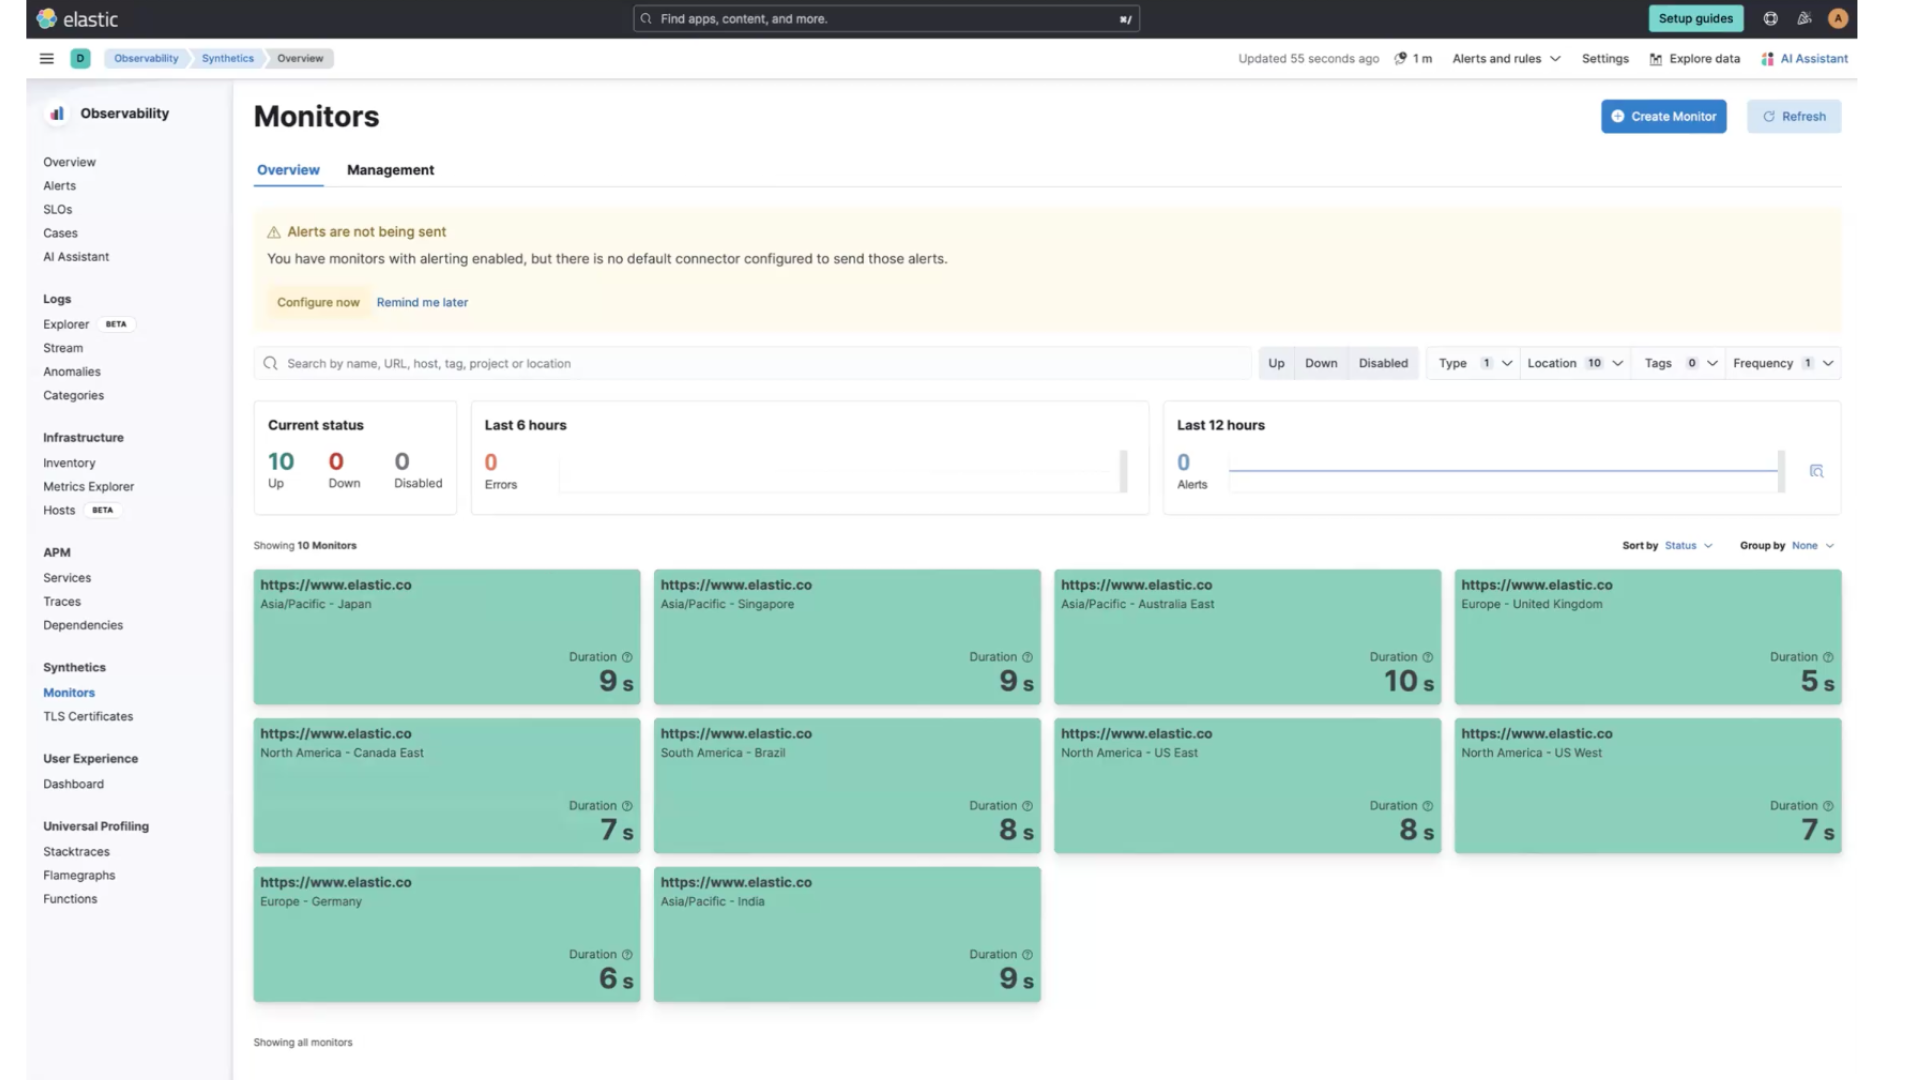
In the background it will be executing that test across all of those locations. This page will autofresh. It's that easy.
Working with Elastic Observability
Enable and edit alerts
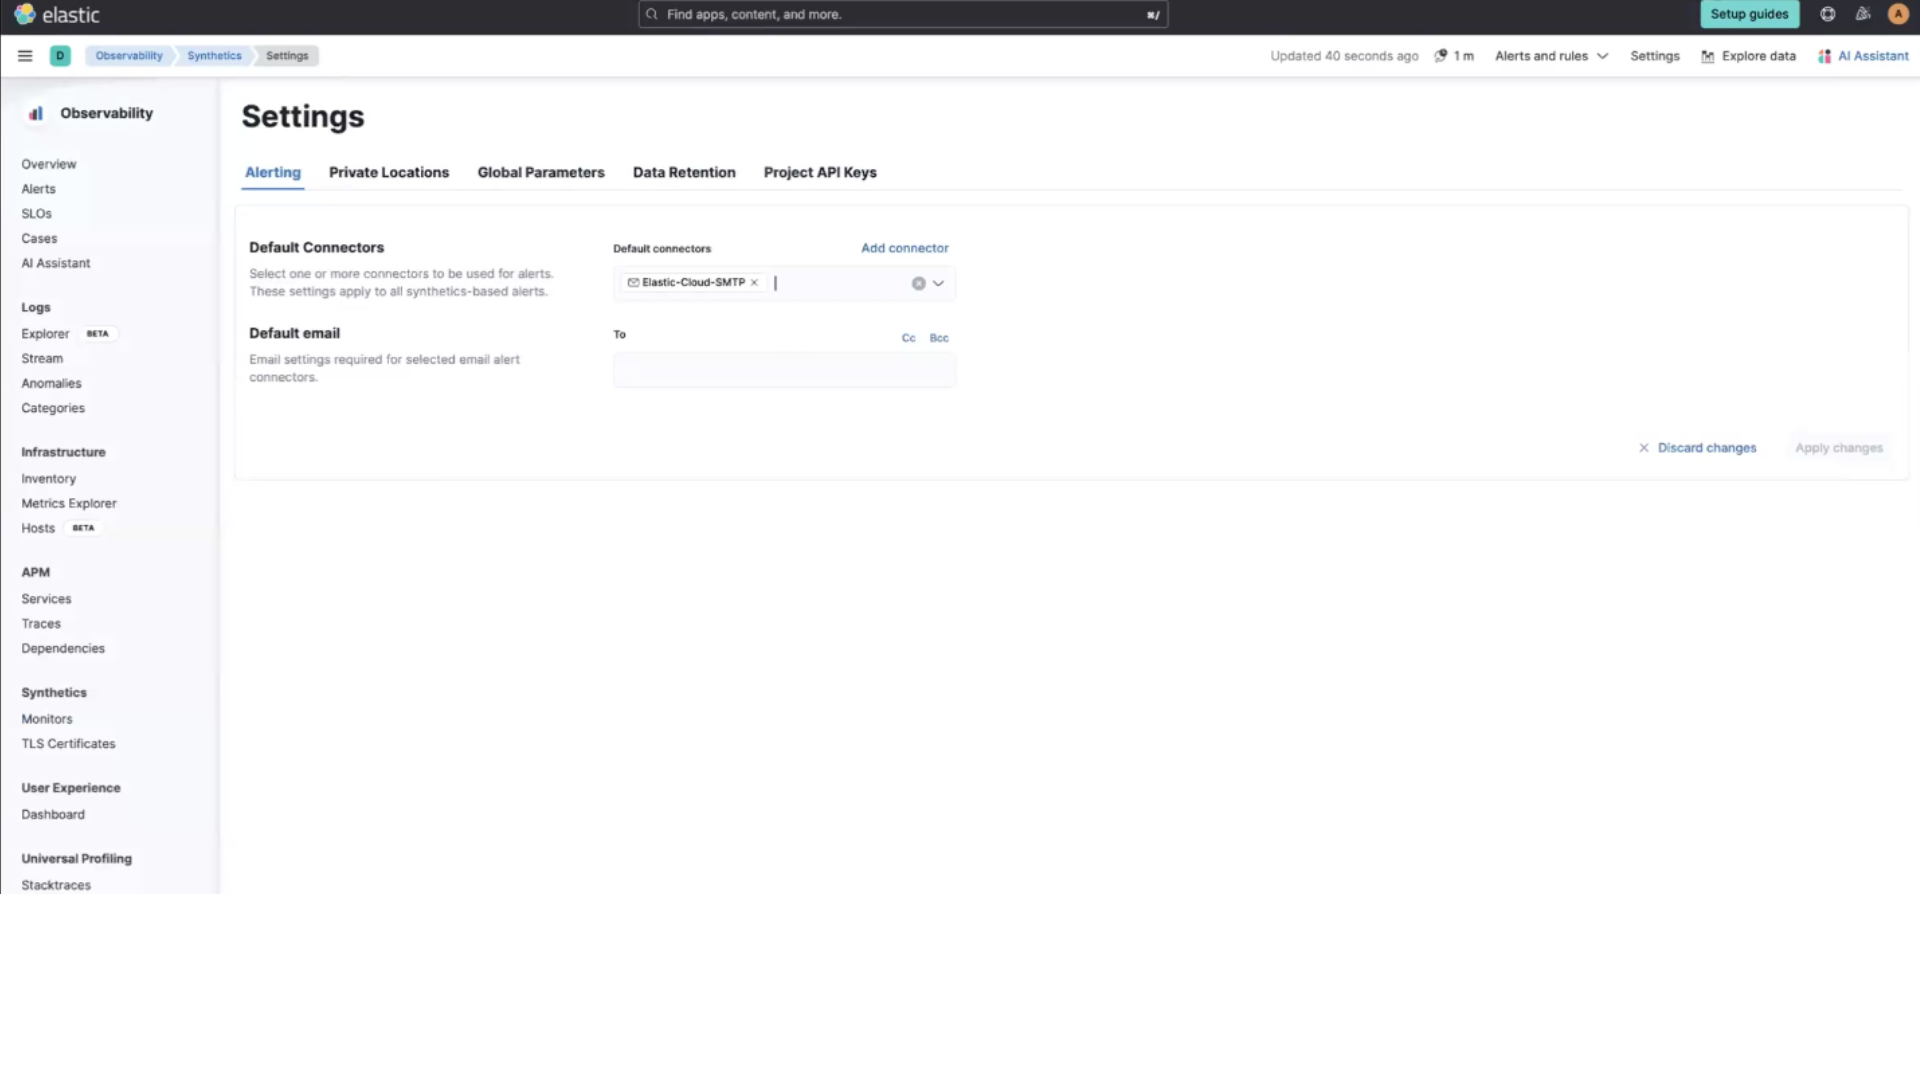
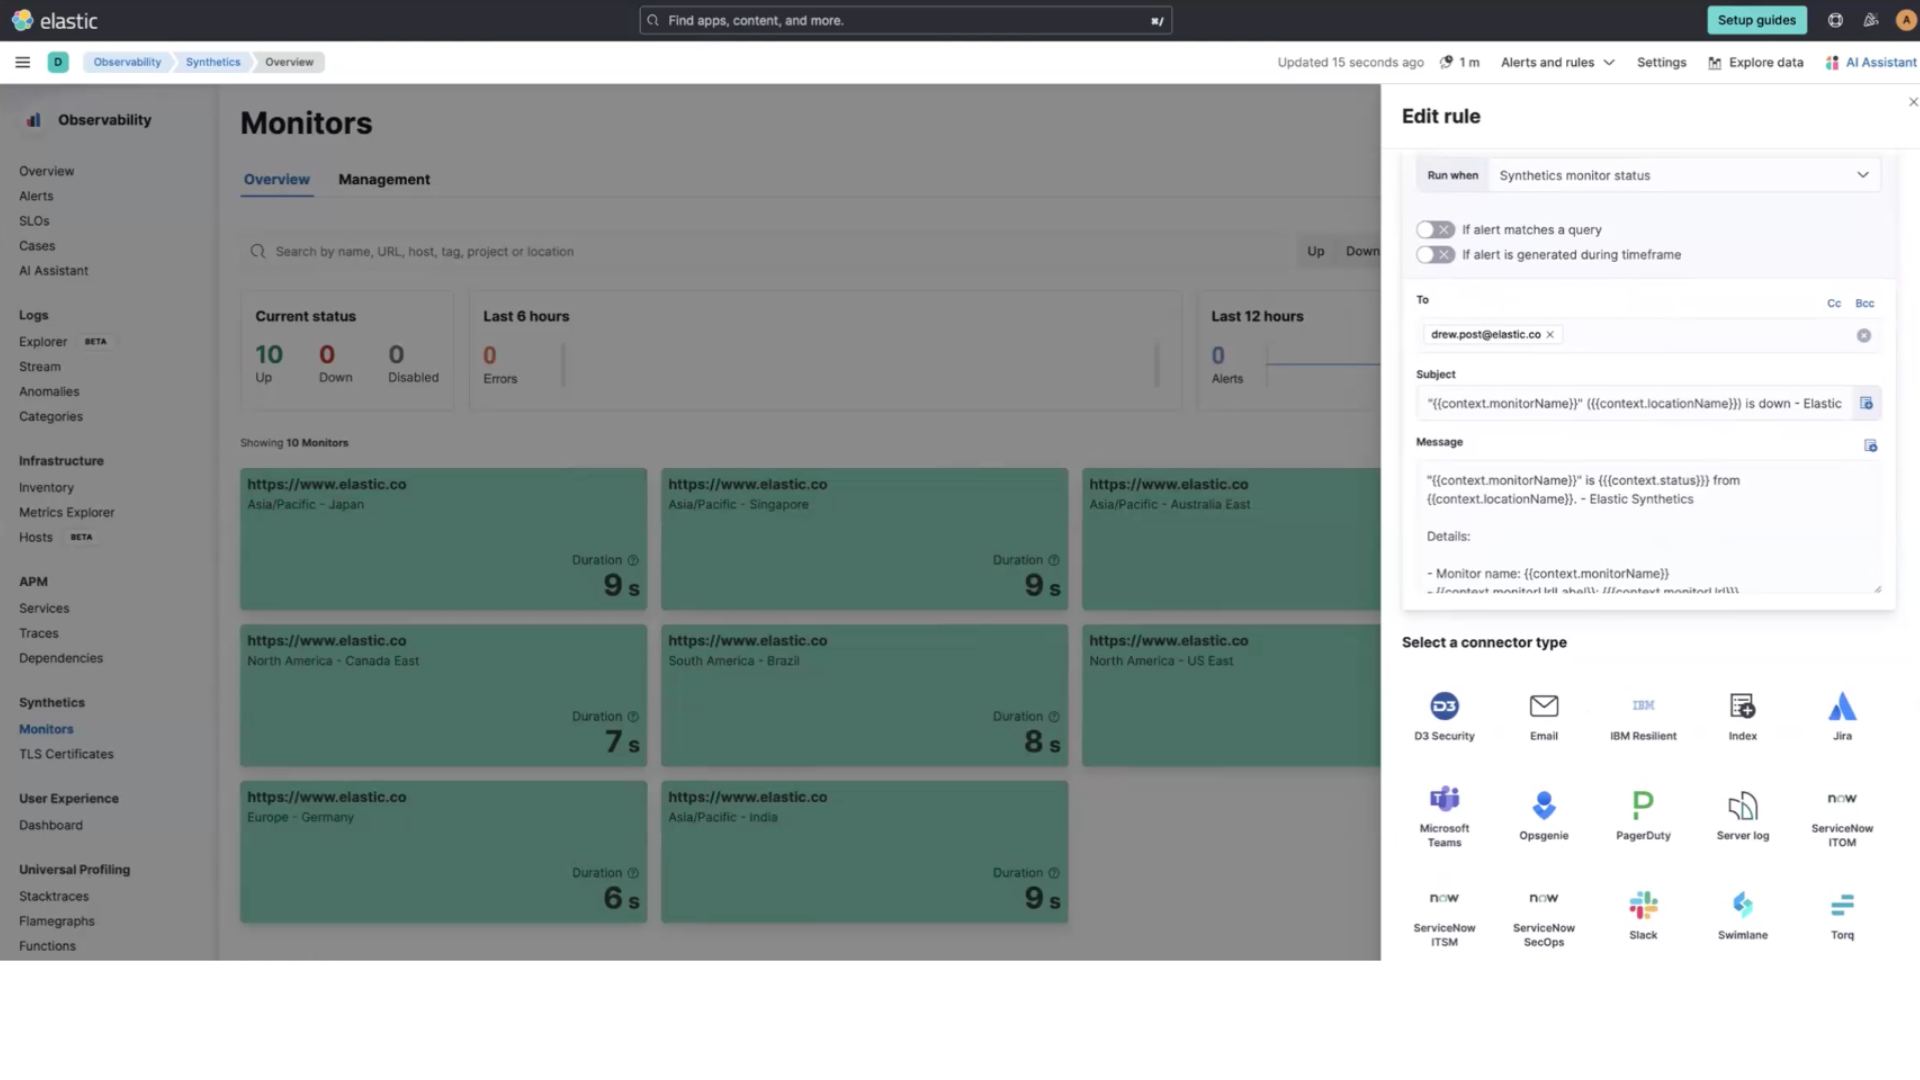
Next, if there are any issues, you'll want to enable alerts. From this screen, simply click Configure now.
On the following screen, you'll select the default connector, which is already prepopulated when you deploy Elastic. After you select your default connector you’ll be given a space to add your default email address for where you will receive the alerts.
If you navigate back to Monitors on the left menu you can select Alerts and rules then Monitor status rule.
A flyout will appear where you can edit your alerts. You can also select alternate connector types, such as Slack, Microsoft Teams, and more.
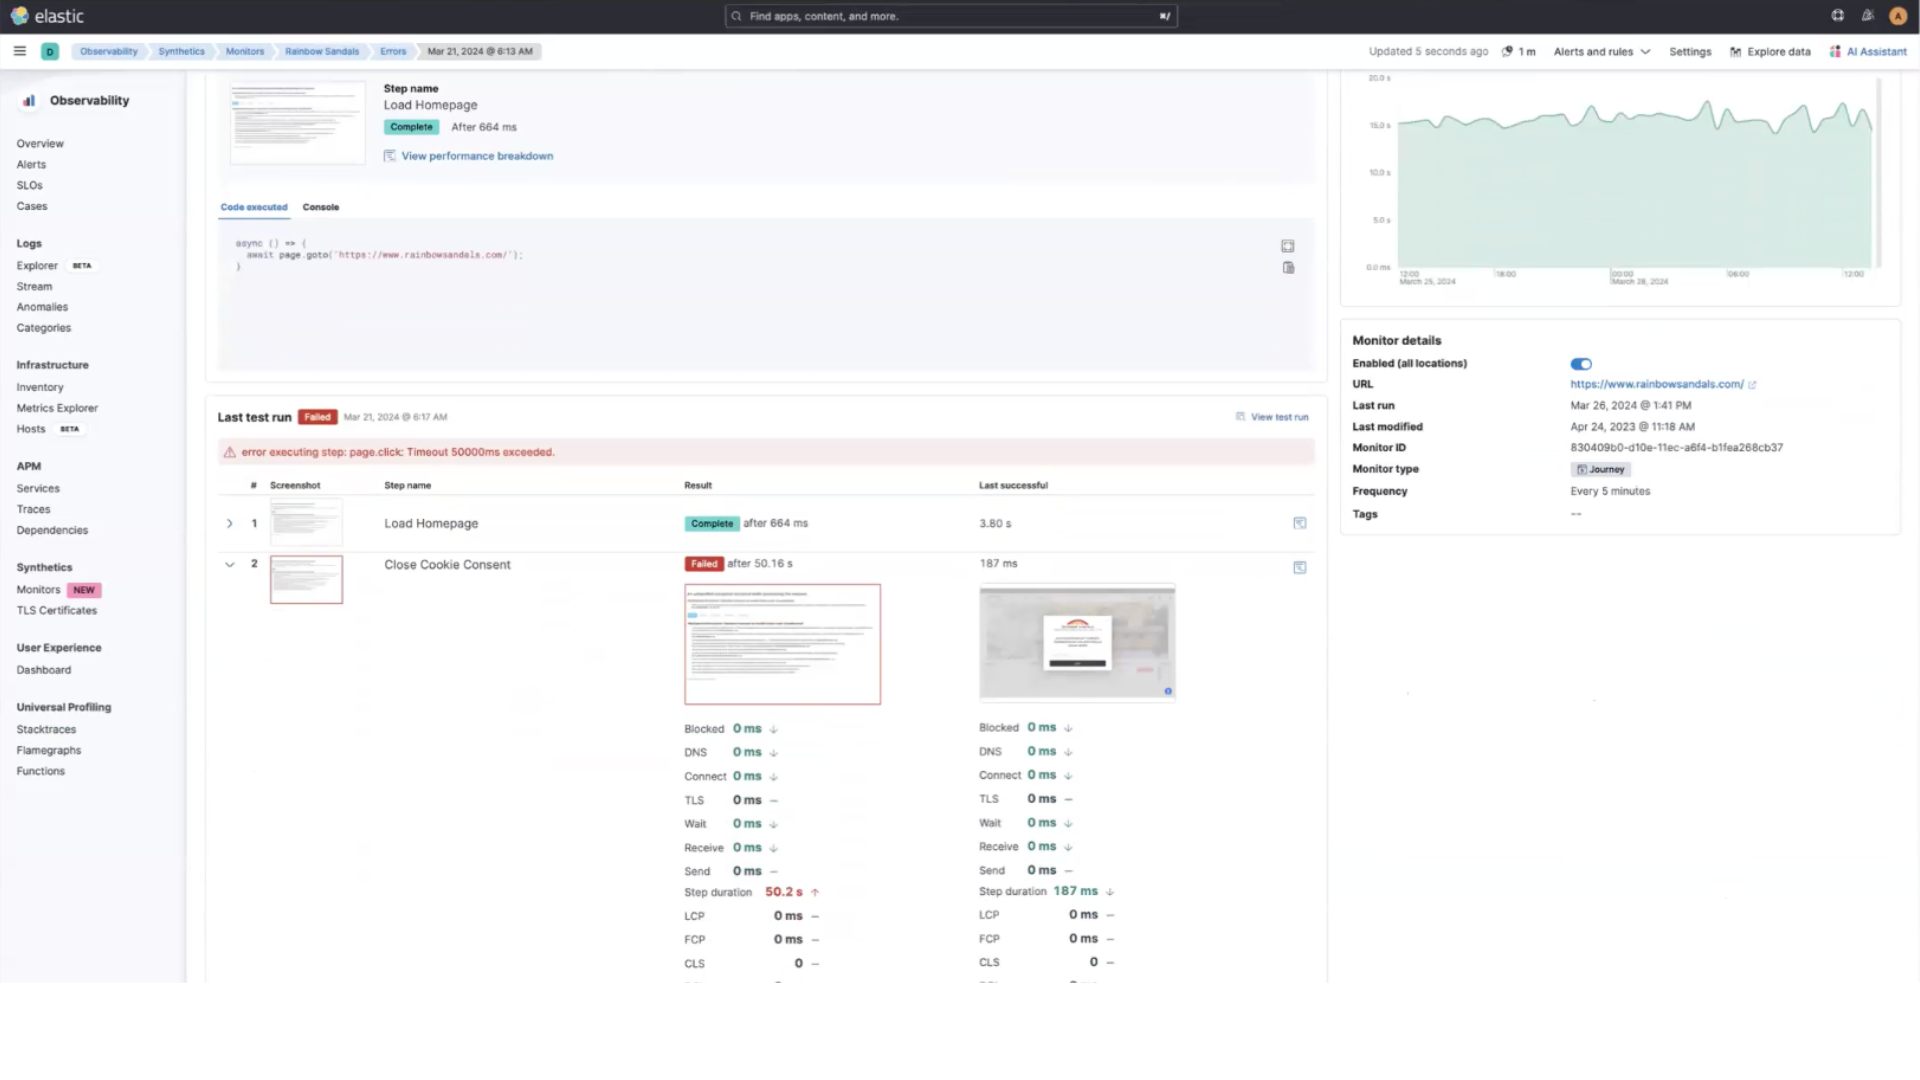
When you set up alerts and receive notifications, you’ll also receive a deep link directly into the Error details page. From here you you can see:
- What step failed
- Screenshot of the failed step
- Screenshot of the last time that step was successful
- The times of the failed step and last time step was successful to compare
- Select Code executed, to see the code that was executed
- Select Console to see what the browser is showing
Analyze your monitor data
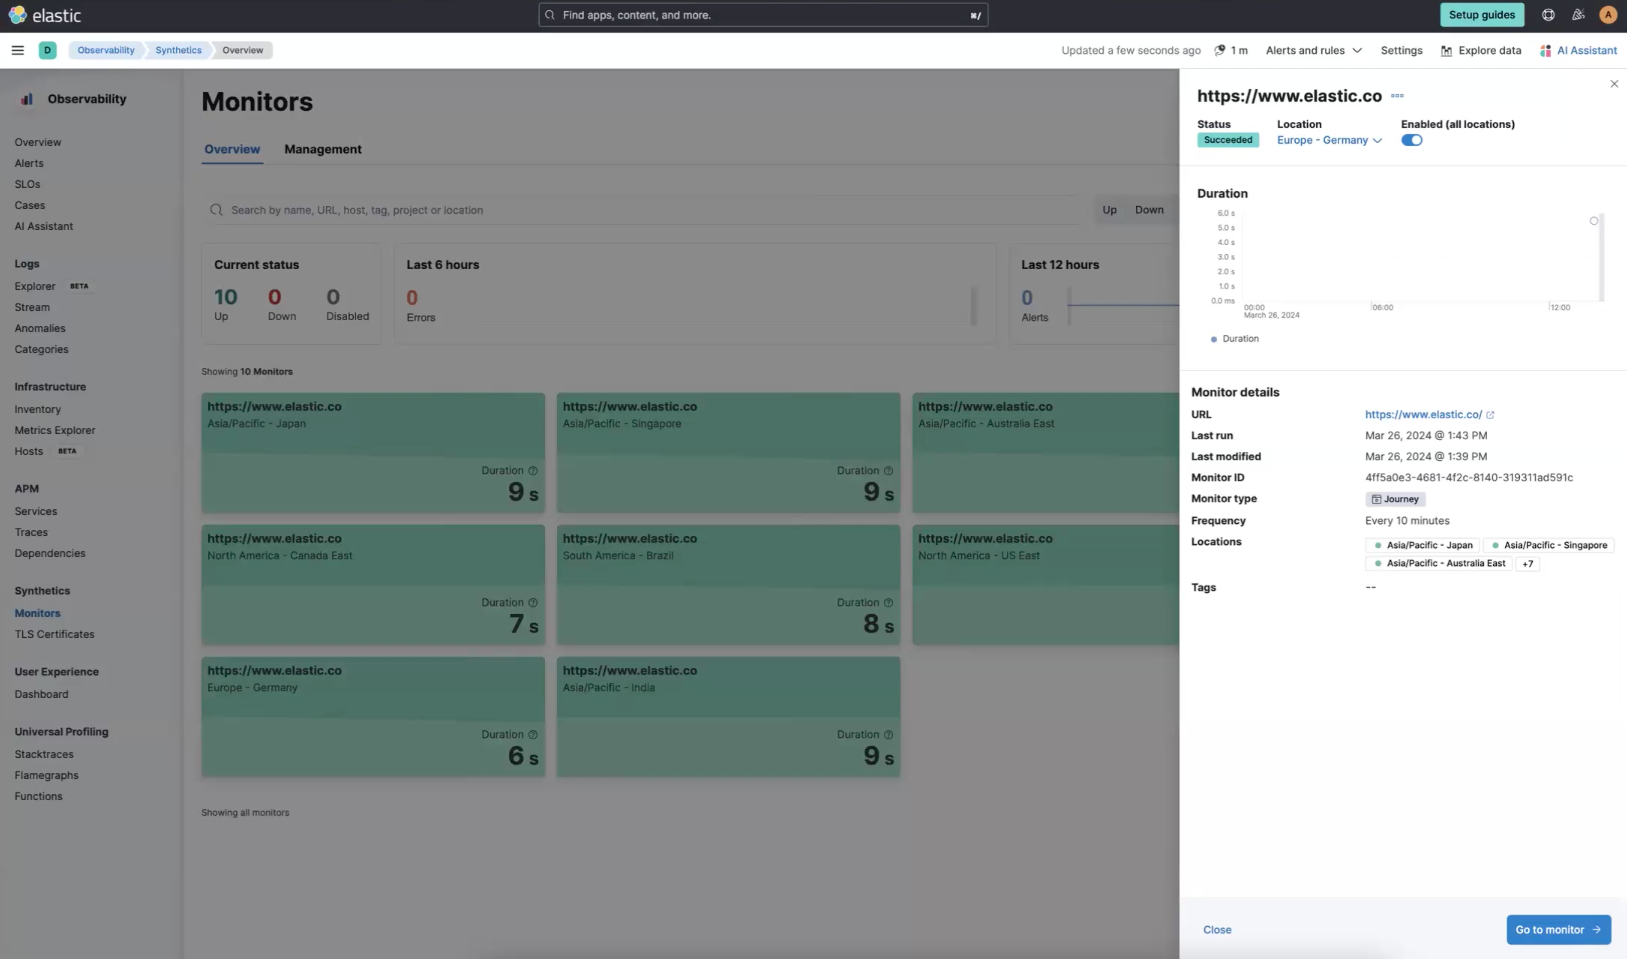
If you navigate back to Monitors in the left navigation pane, and select one of the monitors, you’ll see a flyout with a quick summary of the monitor on the right.
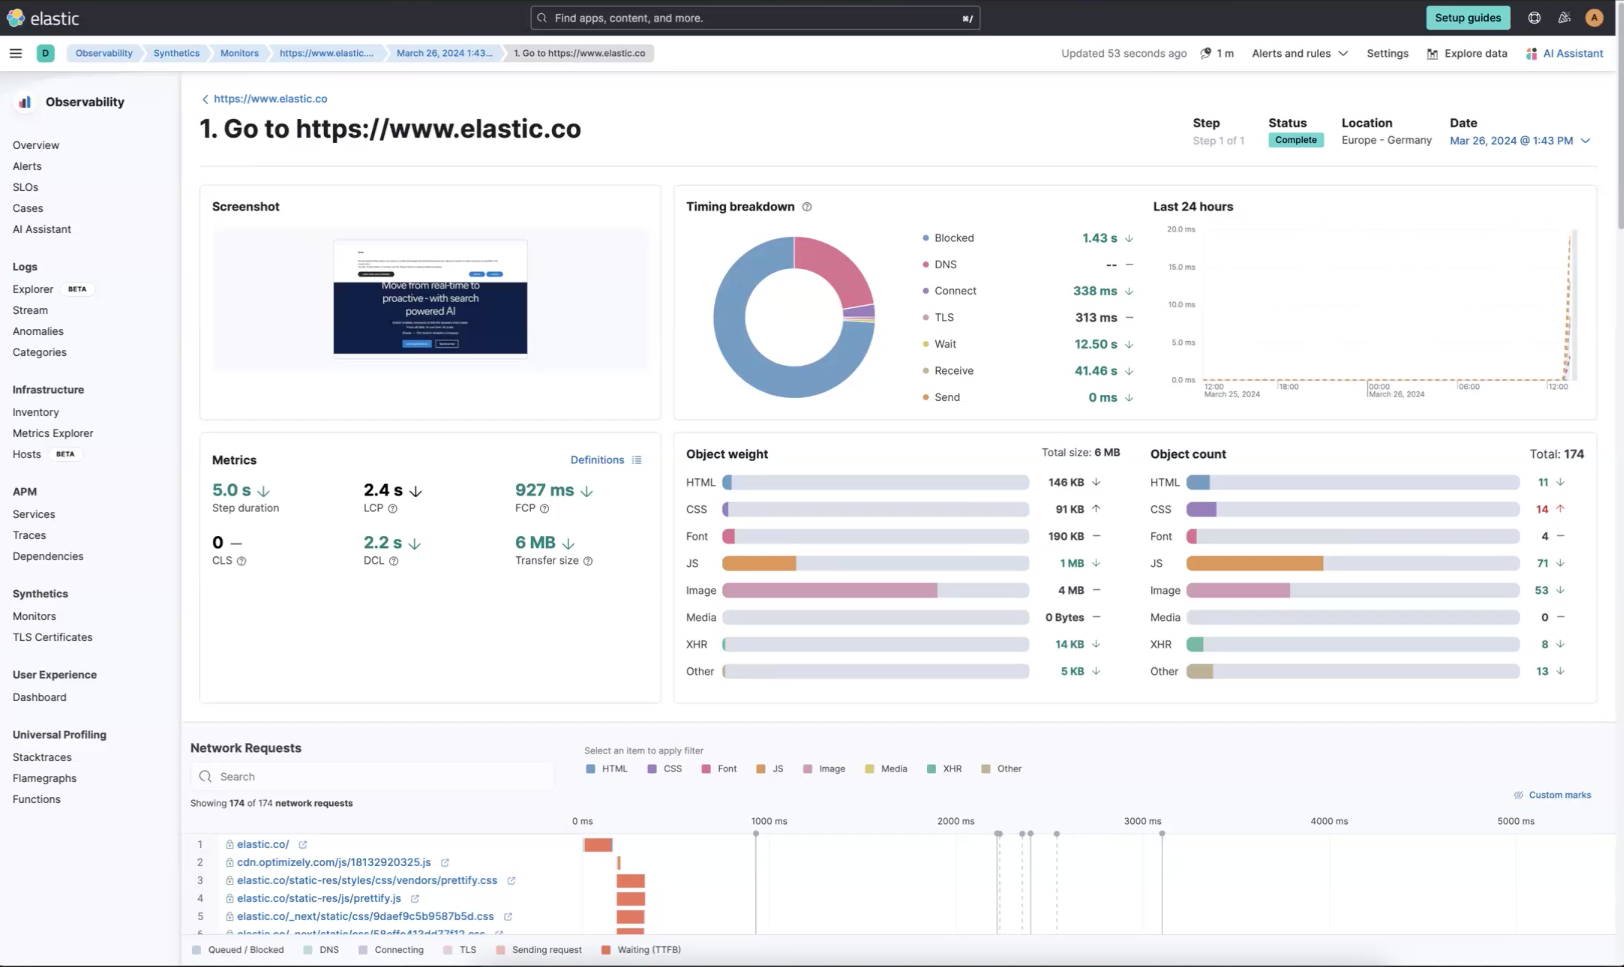
Next, if you select Go to monitor, you’ll immediately get some high level insight. These charts will start to render as more tests come through but you can quickly see the availability, the duration to execute tests, the timeline, and you can also drill into the waterfall chart. To drill in click the icon under View test run.
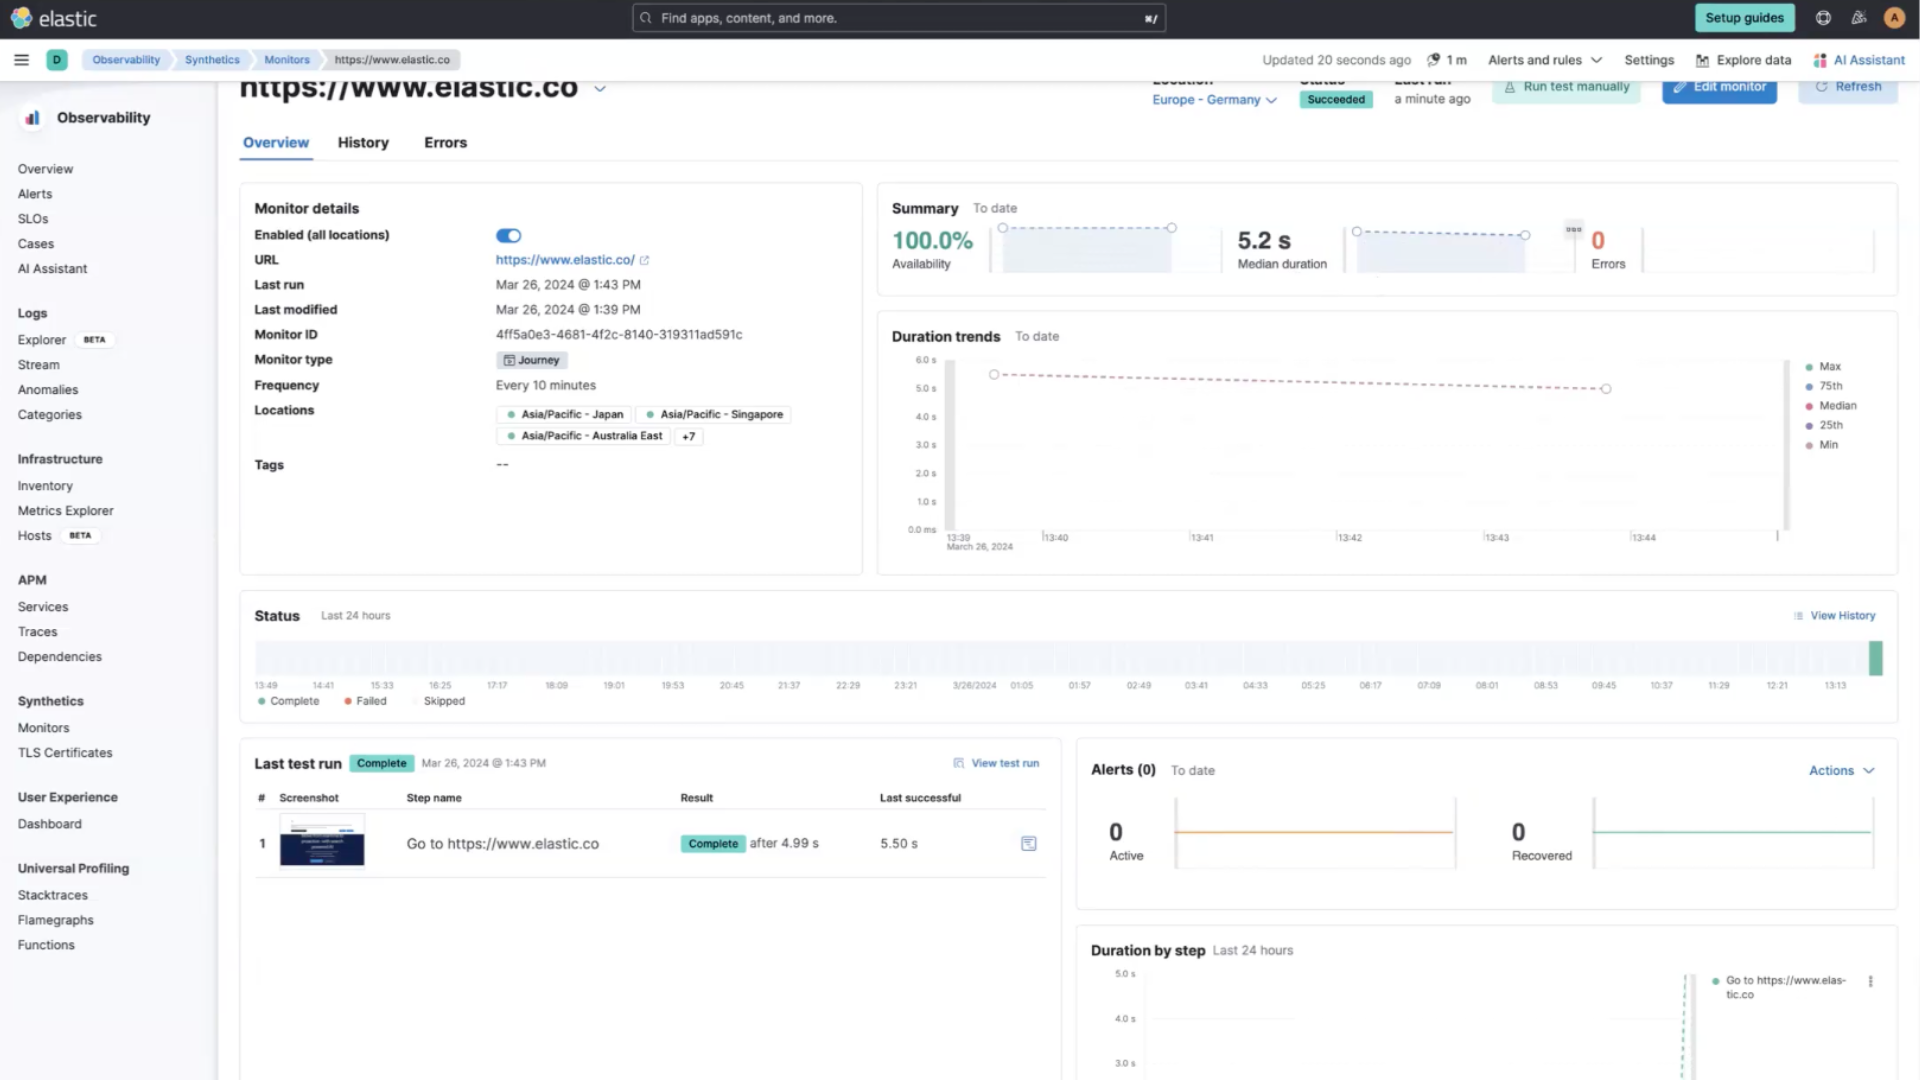
From here you can see the waterfall chart, object weight, object count, and more.
Next steps
Thanks for taking the time to collect and analyze logs with Elastic Cloud. If you're new to Elastic, be sure to spin up a free 14-day trial.
Also, as you begin your journey with Elastic, understand some operational, security, and data components you should manage as a user when you deploy across your environment.
Observability resources
- Explore observability demo gallery
- Get started with collecting and analyzing your logs
- Get started with monitoring your application performance (APM/tracking)
- Get started with monitoring your hosts
- Get started with monitoring Kubernetes clusters
- Get started with optimizing workloads with universal profiling
- Create monitors for project monitors