Elastic Observability: Collect and analyze logs
Overview
Introduction to Elastic Observability
Get more familiar with Elastic Observability as well as an overview on how to ingest, view, and analyze customer logs from your applications using Elastic Cloud. Learn how you can modernize applications and adopt the cloud with confidence.
Interactive demo: Log monitoring overview
Check out this interactive demo to get a tour of what you can experience when you leverage Elastic Observability for log monitoring.
Best practices for log management and leveraging logs for faster problem solving
Learn the benefits of a log management solution, challenges you'll likely encounter along the way, and some tips to help you avoid the pitfalls that often appear when starting up or trying to improve your log aggregation.
Let's get started
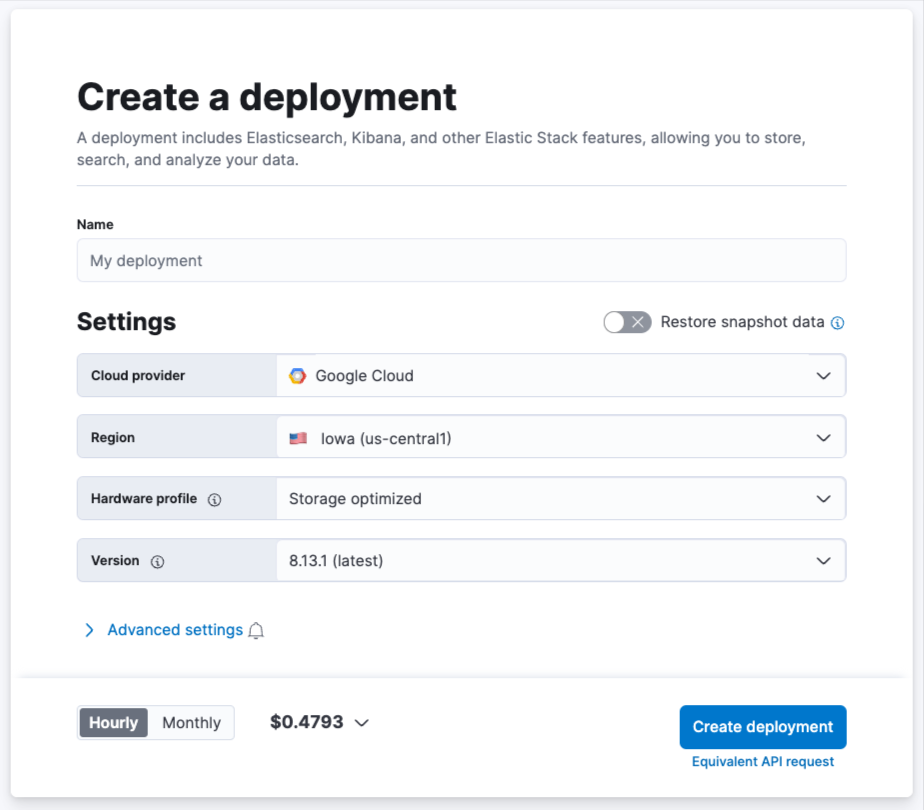
Create an Elastic Cloud account
Get started with a 14-day trial. Once you go to cloud.elastic.co and create an account, follow this video to learn how to launch your first Elastic stack in any one of our 50+ supported regions globally.
 Once your deployment is complete, under the Observability tab, select Collect and analyze logs.
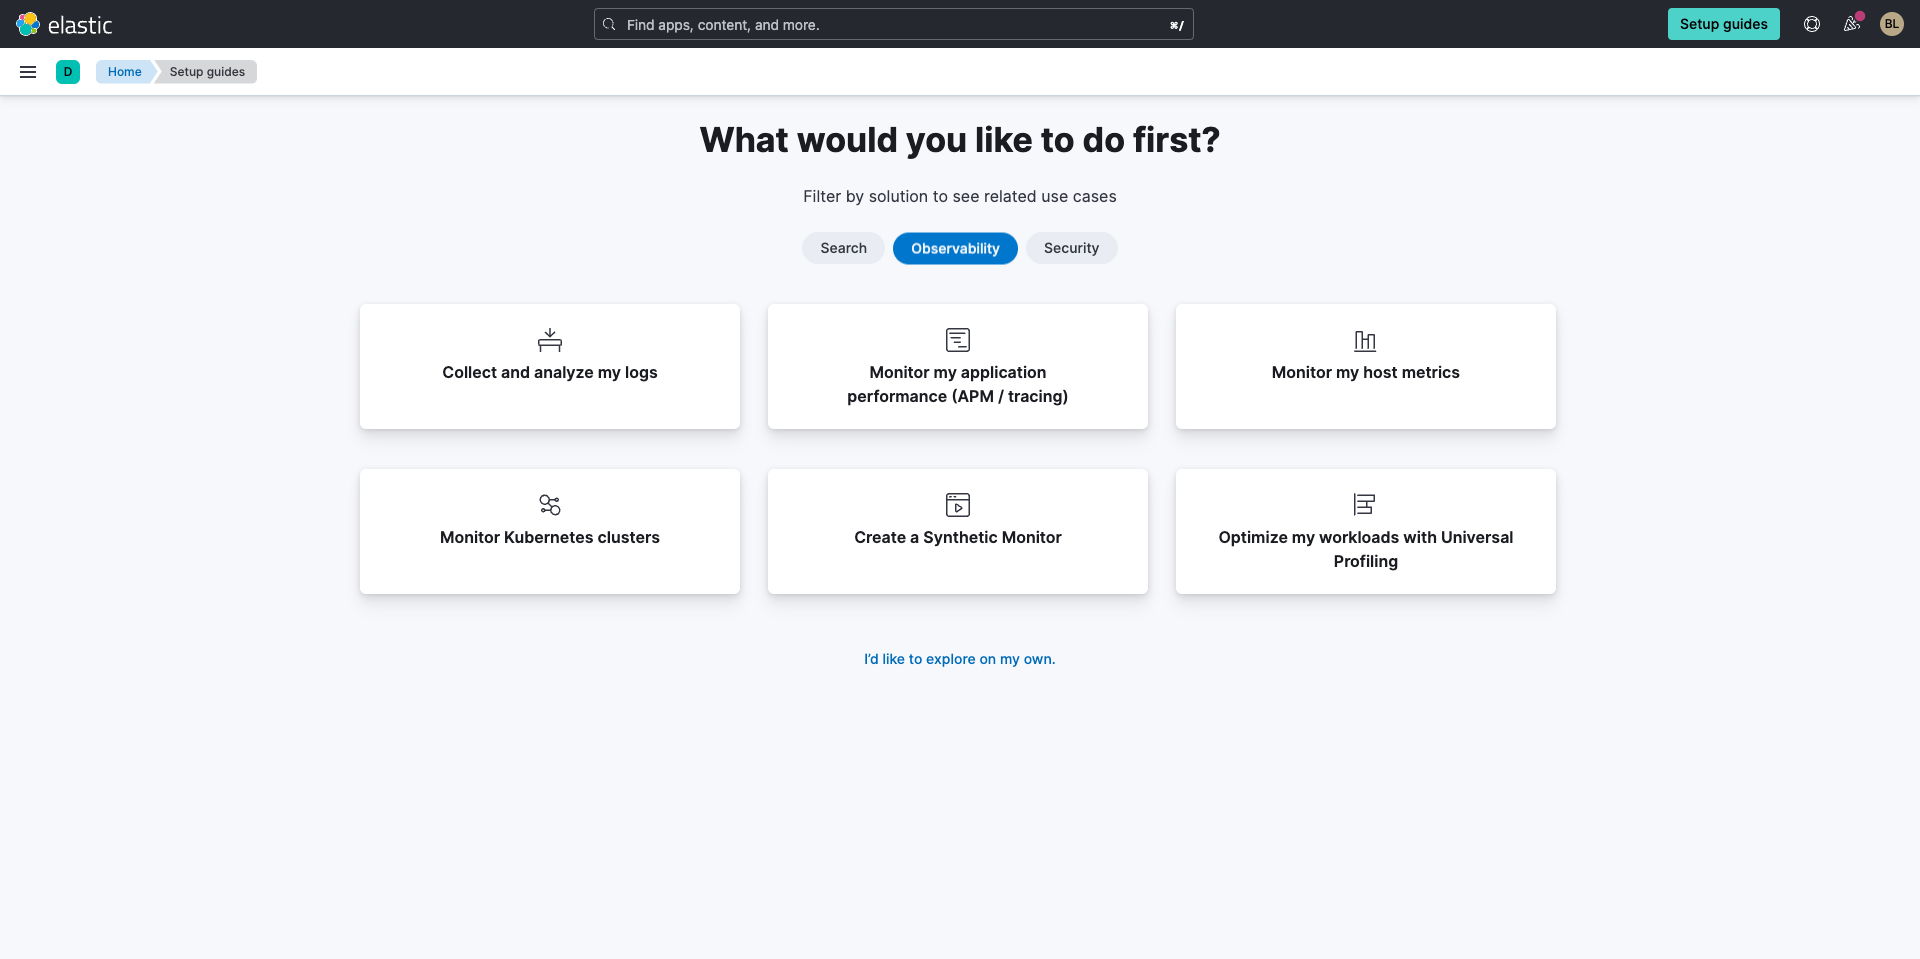 Next you’ll be brought to the Collect and analyze logs screen. Here, select Stream host system logs.
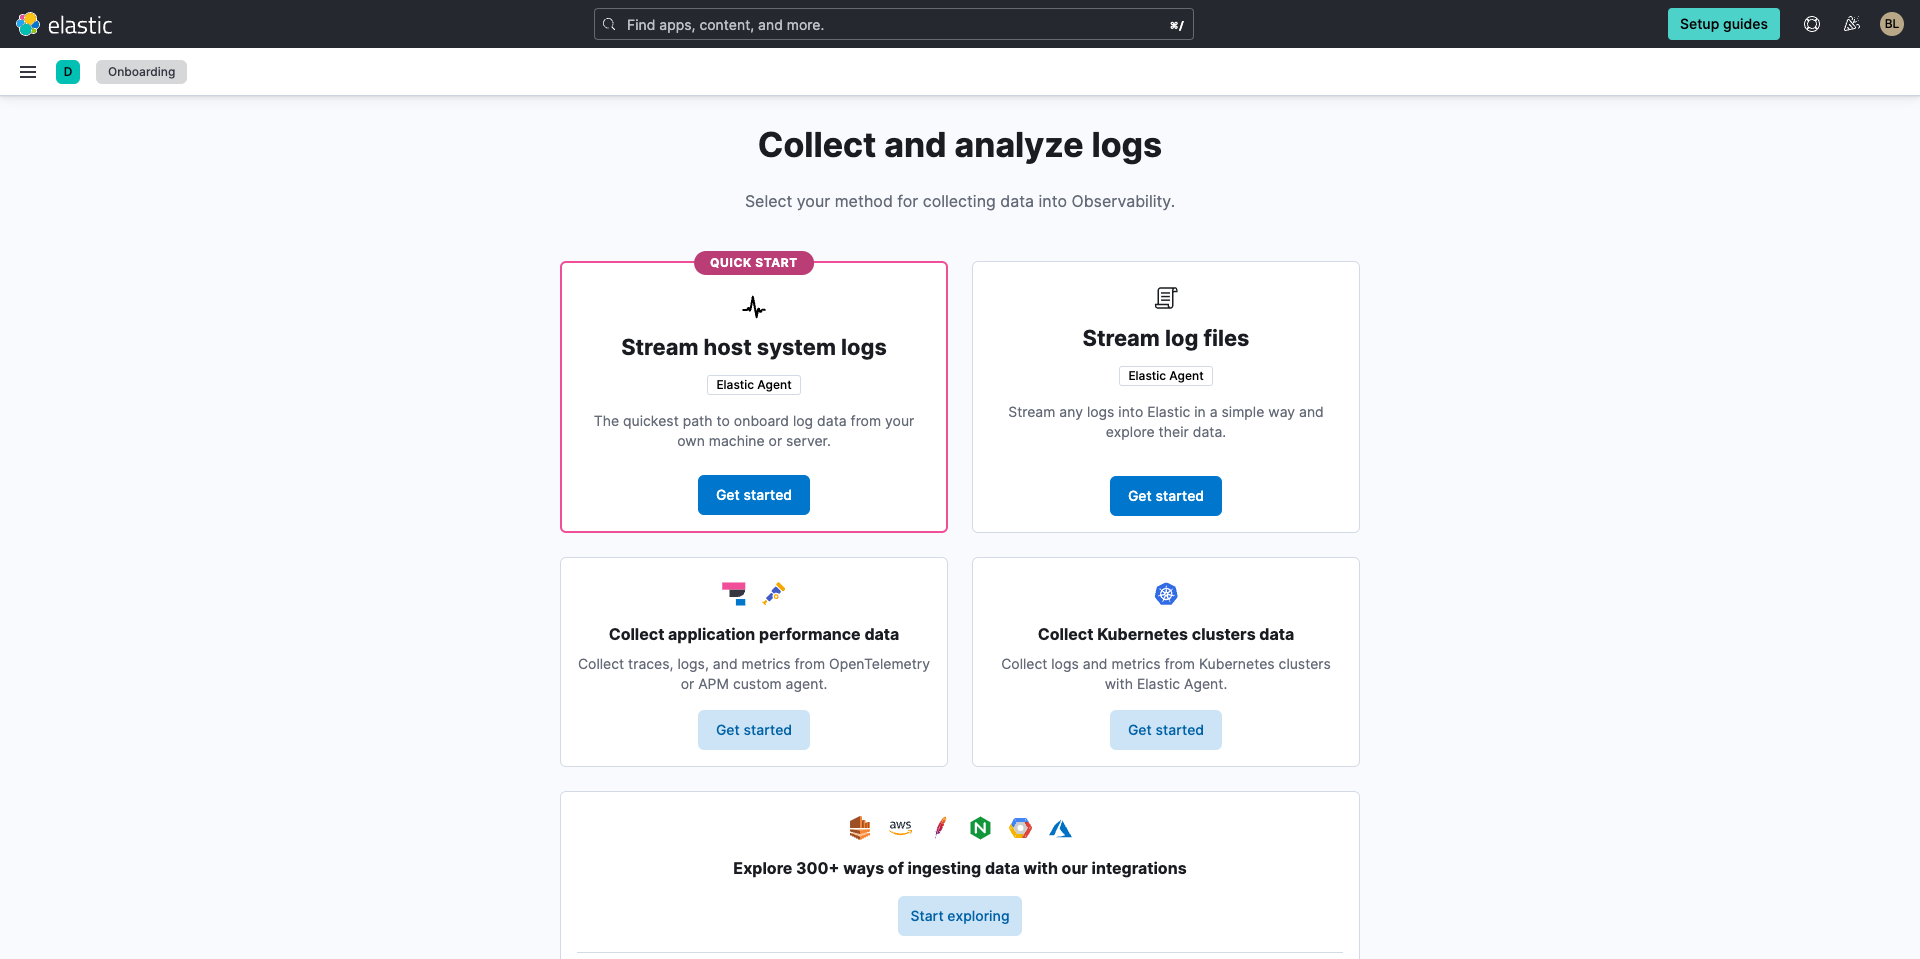
Ingest all your telemetry data
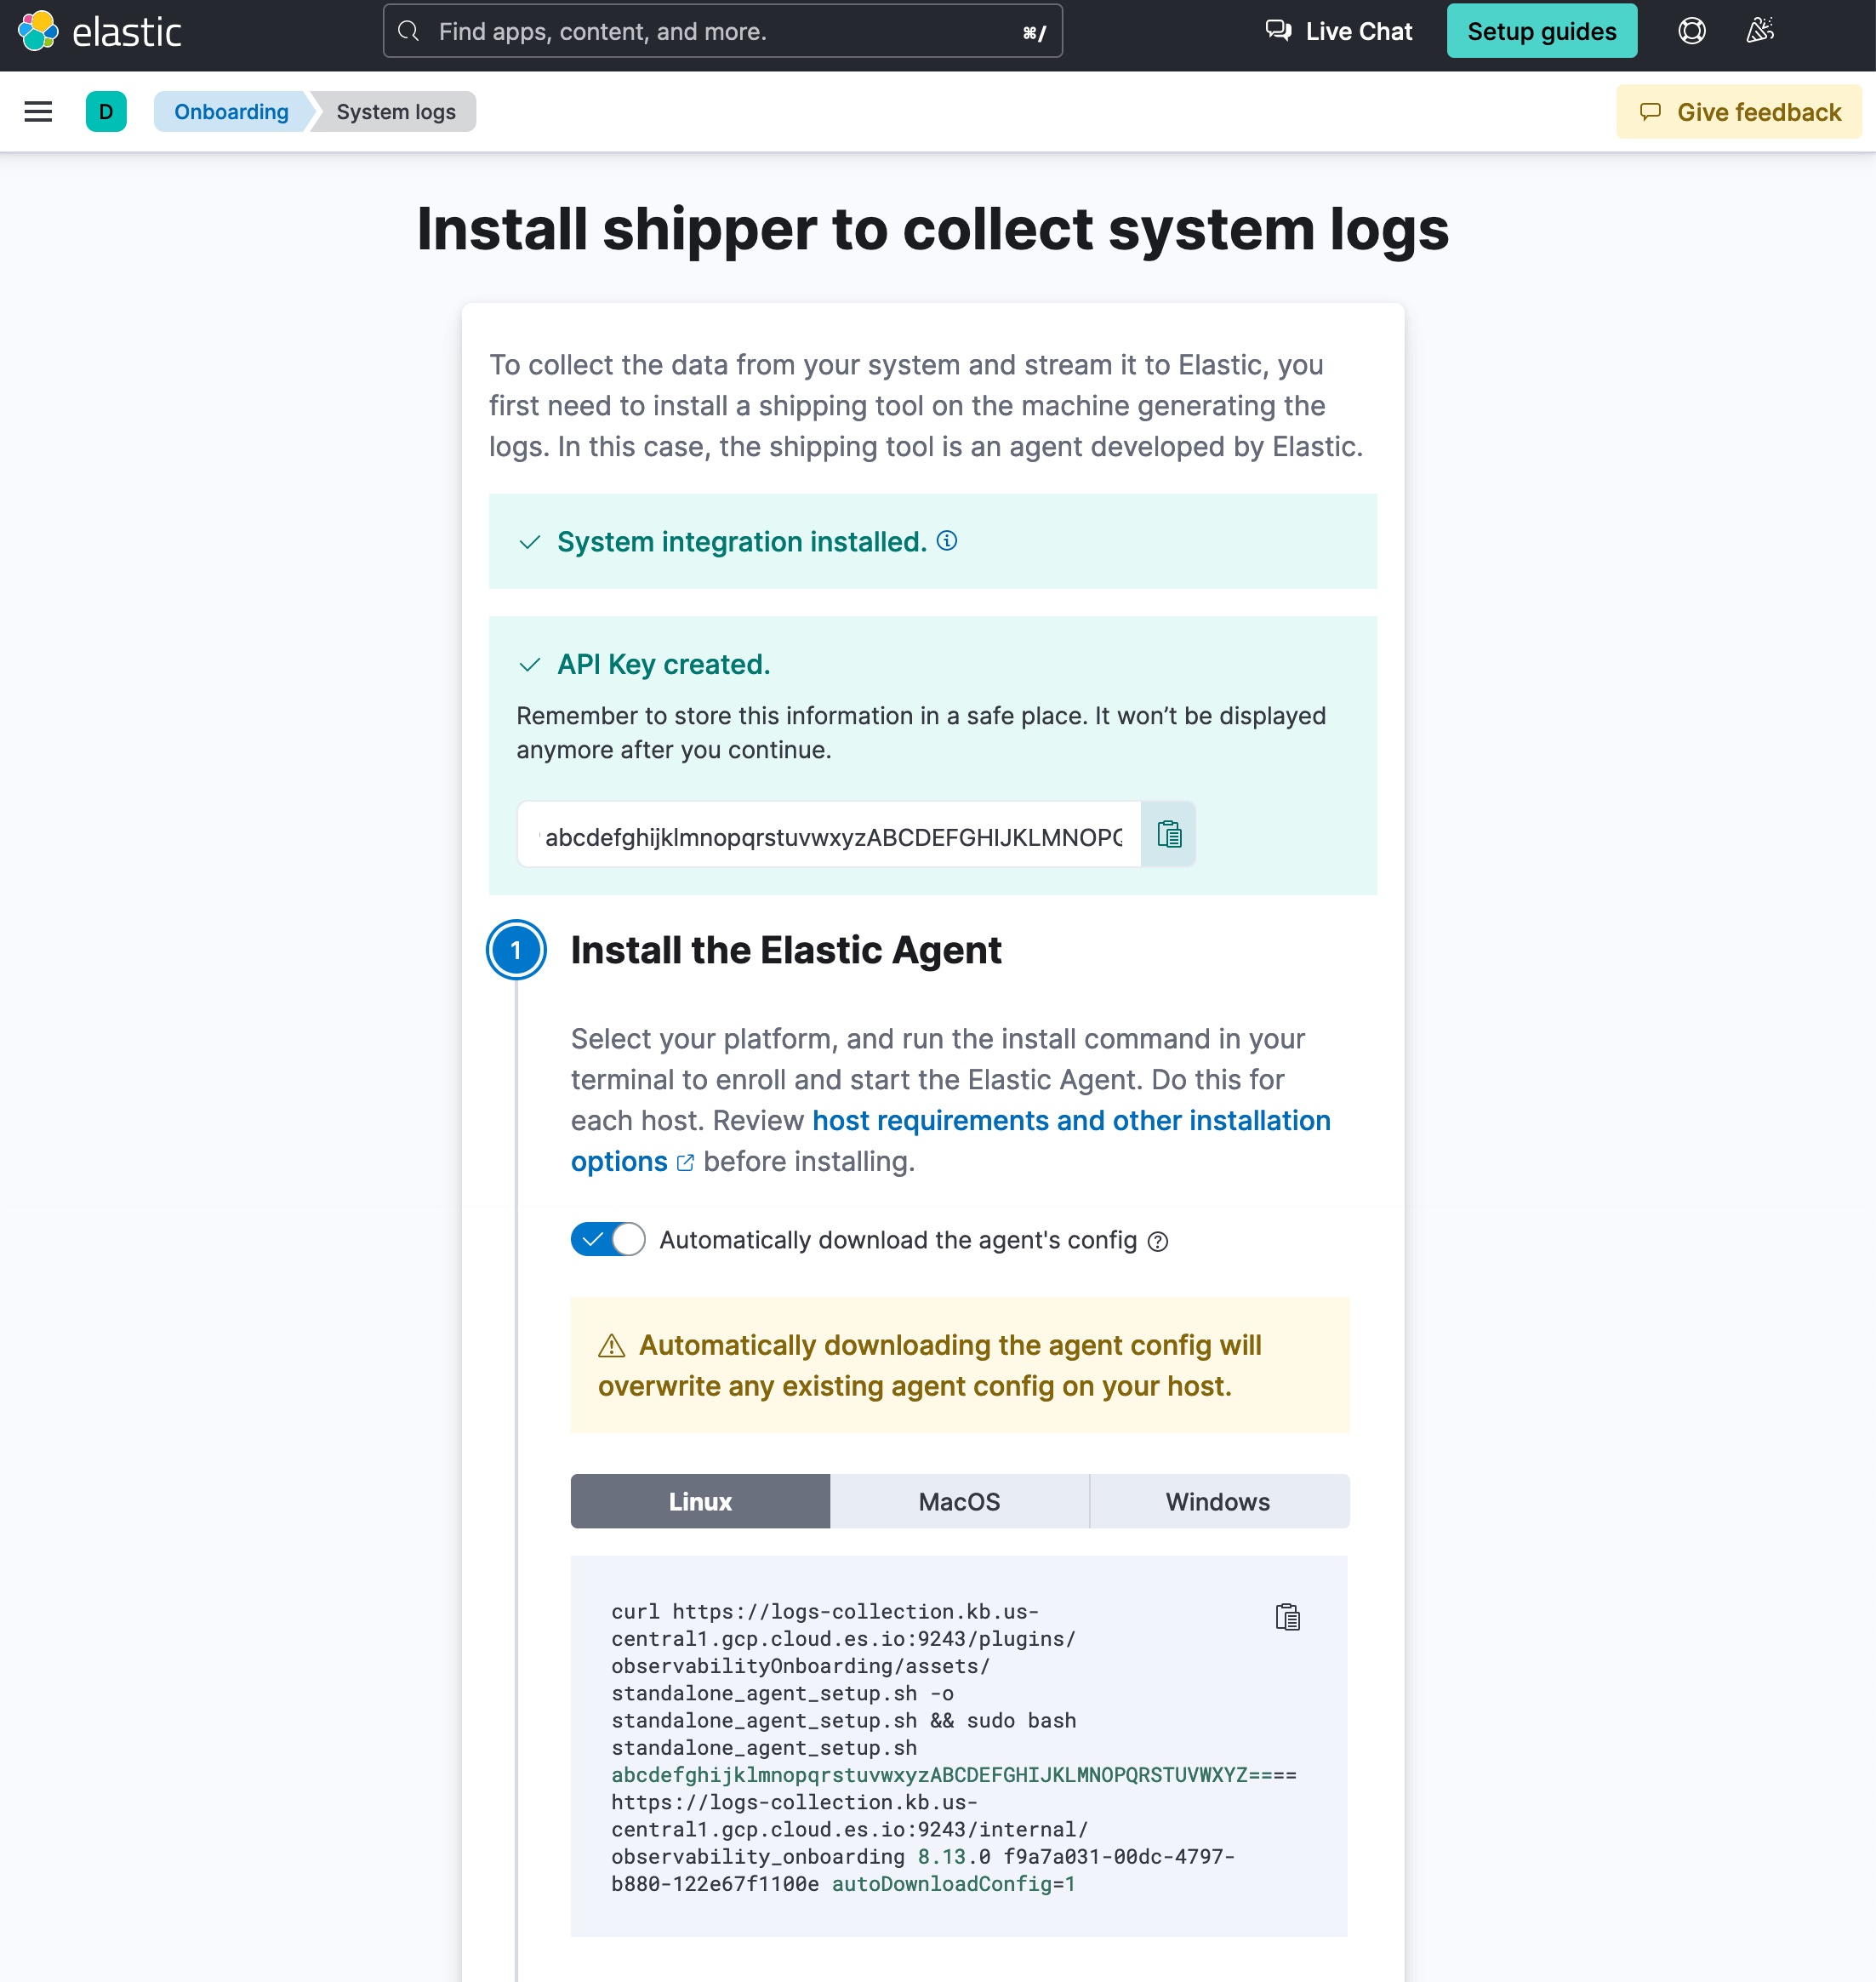
If this is your first time using Elastic you will need to add an agent, the preferred way to get your logs in. Once you select Stream host system logs you’ll be prompted to install the Elastic Agent.
Be sure to turn on Automatically download the agent’s config.
Depending on what type of host you are installing the Elastic agent on, select the corresponding Linux, MacOS or Windows tab. Then copy the entire agent installation command. Open a terminal window on the host system from which you want to ingest logs and run the copied command to install the Elastic agent.
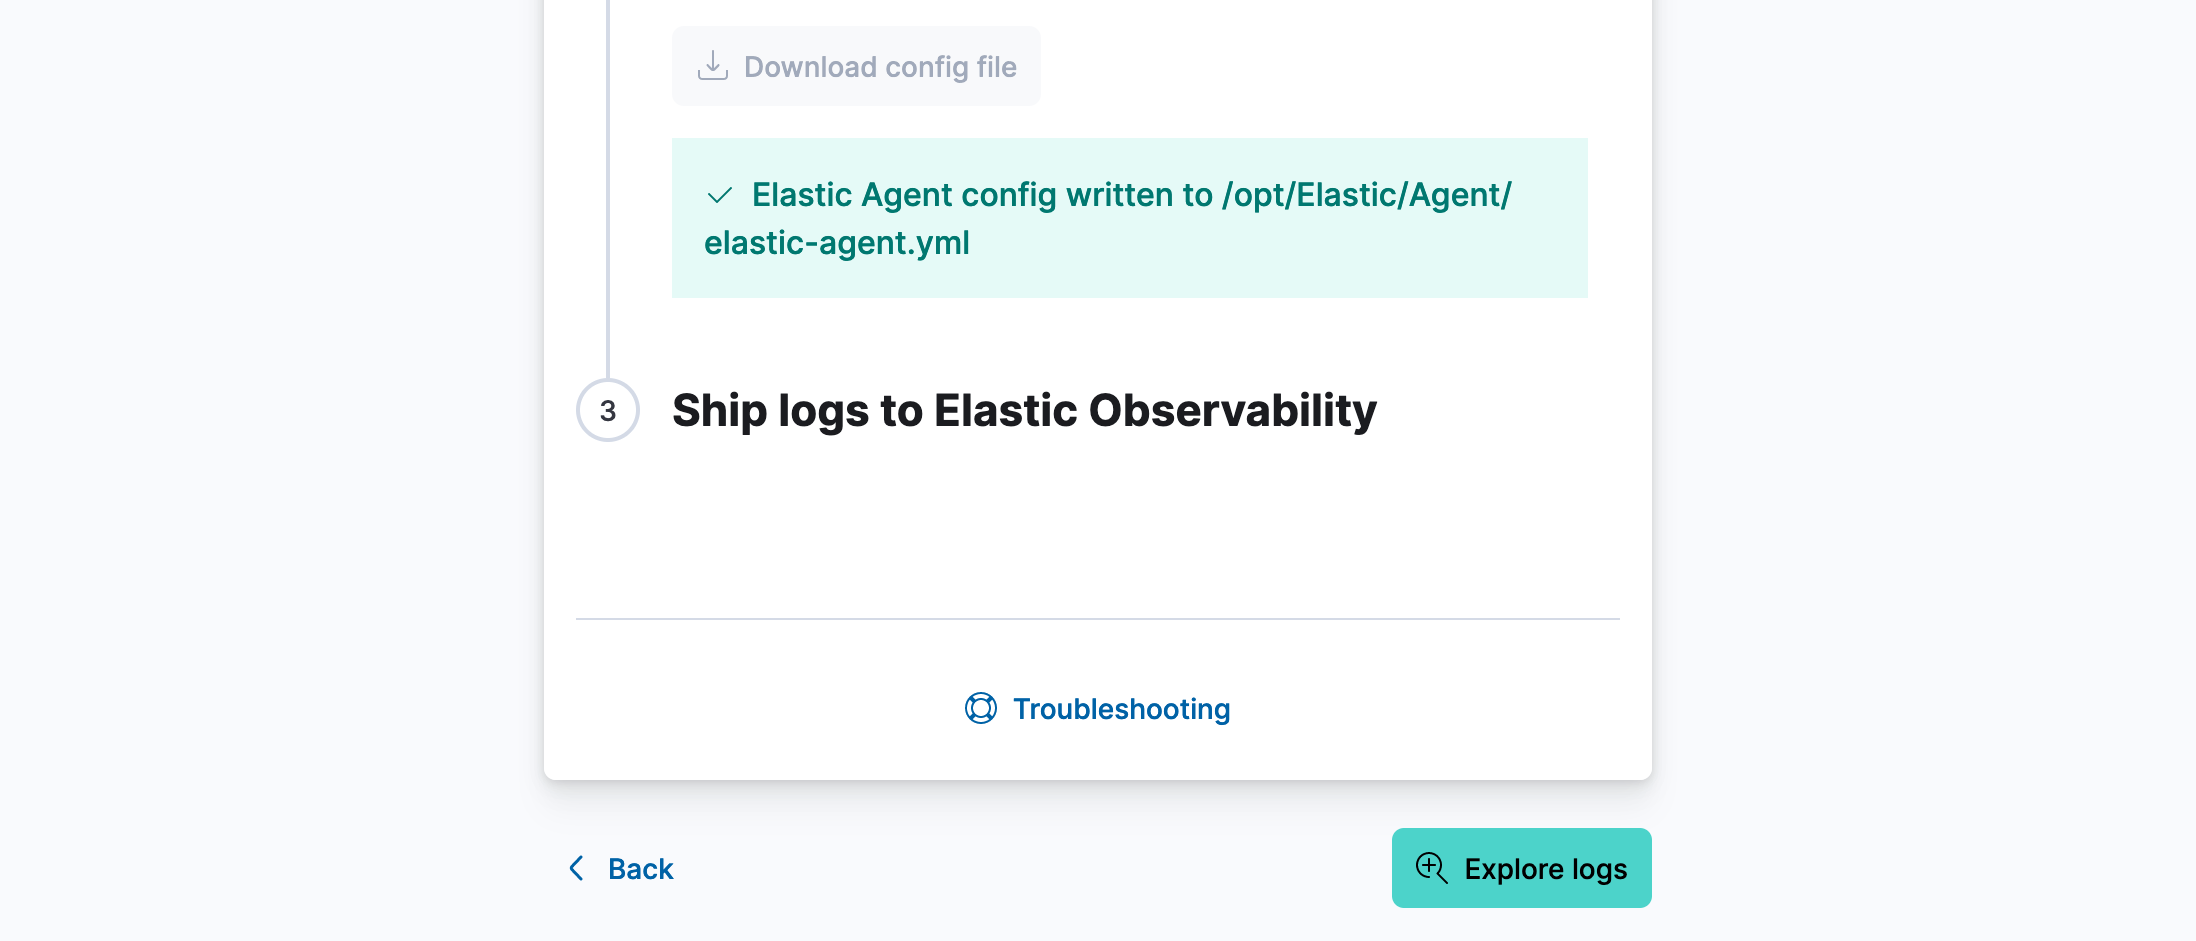
Next you’ll see an indication that the Elastic Agent config has been written to the YAML file. Now select Explore logs.
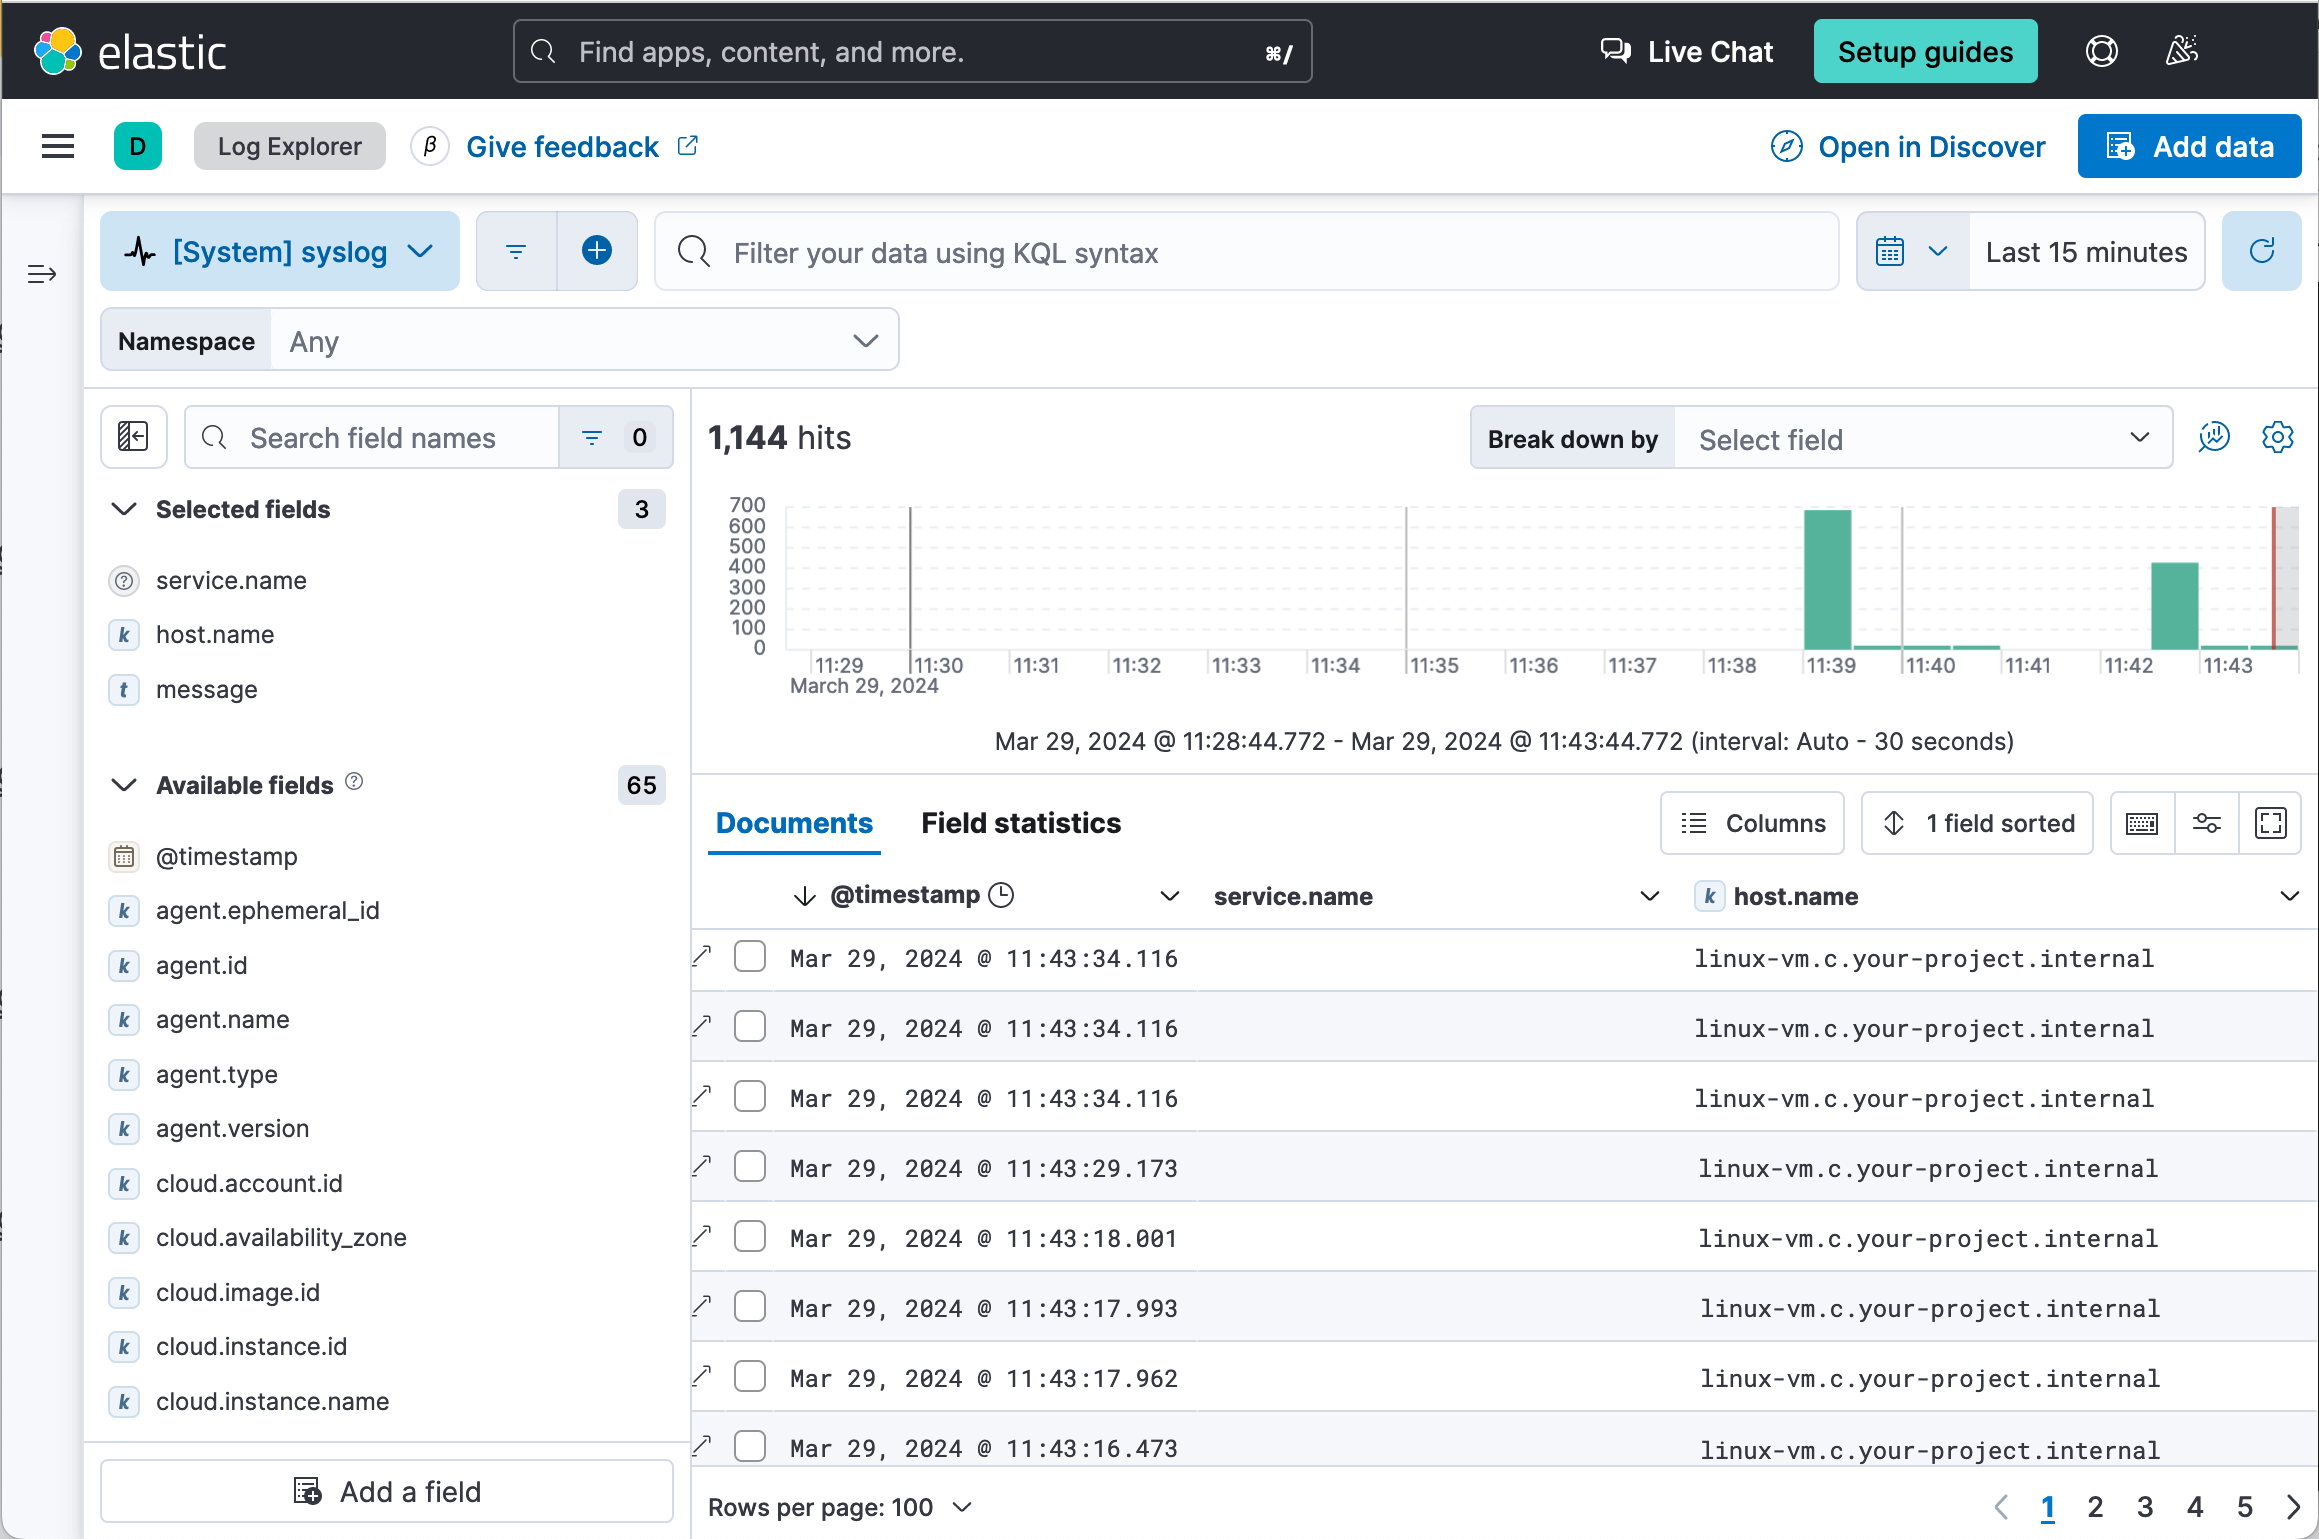
Finally, you’ll be brought to the Logs Explorer dashboard so you can view your logs.
If you get stuck take a look at this guided tour for installing the System integration.
Check out these examples on how to use these integrations:
Working with Elastic Observability
Get more out of your unstructured data
Learn best practices for working with unstructured log data and how to get started. Next, after you’ve ingested your data, it’s time to learn how to give your data more structure to answer even more questions.
Search and manage your logging data with interactive dashboards in Kibana
Logs can provide a record of an event and the time that event occurred, which would then allow you to find errors within your code to troubleshoot issues. Each log is time-stamped and shows an event that happened at a certain point in time.
Kibana allows you to analyze logs with interactive dashboards to derive insights, automate workflows, find anomalies and trends, and more. To learn more about Kibana and creating dashboards check out the video below.
Analysis and machine learning with logging data
Lastly, analyze logs, identify patterns, and detect anomalies with machine learning to get a holistic view across your environment.
Next steps
Thanks for taking the time to collect and analyze logs with Elastic Cloud. If you’re new to Elastic, be sure to spin up a free 14-day trial.
Also, as you begin your journey with Elastic, understand some operational, security, and data components you should manage as a user when you deploy across your environment.
Observability resources
- Explore observability demo gallery
- Get started with monitoring your application performance (APM/tracking)
- Get started with monitoring your hosts
- Get started with monitoring your Kubernetes clusters
- Get started with optimizing workloads with universal profiling
- Get started with creating a synthetic monitor