Adding custom URLs to machine learning results
editAdding custom URLs to machine learning results
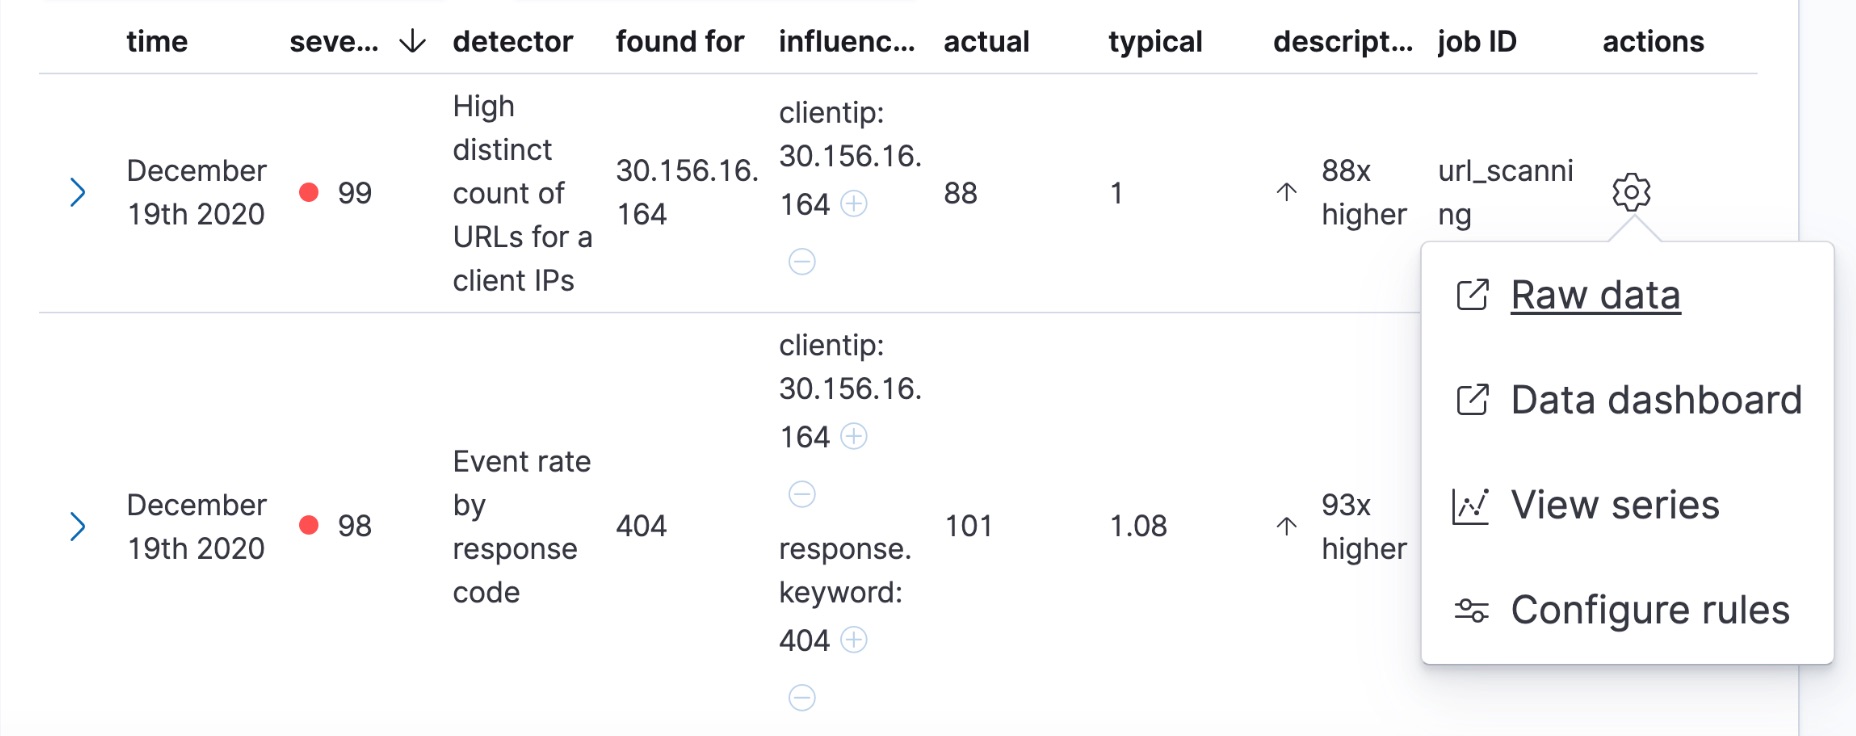
editYou can optionally attach one or more custom URLs to your anomaly detection jobs. These links appear in the anomalies table in the Anomaly Explorer and Single Metric Viewer and can direct you to dashboards, the Discover app, or external websites. For example, you can define a custom URL that provides a way for users to drill down to the source data from the results set:

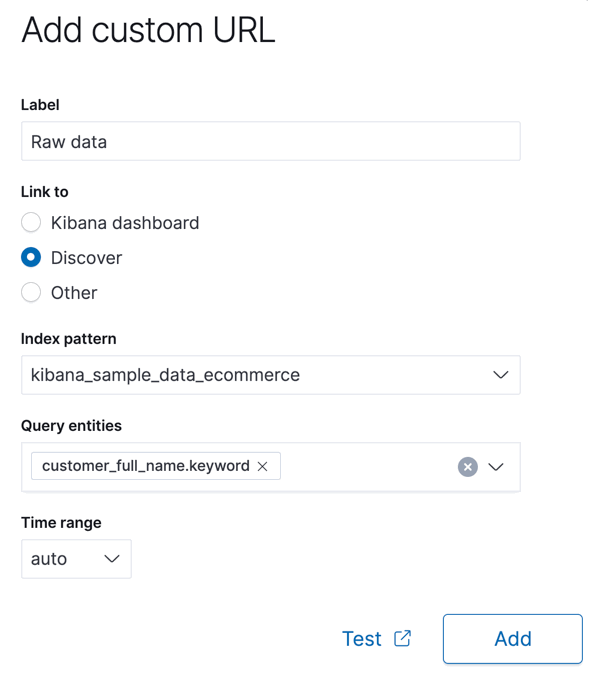
When you create or edit an anomaly detection job in Kibana, it simplifies the creation of the custom URLs for Kibana dashboards and the Discover app and it enables you to test your URLs. For example:

For each custom URL, you must supply the URL and a label, which is the link text that appears in the anomalies table. You can also optionally supply a time range. When you link to Discover or a Kibana dashboard, you’ll have additional options for specifying the pertinent data view or dashboard name and query entities.
String substitution in custom URLs
editYou can use dollar sign ($) delimited tokens in a custom URL. These tokens are
substituted for the values of the corresponding fields in the anomaly records.
For example, the Raw data URL might resolve to discover#/?_g=(time:(from:'$earliest$',mode:absolute,to:'$latest$'))&_a=(index:ff959d40-b880-11e8-a6d9-e546fe2bba5f,query:(language:kuery,query:'customer_full_name.keyword:"$customer_full_name.keyword$"')). In this case, the pertinent value of the customer_full_name.keyword field
is passed to the target page when you click the link.
Not all fields in your source data exist in the anomaly results. If a
field is specified in the detector as the field_name, by_field_name,
over_field_name, or partition_field_name, for example, it can be used in a
custom URL. A field that is used only in the categorization_field_name
property, however, does not exist in the anomaly results. When you create your
custom URL in Kibana, the Query entities option is shown only when there are
appropriate fields in the detectors.
The $earliest$ and $latest$ tokens pass the beginning and end of the time
span of the selected anomaly to the target page. The tokens are substituted with
date-time strings in ISO-8601 format. If you selected an interval of 1 hour for
the anomalies table, these tokens use one hour on either side of the anomaly
time as the earliest and latest times. You can alter this behavior by setting a
time range for the custom URL.
There are also $mlcategoryregex$ and $mlcategoryterms$ tokens, which pertain
to anomaly detection jobs where you are categorizing field values. For more information
about this type of analysis, see Detecting anomalous categories of data. The
$mlcategoryregex$ token passes the regular expression value of the category of
the selected anomaly, as identified by the value of the mlcategory field of
the anomaly record. The $mlcategoryterms$ token passes the terms value of the
category of the selected anomaly. Each categorization term is prefixed by a plus
(+) character, so that when the token is passed to a Kibana dashboard, the
resulting dashboard query seeks a match for all of the terms of the category.
For example, the following API updates a job to add a custom URL that uses
$earliest$, $latest$, and $mlcategoryterms$ tokens:
POST _ml/anomaly_detectors/sample_job/_update
{
  "custom_settings": {
        "custom_urls": [
          {
            "url_name": "test-link1",
            "time_range": "1h",
            "url_value": "discover#/?_g=(time:(from:'$earliest$',mode:quick,to:'$latest$'))&_a=(index:'90943e30-9a47-11e8-b64d-95841ca0b247',query:(language:lucene,query_string:(analyze_wildcard:!t,query:'$mlcategoryterms$')),sort:!(time,desc))"
          }
        ]
      }
}
When you click this custom URL in the anomalies table in Kibana, it opens up the
Discover page and displays source data for the period one hour before and
after the anomaly occurred. Since this job is categorizing log messages, some
$mlcategoryterms$ token values that are passed to the target page in the query
might include +REC +Not +INSERTED +TRAN +Table +hostname +dbserver.acme.com.
- The custom URL links in the anomaly tables use pop-ups. You must configure your web browser so that it does not block pop-up windows or create an exception for your Kibana URL.
- When creating a link to a Kibana dashboard, the URLs for dashboards can be very long. Be careful of typos, end of line characters, and URL encoding. Also ensure you use the appropriate index ID for the target Kibana data view.
- If you use an influencer name for string substitution, keep in mind that it might not always be available in the analysis results and the URL is invalid in those cases. There is not always a statistically significant influencer for each anomaly.
-
The dates substituted for
$earliest$and$latest$tokens are in ISO-8601 format and the target system must understand this format. -
If the job performs an analysis against nested JSON fields, the tokens for
string substitution can refer to these fields using dot notation. For example,
$cpu.total$. - Elasticsearch source data mappings might make it difficult for the query string to work. Test the custom URL before saving the job configuration to check that it works as expected, particularly when using string substitution.