


Elastic Metrics 7.8.0 released
We’re happy to announce the release of Elastic Metrics 7.8.0 — available on Elasticsearch Service, or when you download the Elastic Stack. Debuting in this release are an enhanced Google Cloud integration, new infrastructure alerts, and more!
Monitoring any service in Google Cloud
One of the key features that our cloud integrations provide is the ability to monitor any cloud service that exposes metrics via a cloud API. For Azure, it is the monitor metricset that can pull all metrics supported by the Azure Monitor APIs, and for AWS it’s cloudwatch. The biggest advantage that these integrations provide over other solutions out there is that not only are you in full control of what you need to monitor (down to a metric dimension), there’s also no need to for you to wait for a dedicated integration for the service you want to monitor. As long as this service is supported by a cloud provider’s own API, you’re good to go.
In this release we are excited to extend our support of monitoring any cloud service to Google Cloud operations suite (formerly Stackdriver). The new stackdriver metricset in the Google Cloud module collects any service metrics from Google Cloud using the ListTimeSeries API call. It’s very easy to configure — all you have to do is specify a service you want to monitor and the service metrics that you’re interested in:
metrics:
    - aligner: ALIGN_MEAN
      service: dataflow
      metric_types:
        - "job/element_count"
        - "job/current_num_vcpus"
The full list of metric types that Google Cloud monitoring supports can be found in Google Cloud metrics documentation.
Infrastructure threshold alerts
We continue to improve and simplify the new alerting experience for infrastructure monitoring. This time we’ve added support for resource-centric threshold alerts that can be created directly from your infrastructure inventory. This alert type is focused on the resources currently supported in the Inventory tab. Easily create alerts for a particular resource or an entire group of resources belonging to a certain availability group, namespace, or those that comply with your tagging policy. With the filter setting, you’re in full control of the scope for your alerts.
Just like with more generic metrics thresholds, this alert type also allows you to set multiple thresholds for relevant metrics in the same alert condition, which can be useful for precision alerting.
The new infrastructure threshold alerts are part of the 7.8 release, so take it for a spin and tell us what you think.
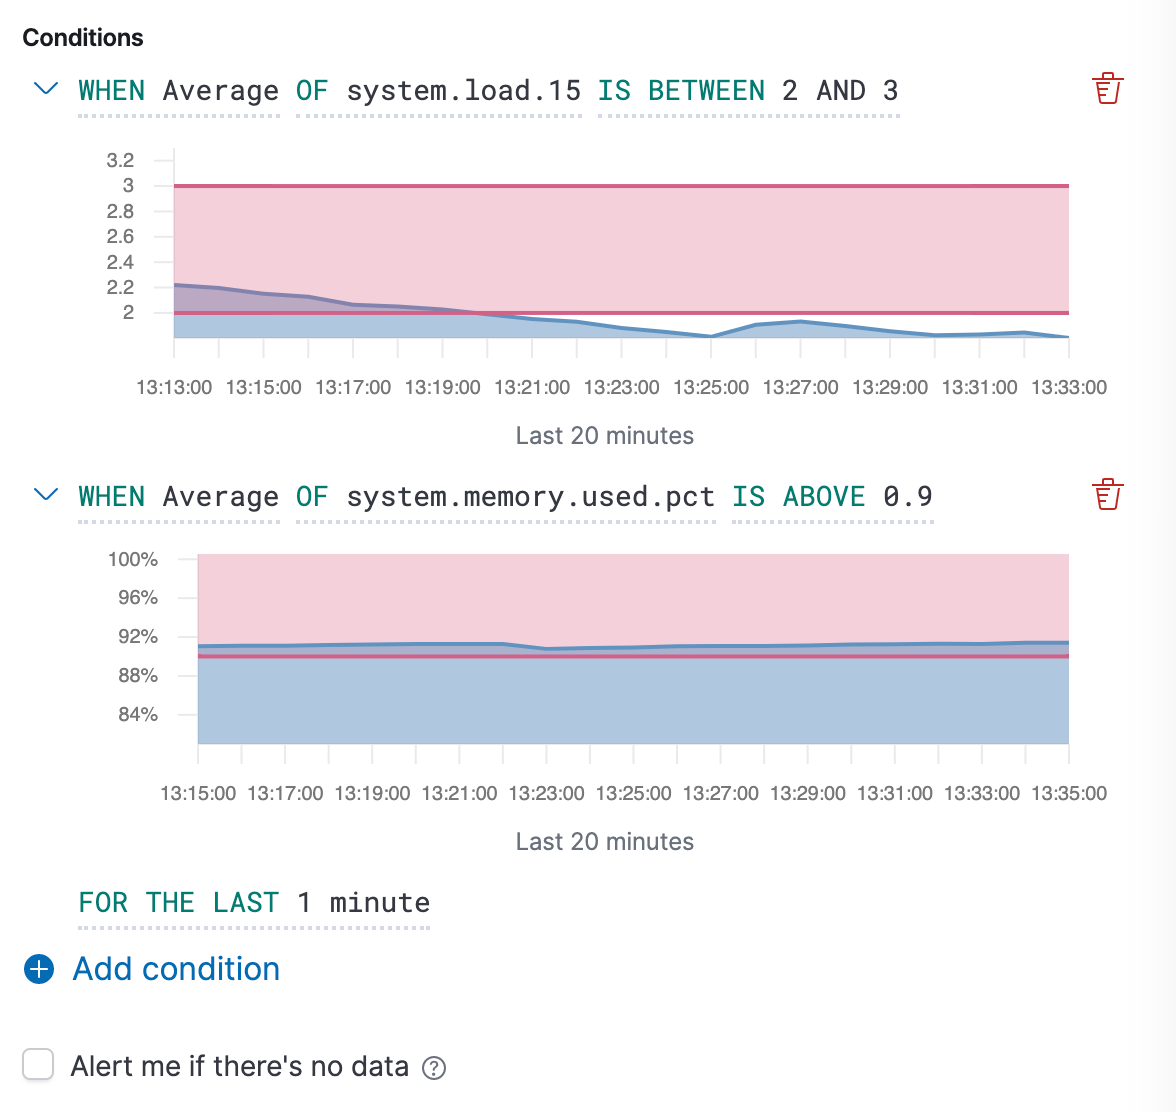
Preview charts for metric thresholds
Sometimes it’s hard to know in advance what threshold to choose for a metric, so visual feedback can really help with choosing the right values. We’re introducing preview charts for thresholds to help users set threshold values that make sense — including an option to get alerted when there is no data when some is expected.
Specialized Linux integration
In this release we’re introducing a new linux module that contains metrics exclusive to the Linux kernel and various subsystems. This is done primarily to avoid cluttering the system module with metricsets that are not broadly cross-compatible. The new linux module currently includes these metricsets:
- pageinfo: collects metrics on the buddy paging algorithm, which can be used to determine memory fragmentation.
- ksm: reports data from Kernel Samepage Merging. In order to take advantage of KSM, applications must use the madvise system call to mark memory regions for merging. KSM is not enabled on all distros, and KSM status is set with the CONFIG_KSM kernel flag.
- conntrack: reports on performance counters for the Linux connection tracking component of netfilter. Conntrack uses a hash table to track the state of network connections.
Try it out now!
You can access the latest version of the Elastic Metrics application on Elasticsearch Service on Elastic Cloud by creating a new cluster, upgrading an existing cluster the day of release, or by downloading the Elastic Stack.