
Elastic Observability
AI-powered observability platform
Unify metrics, logs, traces, and profiling for AI-powered insights built on the ELK Stack — the most widely deployed observability solution.
Use Cases
Open, extensible, full-stack observability built on AI
AIOPs
Context-aware actionable insights with ML and AI
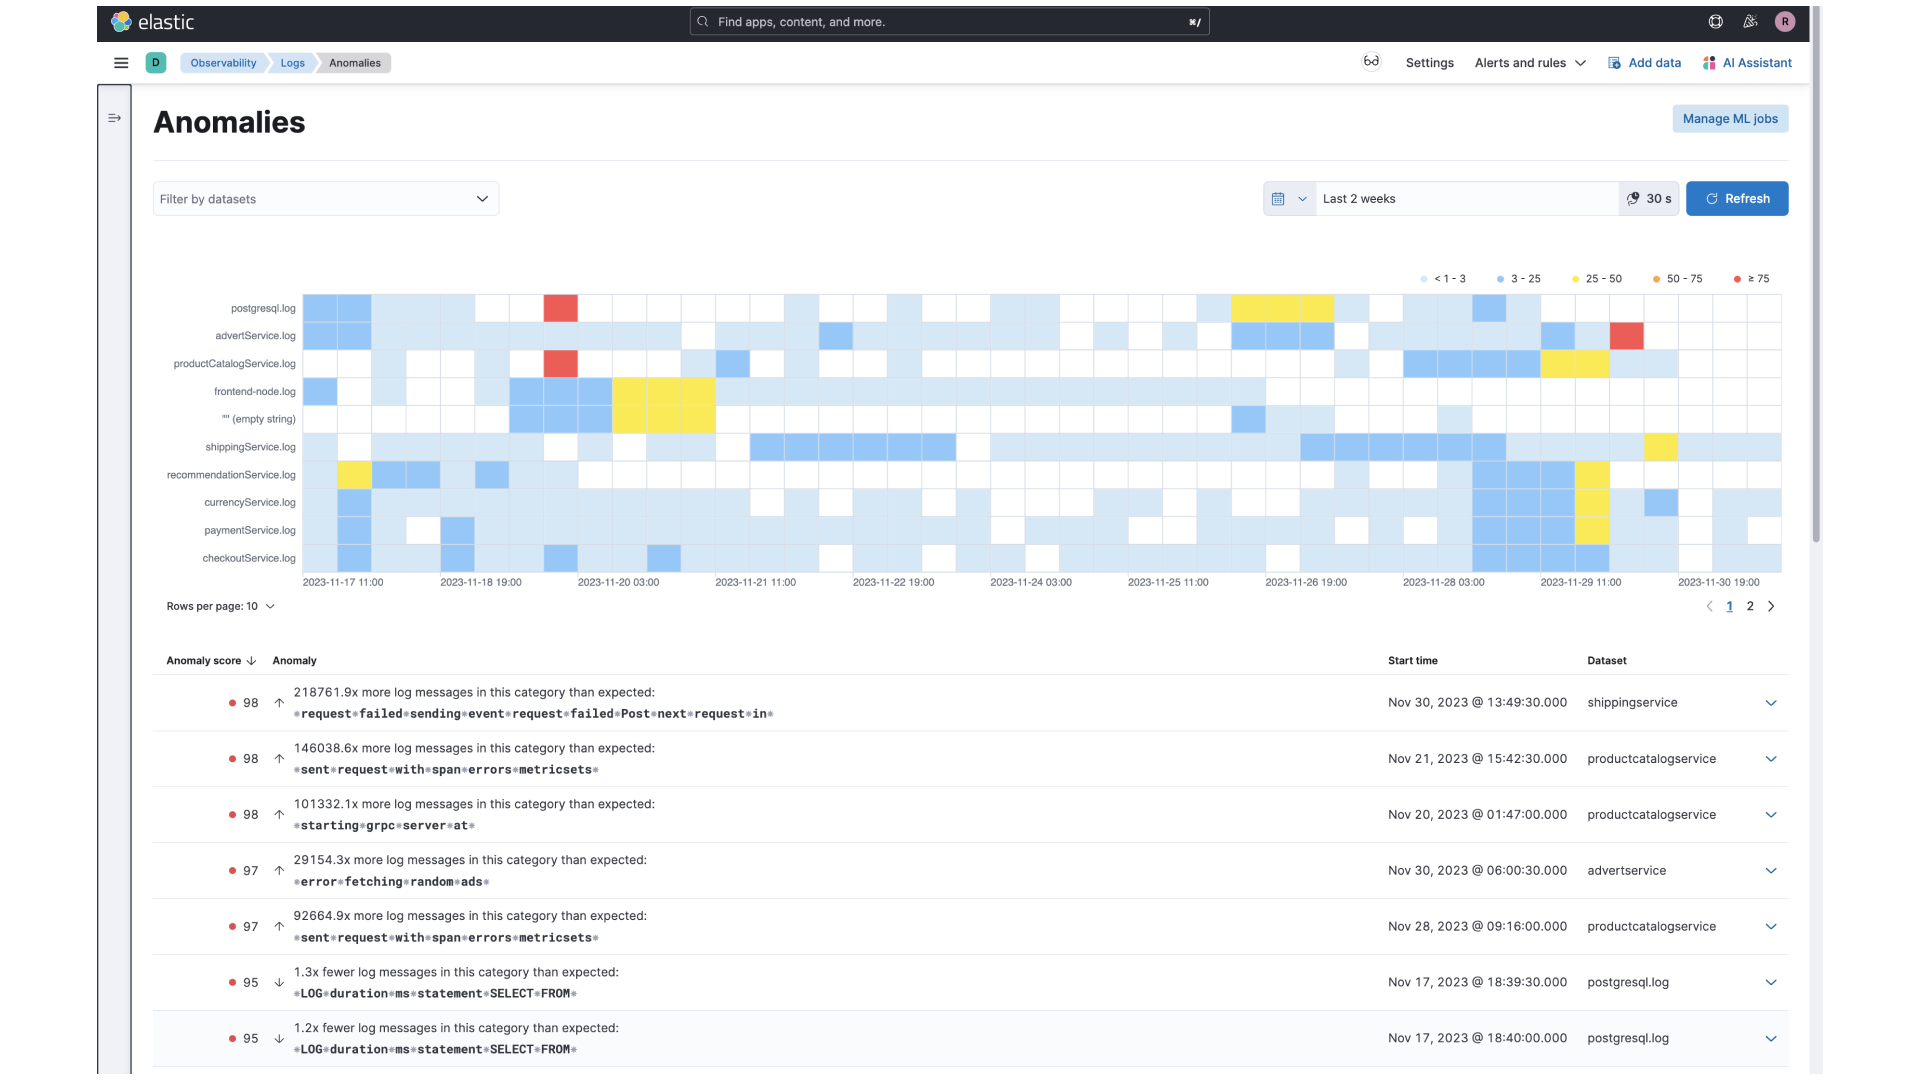
Get AI-powered insightsAutomate anomaly detection and accelerate root cause analysis. Shift from manual data chasing to interactive exploration with generative AI.
Tool consolidation
Reduce tool sprawl for faster problem resolution
Unite teams and toolsUnify observability with 350+ Elastic integrations, including native support for cloud services and open-source projects like OpenTelemetry.
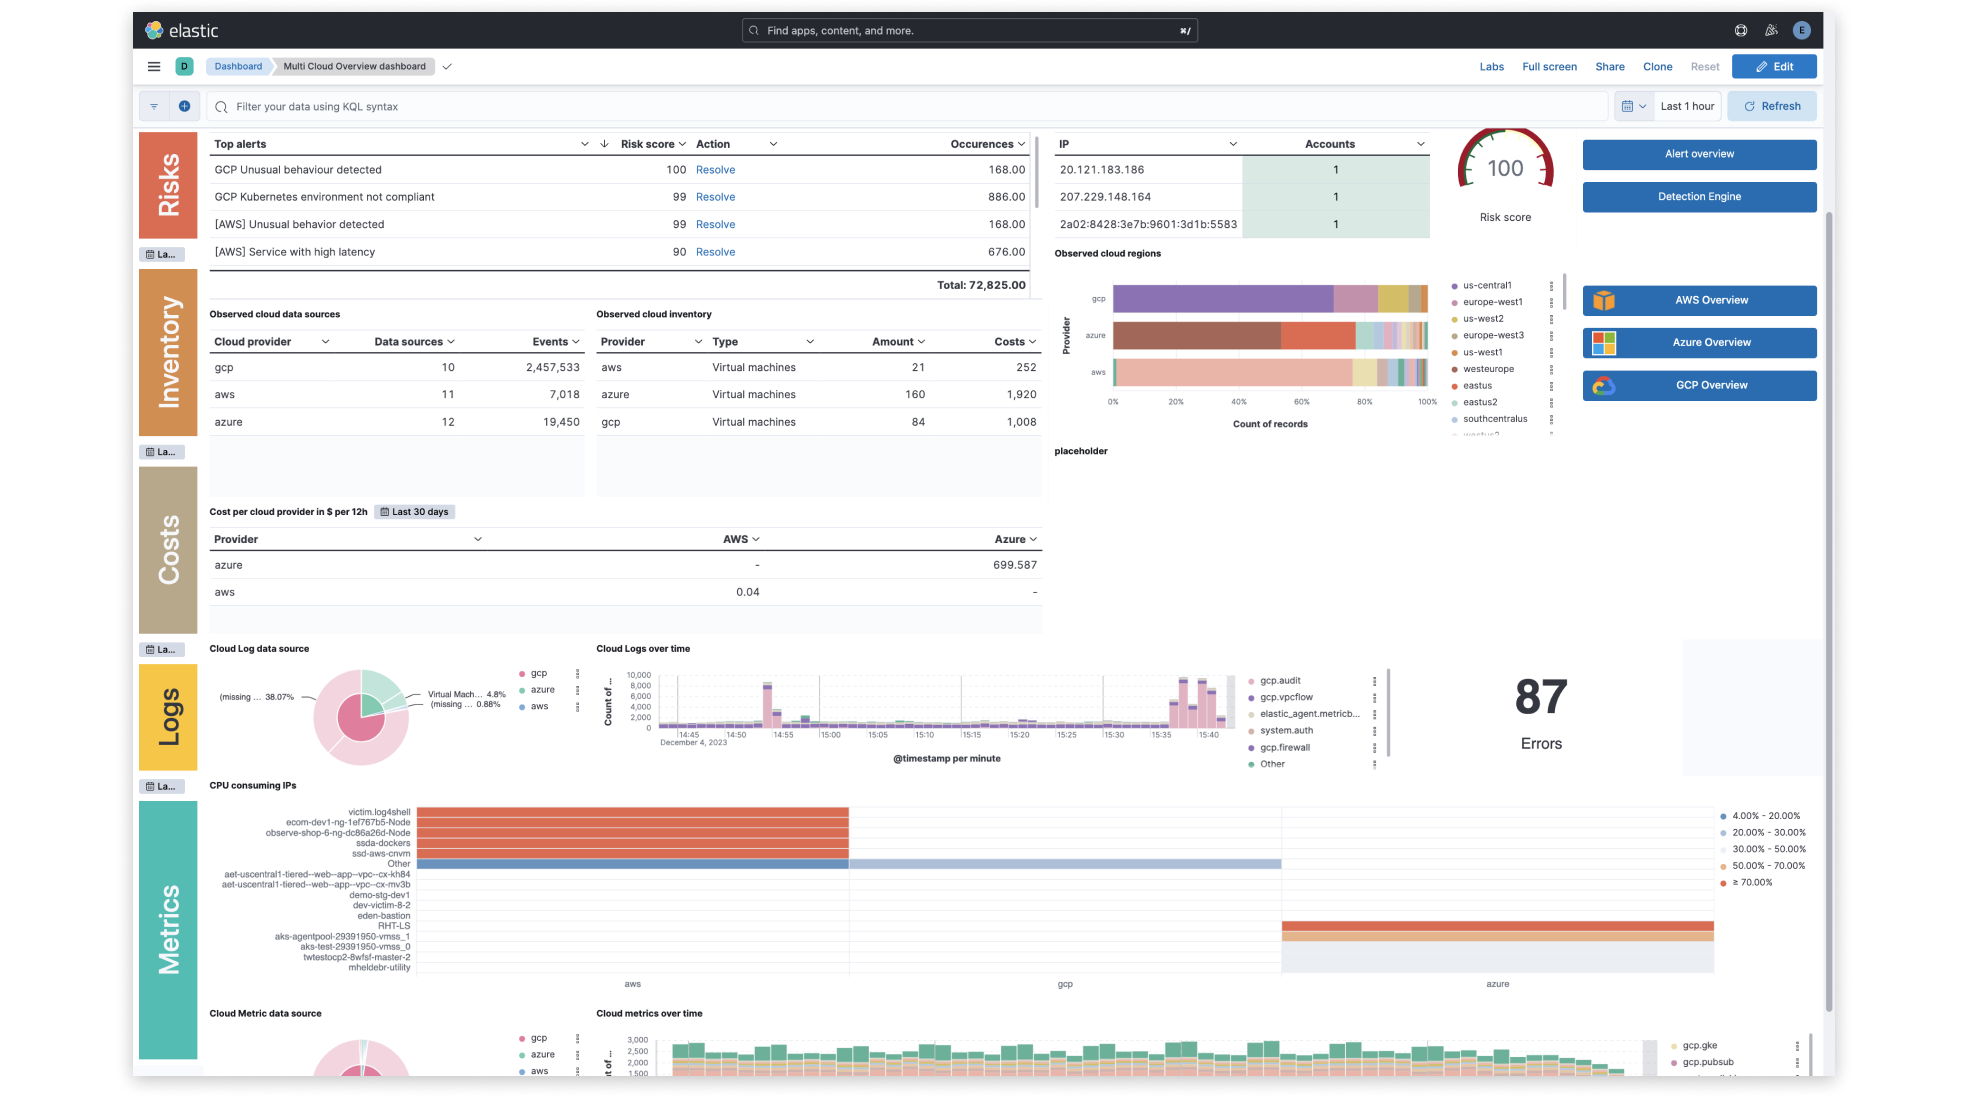
Cloud monitoring
Unify visibility across hybrid and multi-cloud
Monitor all cloudsSeamlessly ingest telemetry across all your applications and infrastructure – wherever they are hosted – for insight into the most complex environments.
Unify visibility with an end-to-end observability solution
CAPABILITIES
One solution. Limitless observability. Smarter insights.
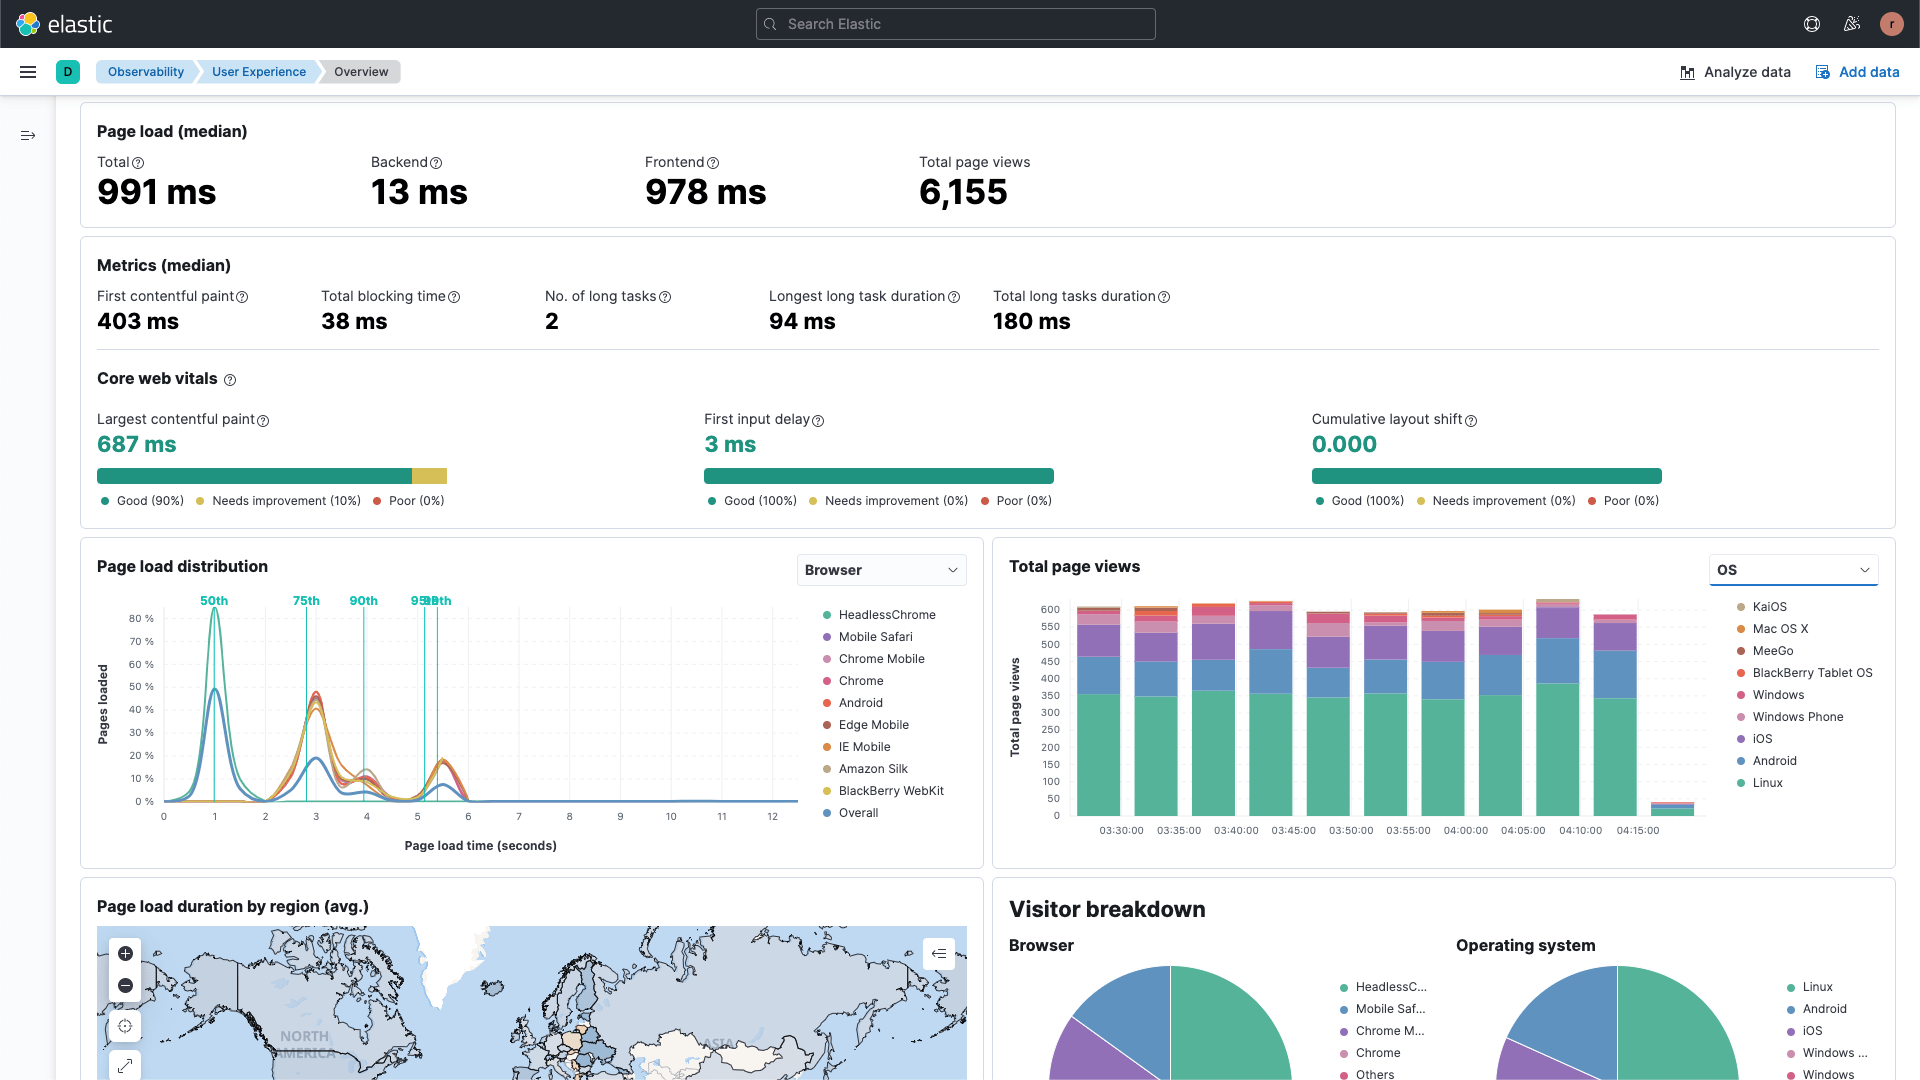
Log monitoring and analytics
Context-aware insights from petabytes of logs
Monitor all your logsGet AI-powered insights in seconds with the leader in log monitoring and analytics. Seamlessly manage structured and unstructured logs at scale.
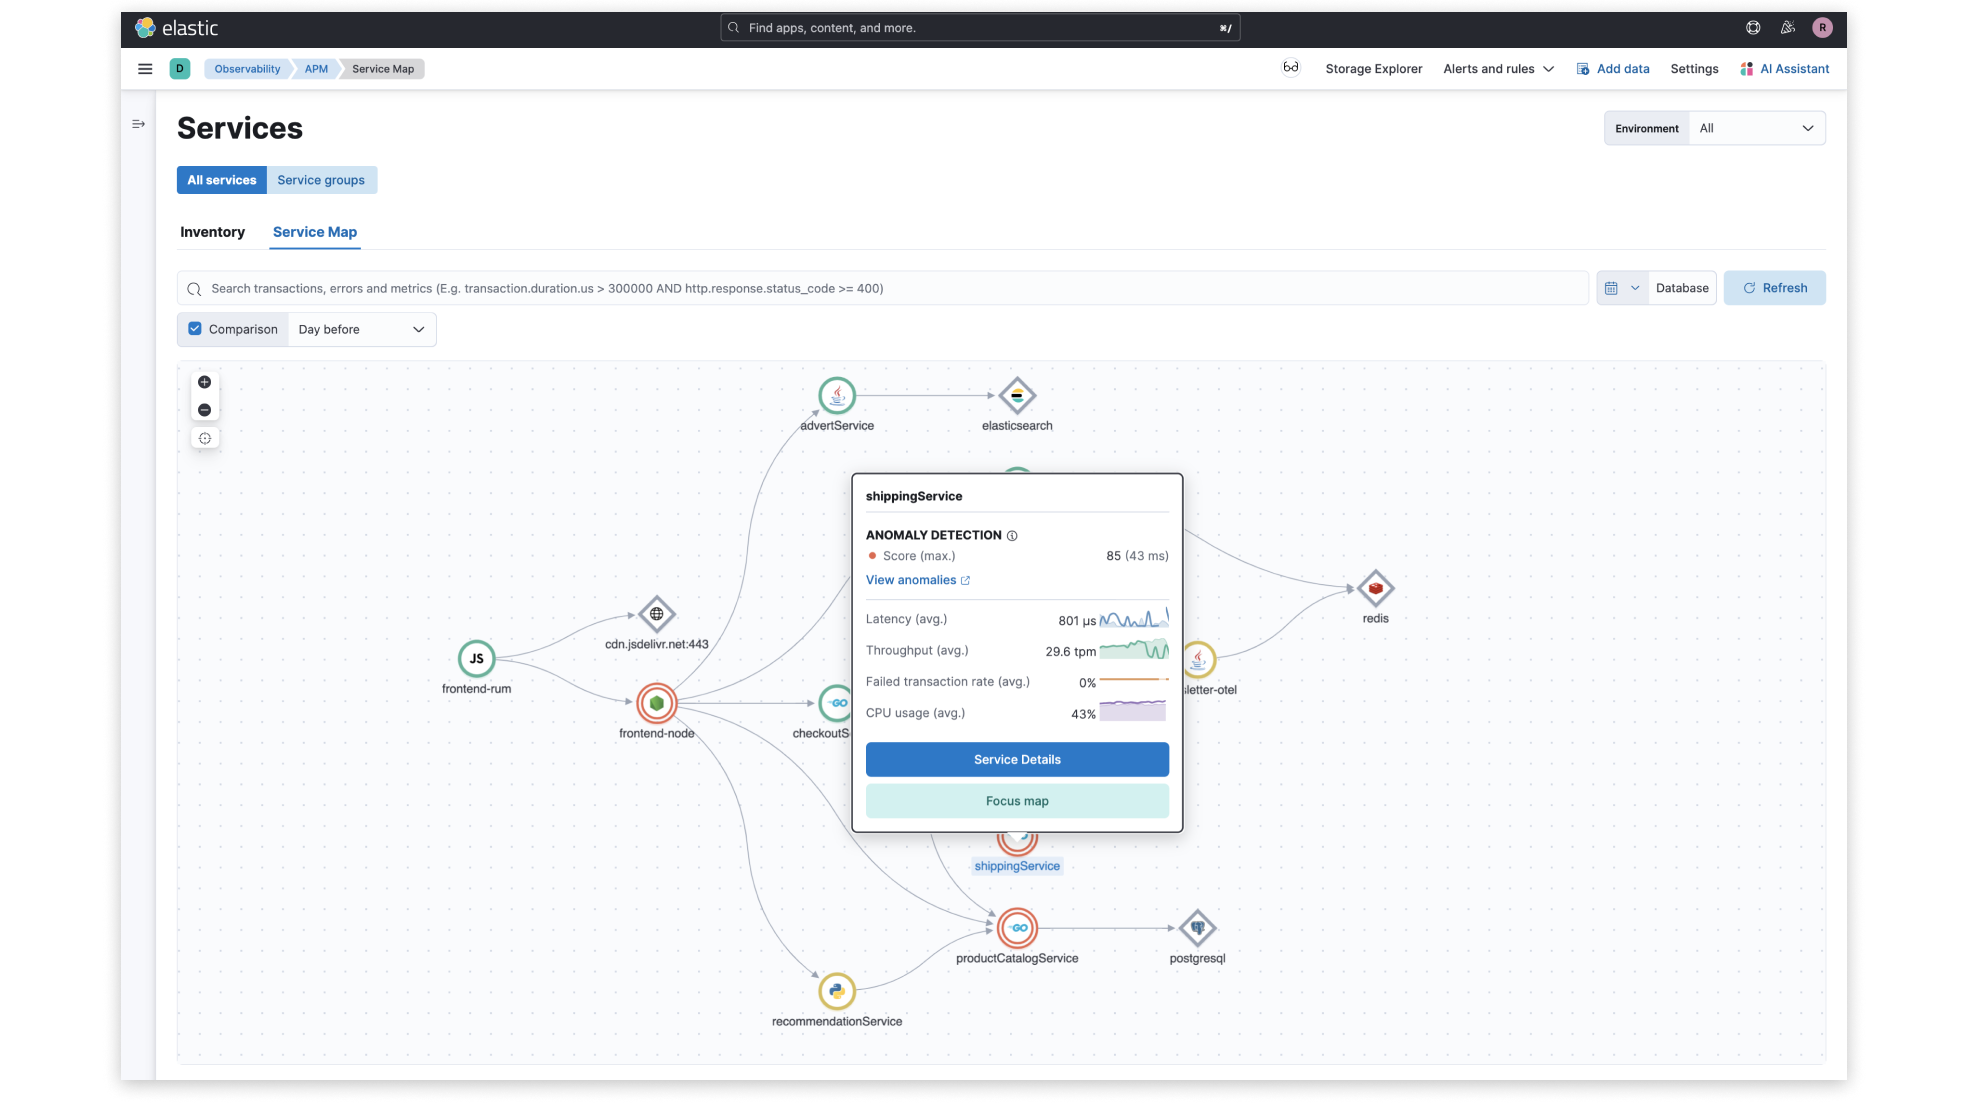
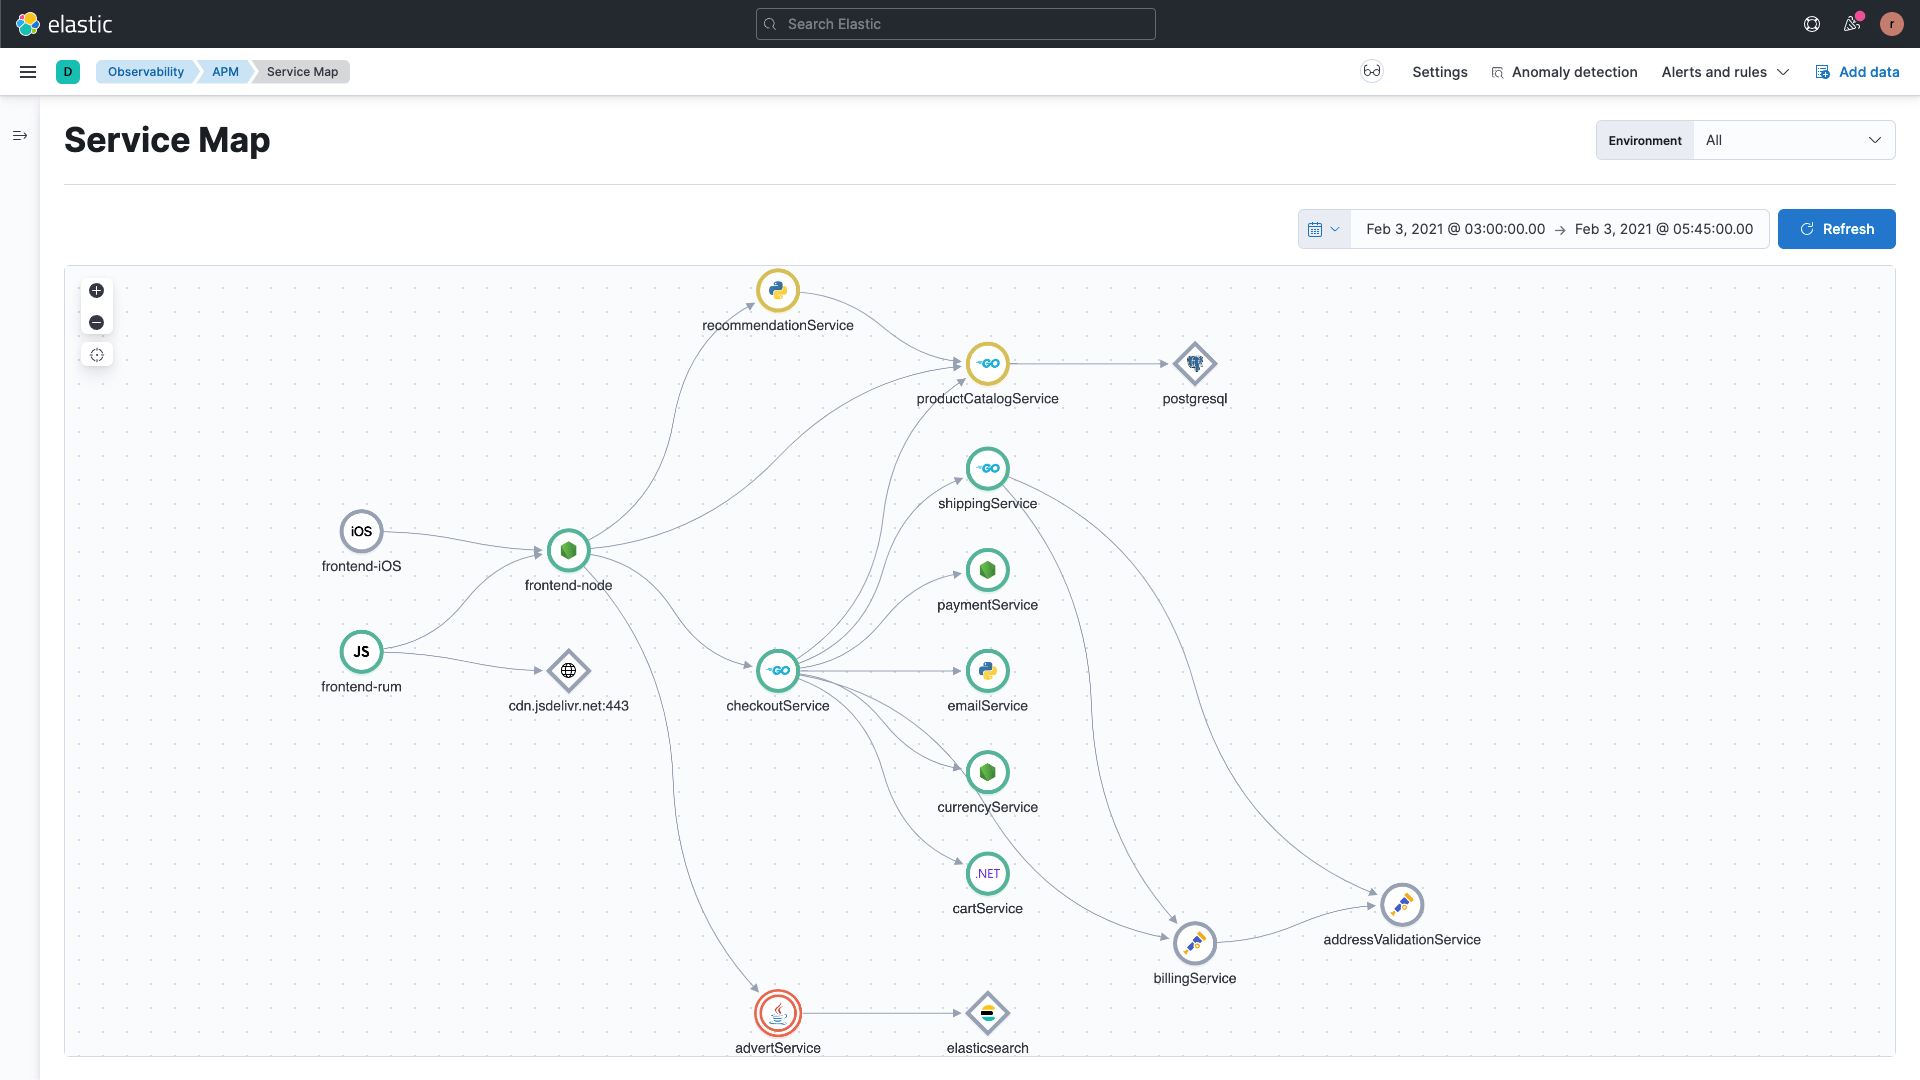
Application Performance Monitoring
Quickly surface and resolve application issues
Dive into APMTroubleshoot transaction errors or latency issues with distributed tracing using Elastic APM agents or native OpenTelemetry integration.
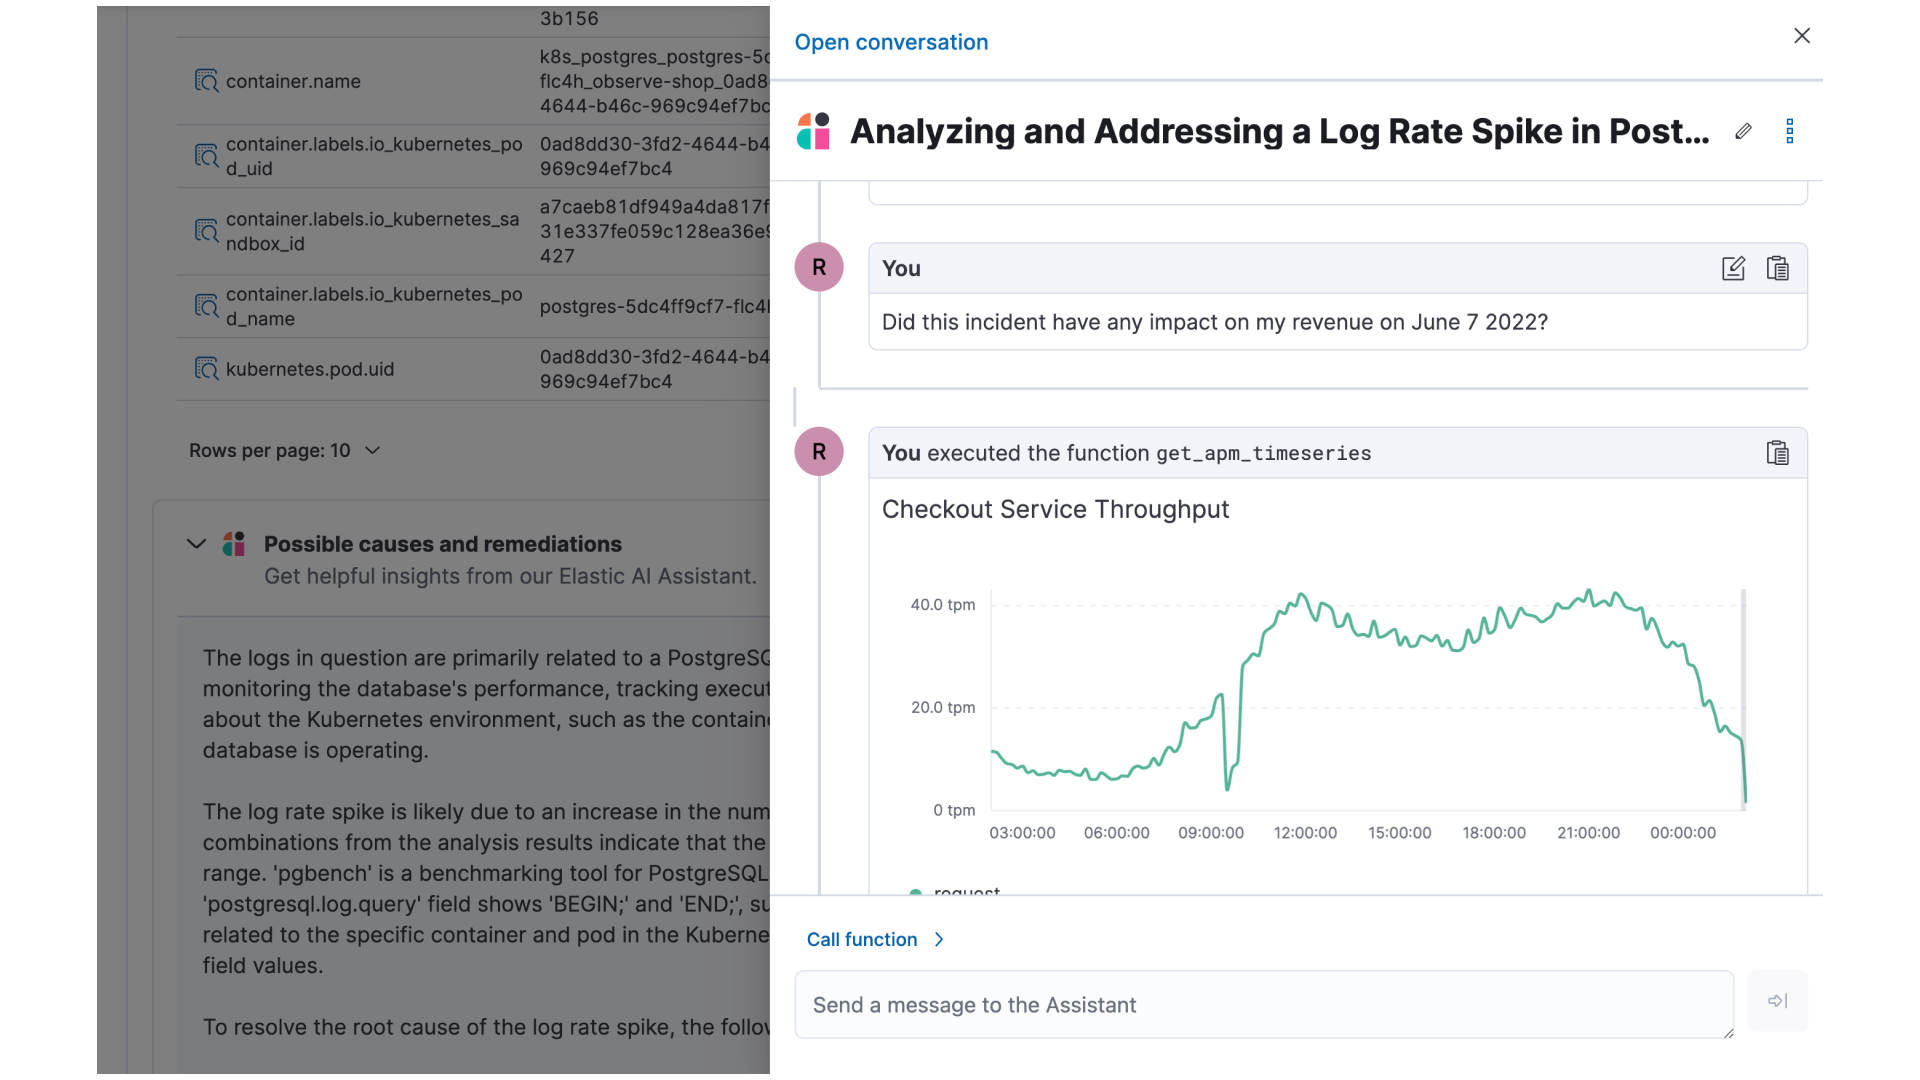
AI Assistant
Empower SREs with generative AI
More about AI AssistantCombine generative AI with anomaly detection and observability for an interactive chat experience based on your proprietary data and runbooks.
Frequently asked questions
What is full-stack observability?
Full-stack observability refers to the ability of an observability solution to monitor the entire application stack — from the end user, to the application code and infrastructure. A full-stack observability solution typically consists of several capabilities including, Log Monitoring and Analytics, Cloud and Infrastructure Monitoring, Application Performance Monitoring, Digital Experience Monitoring, Continuous Profiling, and AIOps. Learn how a full-stack observability solution can help you analyze telemetry holistically with unified visibility and faster mean time to resolution.
What are the benefits of full-stack observability?
Full stack observability enables organizations to achieve business and operational excellence. By implementing full-stack observability, SRE teams break down silos and can proactively detect and resolve issues faster with contextual alerts and effective cross-functional collaboration. Businesses can deliver on SLAs and improve time to market, operational efficiency, and customer satisfaction. Learn more about the benefits of full-stack observability.
Why are businesses switching from Splunk to Elastic Observability?
Businesses everywhere are facing a challenging environment: increased cost pressures coupled with high volumes of data generated by complex, distributed, cloud-native environments. As a result, teams need smarter analytics, with data access, and retention across all their data — instantly and from anywhere — in order to resolve issues, make decisions, and ensure resiliency. Many companies that have adopted Splunk Enterprise have a choice to make, since Splunk offers fragmented observability with Splunk Enterprise, Splunk Cloud, and Splunk Observability with different pricing models. By contrast, Elastic offers a fast, simple, solution that positions companies for the future.
What is the difference between observability and monitoring?
Observability can be thought of as the evolution of monitoring for modern applications. Fundamentally, it is the ability of applications and infrastructure to expose their internal state through actionable logs, published metrics, and distributed traces. As an approach, observability is better suited than traditional monitoring to manage the complexity and scale of cloud-native environments through the collection, transformation, correlation, analysis, and visualization of these signals. Observability continues to evolve with new trends and technologies.
How do you implement observability?
When implementing observability, think in terms of technical and operational readiness. Make sure you have the people and processes in place to support an observability function. Determine the data you want to collect initially. If you are just starting out, we recommend beginning with a single application as a pilot and focusing on one type of signal (e.g., logs) before moving on to metrics and traces. Plan for the future by choosing an observability solution that can grow with you. Ready to begin? See how Elastic’s internal SRE organization has implemented observability at scale.
Discover everything you can do with Elastic