


iPrice Group & the largest e-commerce catalog in Southeast Asia – powered by Elasticsearch
E-commerce is a very young and fragmented space in Southeast Asia (SEA). Unlike the United States, where Amazon is well established as the no. 1 player in online shopping, there are tens of thousands of entrepreneurs fighting for the favor of local shoppers with no clear leader in sight. Moreover, customers in our seven countries that constitute SEA, namely Singapore, Malaysia, Indonesia, Philippines, Thailand, Vietnam, and Hong Kong, have their individual preferences and unique tastes in accordance to their local culture.
Here at iPrice, we set out with the mission to build SEA’s one-stop-shopping destination, aggregating the product catalogs of all these merchants into a single shopping experience for the end user. They wouldn’t have to visit each merchant one-by-one to find the products they are searching for; instead, iPrice categorizes the products and presents them to shoppers in a well-organized and visually-appealing fashion. The idea of product discovery was born, with the goal to make e-commerce more accessible and credible to the booming digital industry in SEA.

Targeting 250 million SKUs to a population of almost 600 million people
At the beginning we had to ask ourselves the all too well-known question, “What technology platform to base iPrice on?” While a traditional SQL approach would have secured us easy access to developer talent, we were concerned about scalability. The two most popular e-commerce stores in SEA were launched just less than five years ago, but we knew that the region was about to experience its internet moment in a similar way to how China did a few years earlier. We were looking for a solution that was simple to set up with a small start-up team while we had little traffic and only a couple of million products, but scaled easily whenever the internet-burst would happen.
From a functional perspective, e-commerce is all about search. Shoppers are trying to find one or two items they want to buy out of a catalog of hundreds of thousands of items. We are not a simple store but an aggregator of all stores—meaning we would have to deal with a scale that is one order of magnitude higher, carrying hundreds of millions of items. Our eyes naturally fell on Elasticsearch, a Lucene-based solution which was already renowned for its full-text search capabilities and had already gathered a decent reputation.
Still undecided if we should stage Elasticsearch with a SQL-based primary data store, we thought through the customer purchasing journey through online portals. We found that customers only want to see the most recent information, meaning if they click on a product and it turns out to be out-of-stock on the merchant’s site, they can’t buy it and we lose a potential lead.
As such, we had to make sure that our product catalog is always up-to-date, while avoiding any additional replication or synchronization of the data which would potentially take a couple of hours.
While product data is the core of what we deal with, we also have to store the navigation structure of our portals, supplemental content that provides shoppers with contextual information about products they are interested in, and last but not least, data about the shoppers’ behavior on the site. Again, the question was whether to add a secondary SQL database or not, but the nature of this kind of data is also not very relational and Elasticsearch was already renowned for holding large amounts of log information. We settled on implementing our own CMS on top of Elasticsearch as our primary data store, going completely NoSQL in our approach, and this has benefited us in the long run.
Importing >630 GB every 24 hours into a cluster with 320 GB of memory
The following diagram illustrates our architecture in a nutshell. At the end of every day, our partners provide us with their latest product catalog in the form of CSV or XML files. After midnight, when it is unlikely that there are any updates to their inventory and the load on Elasticsearch is minimal, we start the import process. It is timed very accurately, to ensure most late night shoppers in SEA have gone to bed and the countries with different time-zones, like Indonesia, have also crossed the ending of the day.
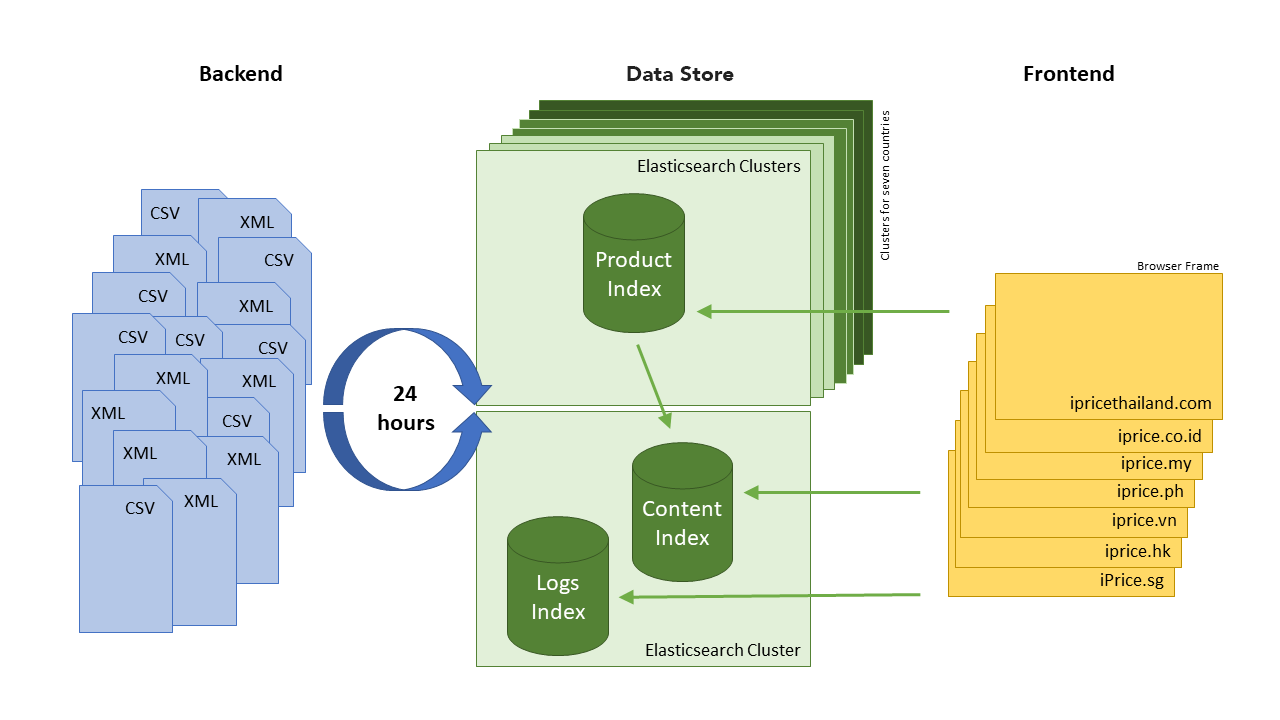
Within two and a half years, our product catalog has grown to 250 million products, and with that, it is quite natural that every day a couple of the feeds error out or provide invalid data. To catch these, we use the powerful aggregation capabilities of Elasticsearch to create reports showing how the new catalog differs from the old one. First thing in the morning, our Ops team looks at the report, and decides which parts of the new catalog are good to go out to our site.
During this phase, our navigation structure is dynamically updated based on the new product catalog and written into another index—the content index. This pre-calculation makes sure that heavy aggregations won’t slow down the site during customer visits, an important learning that we will expound in detail later. At the same time the log data is analyzed and each product gets a new popularity value assigned. This value is used in the frontend for sorting the items, making sure that we show the most relevant ones to our users.
Singapore and Hong Kong are relatively small in terms of their population with a couple of millions, whereas Indonesia’s hundreds of islands account more than 260 million people. Also, their status of development couldn’t be more different, while Singapore is amongst the world’s most modern cities, Indonesia’s capital is known for the world’s worst traffic. We serve a totally different product catalog in each country and had to specifically cater to SEA’s various demographic of online shoppers as well as their different consumer behavior, which affects our frontend performance. We decided to duplicate our index structure for each country, keep light content indices in dedicated cluster, and run each of heavy indices with products on its own cluster. This guarantees that only the required dataset for the individual country has to be loaded into memory for queries, but balances out the load across all nodes in the most efficient way.
What we have learned while building this architecture
Implementation of the first couple versions of our application have been quite minimal. At the same time, the amount of uncompressed data didn't exceed the limit of a few gigabytes. At that time, imports only took a few hours each night and were finished at the beginning of the day. Over time, the amount of data being imported increased more than 10-fold, which influenced the speed of the imports. The time it took was up to 10 hours, and we had to begin exploring possible ways to further optimize the process.
Setup: Cluster configuration
First implementation of our infrastructure was quite simple. We used PAAS such as Qbox and Amazon’s Elasticsearch. This was justified as long as the dataset was within tens of gigabytes. It served us well in quickly setting up an Elasticsearch cluster and scaling it with our growing traffic. It has its limitations though, for example we were not able to tweak cluster settings like queue sizes, thread pools limits, or shard allocation.
Migrating to EC2 self-hosted nodes allowed us to optimize our database to mostly query heavy operations during the day, while running a quick nightly import of our product catalog. At the same time, Elastic was developing new versions at a rapid speed, introducing a lot of performance optimizations, and such setup allows us upgrade as soon as a stable version is released.
Moving further, while performing a set of benchmark tests, we decided to go with multi-cluster setup: running each node as a separate cluster. Scaling up the number of nodes in the clusters did not lead to linear performance increase. Import speed with the one node cluster is ~14,000 documents per second, adding second node to the cluster gives ~20,000 documents per second, a 50% improve approximately. At the same time, such setup allowed us to separate heavy indices with product catalog on a country level. Furthermore, we clearly understood that Elastic Block Storage volumes are not inferior in performance to directly attached instance storage, with its relatively limited size. Provision data volumes with size ~3.3 TB allowed us to get maximum IOPS performance that AWS provides for one general purpose SSD volume. Average disk utilization, during ingesting and heavy aggregations, was below 70%.
It was worth mentioning that our major goal was ingest performance and search. In order to keep our infrastructure fault tolerant, we have developed certain backup and restore policies as well as introduced a caching layer on the frontend.
Import: Bulk API and refresh interval for optimal performance
Next, we started using bulk requests instead of singular index query and set the refresh interval to -1 during import. It reduced overhead of HTTP packages and improved indexing significantly. The exact bulk sizing depends on the average document size and we ran a few tests with different configurations to find the best performing configuration in our case. The basic idea was to measure and optimize the number of documents that are inserted in one bulk and the simultaneously running threads. We made measurements with bulk sizes in the range of 100–25,000 documents and number of threads ranging from 10-1,100.
In our particular case, with average document size between ~3-5 KB and one m4.4xlarge node per cluster each having 16 cores, the optimal configuration is 70 simultaneously running threads with bulk size equal to 7,000 documents. This might sound very big—it’s about 75 MB per request—but since both our clusters and backend are located in the same AWS datacenter, the network bandwidth was not an issue. If you set the number of simultaneously running threads and bulk size too high though, the cluster nodes are unable to process data in its queue and requests will be rejected. Import time could be decreased by a factor of five this way. Import application runs on c4.8 large sized instance with 36 CPU cores and 60 GB of memory.
Update: Scan/Scroll and Partial Update to minimize data transfer
Our use case involves post processing of data after it has been imported. Roughly speaking, we have to update, remove or insert documents, applying a set of rules and index it with supplemental content. Here we benefited from partial update that can be used together with bulk API. Since documents in Elasticsearch are immutable, the update API follows a "retrieve-change-reindex" process. With partial update, we can specify only the fields of the document that should be updated. Merging process happens within each shard, avoiding unnecessary data transfer. The equivalent of bulk for getting data is the "scan & scroll” API, which makes sure that data is held in memory and doesn’t have to be requeried while retrieving it in multiple chunks. Again, only the required fields should be retrieved using source filtering. All this helped us to solve issues with slow post-processing of the imported data.
Rotation: Switching indices daily using aliases with zero downtime
Since we are serving seven different countries, with an import running on a nightly basis, we create one new index per country in every cluster. Using one index per day makes sure that only the current version has to be held in memory by Elasticsearch and does not affect query performance. In order to release the freshest data set in each country, every day we use aliases which give us the flexibility to allow us to:
- Have zero downtime and instant switching between indices
- Partially updated data set for individual indices (in our case, individual countries).
We don't have to update anything on our frontend to use the new index name, aliases take care of all of this.
Queries: Caching and query optimization to reduce CPU usage
Over time, as our website offers more functionality, our queries and aggregations became heavier and the response time of some queries has increased dramatically as well as the node’s CPU usage. On one hand, deep investigation showed that we did not use filter cache efficiently, on the other hand some queries were just not well optimized.
In order to improve them, we split queries that retrieved actual hits from aggregations. Permanent aggregation parts get cached when a dynamic query that retrieves actual documents (hits) does not get cached. We still issue both together using the “msearch” API to avoid additional trips between our frontend and the database. You can quickly overlook that you have to manually enable the shard cache for each of your indexes. Keep in mind that the cache key is the complete json query, so if you change a small part, let’s say only the indenting, it will have to re-run the complete query again.
We then got rid of exclude or include statements in aggregations. Filtering data in query helps to aggregate less data, which has a severe impact on performance. Next, we noticed that running aggregation on analyzed data field slows down response time significantly due to an explosion of possible terms. As an example, we used the path hierarchy analyzer for some document's fields. With more and more documents, the time aggregation queries on analyzed data field took increased up to 800 ms. Obviously, performance of certain pages went down. In order to address this, we defined raw fields in addition to the analyzed fields and run aggregation on them if possible. When timed, the duration required for aggregation was around 30-40 ms.
Future improvements and optimizations on the way to 1 billion products
So far, we have only scratched the surface of Elasticsearch’s capabilities and we have plenty of ideas to further exploit its full potential. Here is short excerpt of the projects we have on our backlog to give you an idea of the possibilities with Elasticsearch:
- Further improvement of ingesting performance: Despite that fact that adding nodes to each cluster does not increase performance linearly, we are still able to scale up. In case we need greater disk I/O performance than a single EBS volume, it is still possible to stripe multiple volumes together in RAID0 array.
- Leverage Kibana to analyze import statistics and logs: Log management is a commonly showcased scenario in the combination of Elasticsearch, Kibana, and Logstash applications, which is also referred to as the ELK/Elastic Stack. While we use it to centralize the logs from our applications, we are planning to use it to analyze our nightly product import. With thousands of data feeds from different e-commerce merchants, there are errors every day. So far, our DevOps team is manually parsing the information, brokering it to the stakeholders and taking action based on their decisions. This usually involves a lot of back-and-forth as questions get detailed and delay the process of releasing a new catalog. By using Kibana, we will be able to move this process completely into the stakeholders’ hand and speed it up significantly.
- Use Elasticsearch as our data warehouse, aggregating other sources: At the moment, we have a variety of different data stores that hold information about the end-to-end journey of our website’s consumer, browsing through it to actually performing a purchase. Customers usually start with a search on Google, which is covered by the Google Search Console, visit different pages on our site, recorded by Google Analytics, click out to one of our partners, stored in Elasticsearch directly and then complete a purchase, which is tracked by a variety of affiliate networks. Optimizing each of these steps is critical to our customer satisfaction and in order to analyze it, we are planning to aggregate it in Elasticsearch and leverage the insights to display the most relevant information in each step of the user’s journey.
Based on our experience, we are confident to say that Elasticsearch is the technology of choice to implement in these scenarios. There are always stumbling blocks along the road and we are planning to share our experience about implementing these scenarios in subsequent blog posts, so that you don’t have to stumble over them yourself. Stay tuned.
About the Authors

Heinrich Wendel is the co-founder & CTO of iPrice Group Sdn Bhd. After working for Microsoft for four years, Heinrich left his position as a Product Manager for Visual Studio in Seattle and moved to Malaysia in 2014 to in initiate iPrice. With an affinity to bridge user experience and technology, he aims to make iPrice a leader in Southeast Asia's young e-commerce ecosystem. Combining NLT and a data-driven approach with visual discovery, iPrice strives to provide customers the most relevant products and coupons amongst the plethora of products on the internet

Anton Bormotov is the lead DevOps Engineer at iPrice Group Sdn Bhd. He has been a part of iPrice since its inception in 2014. Anton is passionate about system architecture, overcoming challenges, and has an extremely strong affinity for automation and system software development
About iPrice Group
iPrice Group is a meta-search website where consumers can easily compare prices, specs and discover products with hundreds of local and regional merchants. iPrice’s meta-search platform is available in six other countries across Southeast Asia namely in; Singapore, Malaysia, Indonesia, Philippines, Thailand, Vietnam and Hong Kong. Currently, iPrice compares and catalogues more than 200 million products and receives more than five million monthly visits across the region.
iPrice currently operates three business lines: price comparison for electronics and health & beauty; product discovery for fashion and home & living; and coupons across all verticals.