


From Tableau to Elastic: How Samtec Streamlined Business Intelligence & Analytics
Let’s get this out of the way: we’re not the typical Elastic users. While most use Elasticsearch for logging, security, or search; we use Kibana and Elasticsearch for business intelligence across our enterprise from sales to manufacturing. Also, we have applications using Elasticsearch as a primary data store, and our “production” cluster is often running pre-releases to take advantage of the newest functionality. That being so, our origin with Elastic is likely the same as yours — it all started with needing a place to dump a whole bunch of logs.
Samtec builds electrical interconnects found in products ranging from medical devices, servers to self-driving cars. Our group — Smart Platform Group — was born from an area of Samtec that builds high-speed copper and optical interconnects. Samtec’s FireFly™ family of interconnects are a great example. They have 192 Gbps of bandwidth packed onto a device the size of a dime.
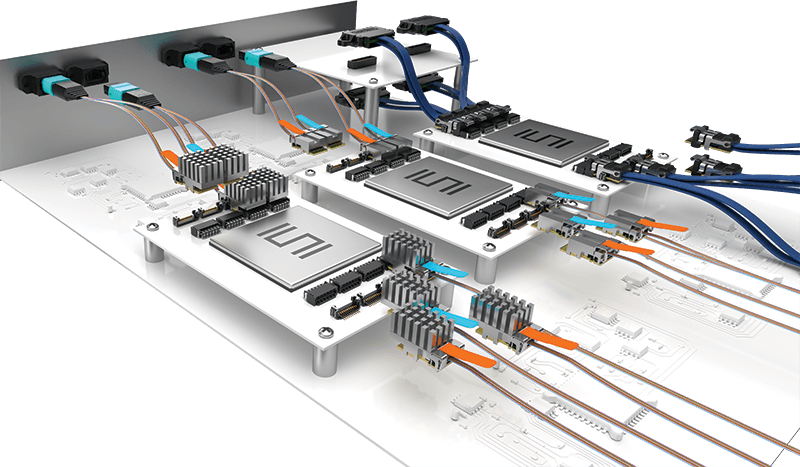
The process to manufacture Firefly™ requires hundreds of steps. Almost every step gets performed by equipment that produces logs containing volumes of data. For example, one step of the process is to place silicon die onto a printed circuit board. The placement gets measured in microns (1/1000th of a millimeter), and the machine that does the placement holds onto each die with a small amount of vacuum pressure. That pressure gets logged for every placement. Those logs look something like this:
"die_count_x" => "integer"
"die_count_y" => "integer"
"commanded_pick_force" => "float"
"actual_pick_force" => "float"
"commanded_place_force" => "float"
"actual_place_force" => "float
We needed to start with capturing the data that would be lost over time as the machines rotated their logs. Logstash, and by extension Elasticsearch, were determined to be the quickest and most cost-effective solution, requiring the least development and maintenance effort. So we wrote some Logstash configs and started dumping data into Elasticsearch. It may not have been pretty, but it worked and we more-or-less forgot about it. That was late 2015.
Three months went by, then six, then a year — and the data was never touched. Finally, one fateful day a customer request came in with an early device failure “in the field”. We needed to look back to when that customer’s order was running on a specific machine to see if everything looked normal in the production process.
Cue our first Kibana visualization, a simple line chart showing the force used to pick up that small silico die. We knew the build date of the device, so we filtered our chart by date and got something similar to the below.
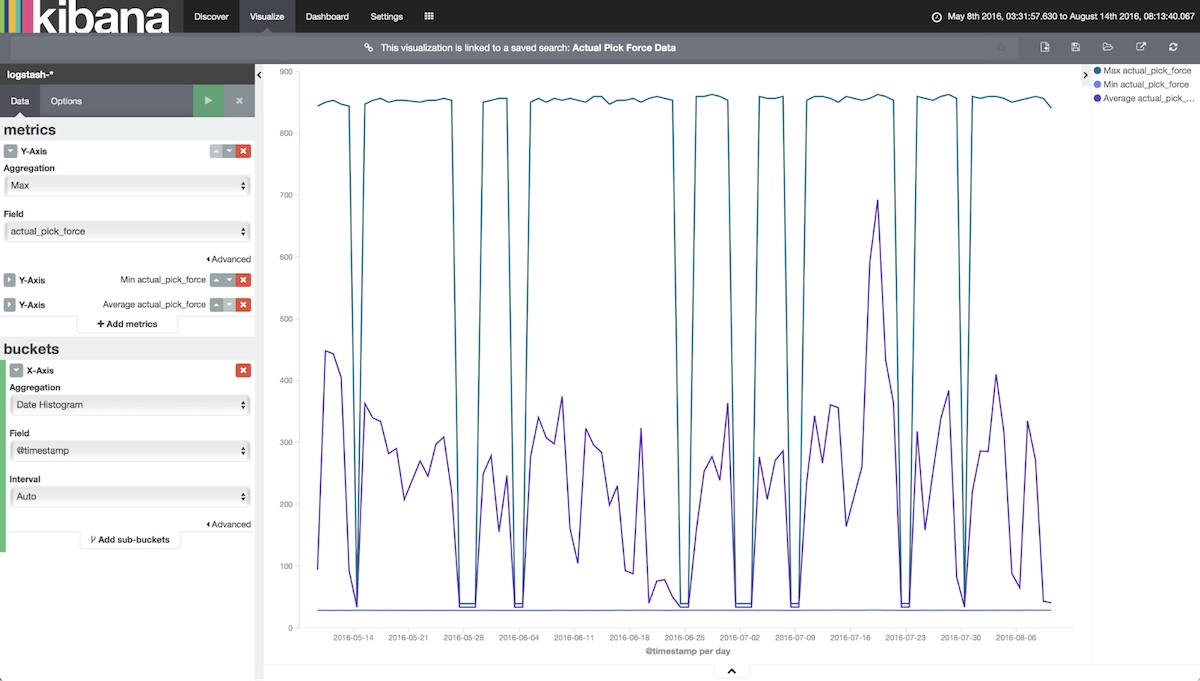
Each dip in the top line represents a period where the force seems to have dropped suspiciously low. Naturally, we had lots of questions, but the most pressing was: did the device in question get built during one of those periodic dips? The exact times each order and piece got ran was stored in our SQL database, and we needed to bring the two pieces of data together. Each machine had a vastly different data structure, and the logistics of moving them all into SQL seemed problematic. However, moving tabular SQL data into Elasticsearch was a well-documented path with Logstash. So we wrote another Logstash config to bring in the SQL data and leveraged some Kibana-fu to overlay orders and serial numbers onto some time series charts.
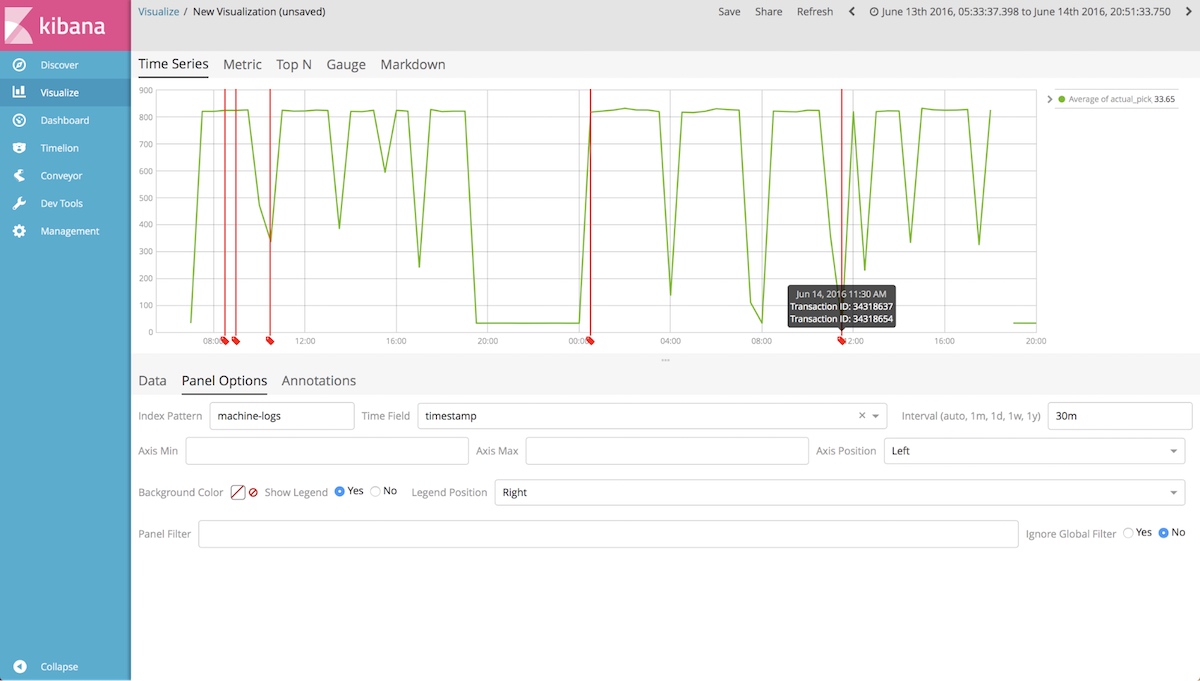
Given the above, it looked like there were a couple of transactions that occurred during a time of “low pick force”. We were going to have to review those in more depth.
What started as one or two Logstash configs was threatening to turn into hundreds as the number of data sources we wanted to pull into Elasticsearch grew. Rather than continue to spend developer time creating Logstash configs, a product idea was born focused on making Elasticsearch data imports more accessible. Moreover, we wanted to enable self-service Business Intelligence using the Elastic Stack.
Enter Conveyor
Conveyor is an open source plugin that we wrote with data analysts and business users in mind. We wanted a graphical, interactive way for loading data into Elasticsearch. We wanted it to be easily extended to support different data sources, and we wanted it to integrate well into the Elastic Stack.
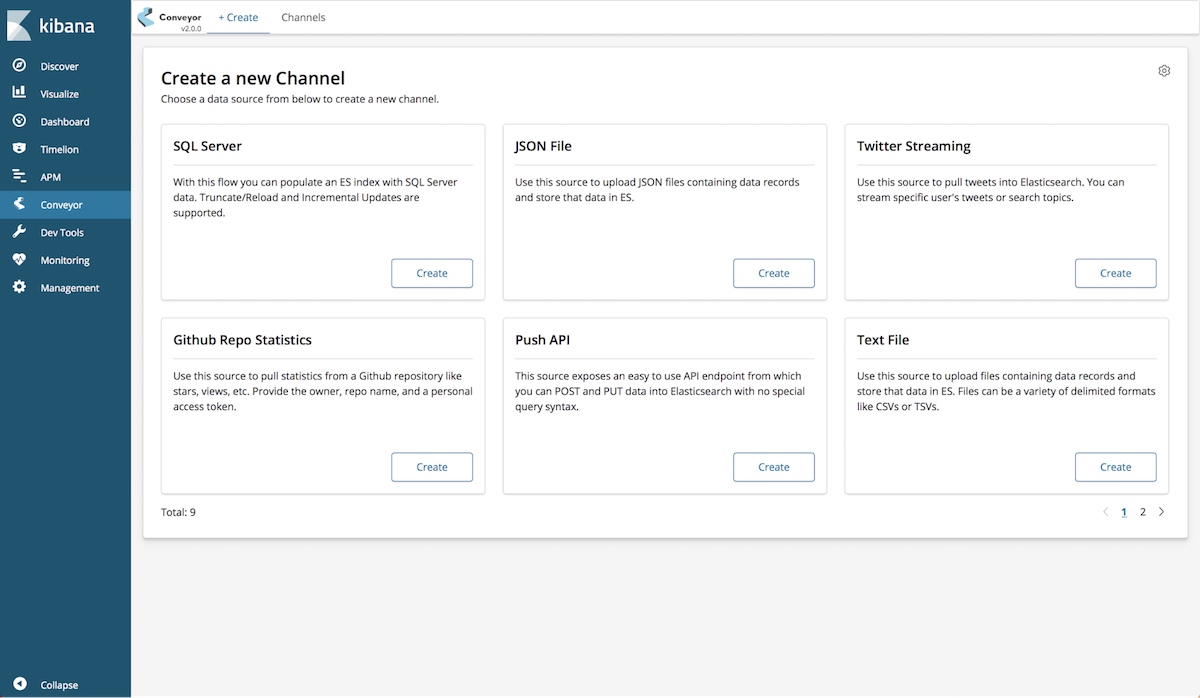
So now that any data is just a few buttons away from being in Elastic, what kind of possibilities are within an easy reach?
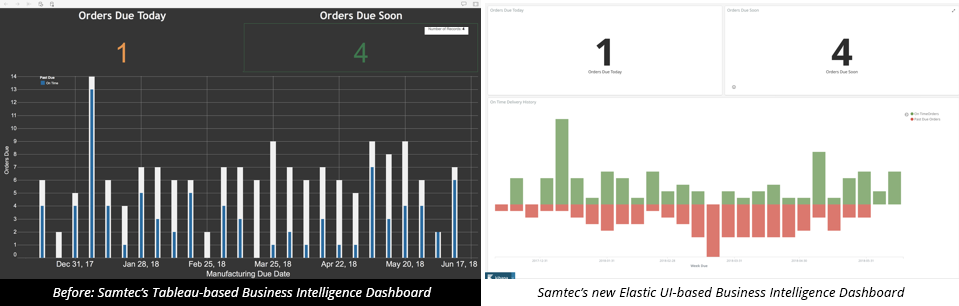
We’ve replaced our Tableau Dashboards with Kibana ones. In this case a heads-up display for showing order status in a manufacturing center. Auto-refresh meant the display showed new orders near real-time.
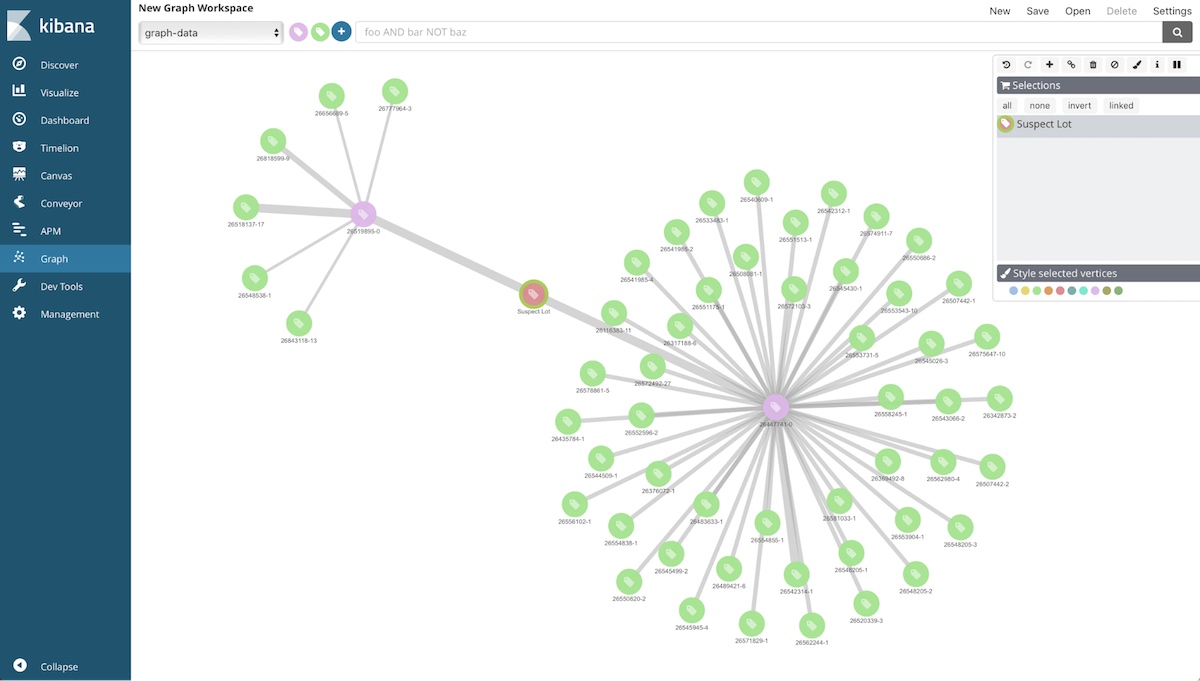
We’ve used Conveyor to pull in bill of materials and inventory data. We put it all in to Graph to quickly trace suspect lots through manufacturing and to identify other affected lots. In this case, we were able to easily determine customer orders (green circles) that consumed a suspect lot (red circle) even though there was a sub-assembly process that occurred midstream (pink circles).
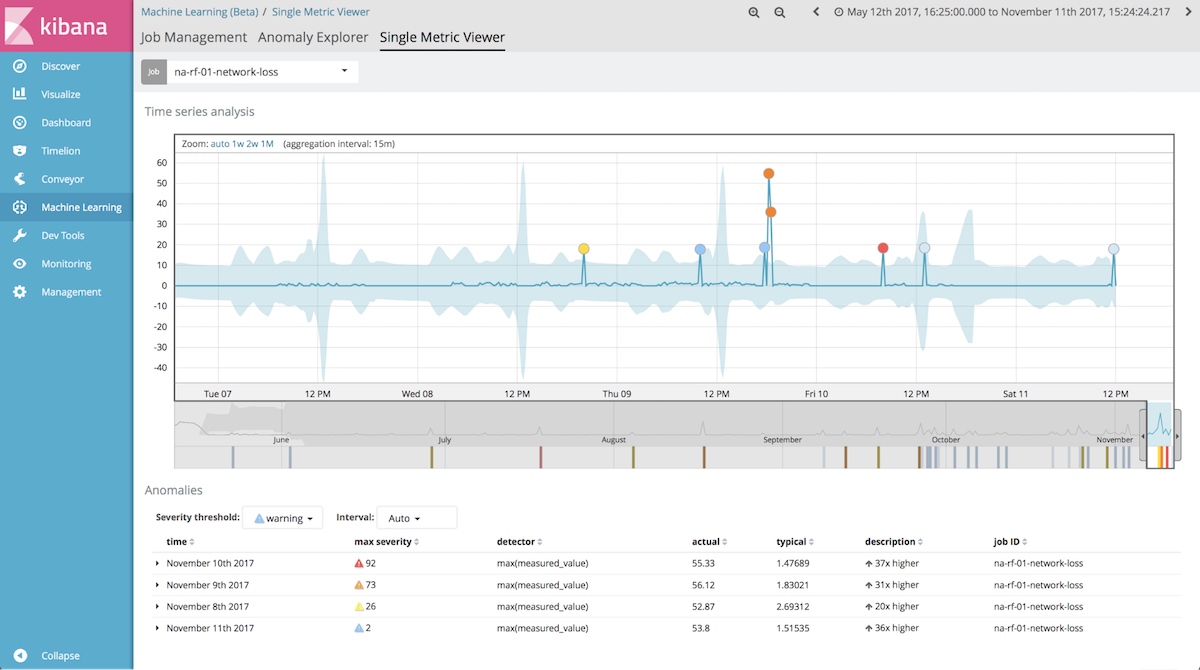
We’ve also used Conveyor to pull in process control data and analyzed it for anomalies using Elastic machine learning. In this case, we analyze a metric that gauges the health of a test station — and we can easily identify or be alerted when it isn’t as expected.
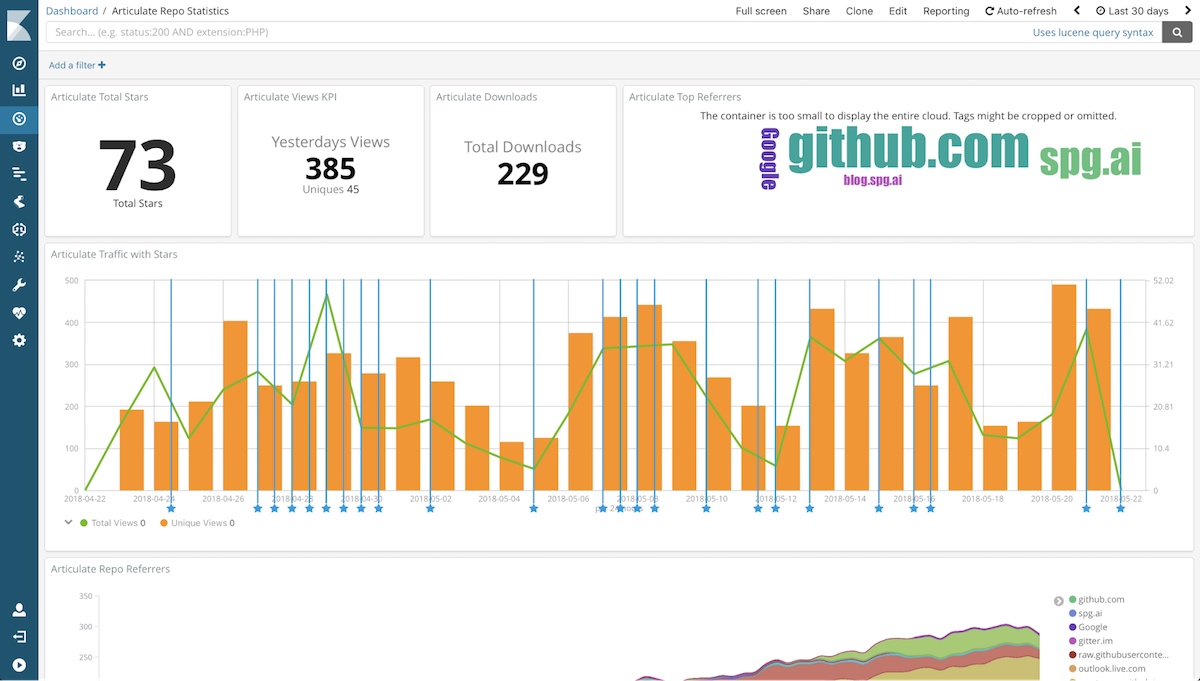
Finally, we use Conveyor and Kibana together to build powerful dashboards on all sorts of business metrics, like GitHub Repository Statistics, for our open source chatbot platform called Articulate to cheer-on the increasing downloads and stars!
What’s Next
We’ve now been using Elasticsearch as a primary data store for our projects for more than four years and though we don’t have big data like some users of Elastic we have broad data. With the introduction of Conveyor, as well as new Kibana functionality like Canvas and Vega visualizations, we strongly believe that the Elastic Stack is the best open source business intelligence platform. To reinforce that we’ll leave you with three thoughts:
- Joining disparate data sources in a single analytical tool is extremely powerful and compounds the value of your data.
- Dynamic mappings and re-index capabilities make Elasticsearch an excellent collect now, analyze later data store.
- Cross-index search enables powerful information gathering on business data. (Want all sales orders, shipments, and contacts for a customer? Just search for their name across multiple indices).
We hope to be back to share more in-depth walkthroughs on using Conveyor with Vega and Canvas, as well as our experience with the new Elastic User Interface (EUI) library. We’re happy to share our experiences so keep an eye out for those here or on our site at https://blog.spg.ai. Also, be sure to check out Conveyor
Caleb Keller, Woo Ee, and Mike Lutz head a team of data lovers, tinkerers, and technology enthusiasts building open-source solutions for Samtec's Smart Platform Group