


Custom Region Maps in Kibana 6.0
Editor's Note (August 3, 2021): This post uses deprecated features. Please reference the map custom regions with reverse geocoding documentation for current instructions.
Grab Your Cartometers
In Kibana 5.5 we added the ability to define your own region maps, which are also also known as choropleth maps. This allows users to define custom geo-boundaries as geojson format, then overlay them on the Elastic Map Service to display aggregations for custom geographical areas natively in Kibana.
This is a simple yet very powerful method for providing localised insights from your datasets. We've touched on this previously in a blog post, but let's dig into this some more and run through a practical example of how to deploy it step by step in the Elastic Stack!
If you'd like to replicate this blog post as you read it, the code for doing so is all here.
Ready, Set….
Before we start, let's define a few words that we will use throughout this post that you may be unfamiliar with, or have heard elsewhere in different contexts;
- geojson - a json file that contains one or more geoshapes that are specified in a standardised format
- geoshape - an array of points that represent latitude and longitudes to form a polygon
- regionmap - a visualisation in Kibana used to show the results of aggregations that have been bucketed into geoshapes and then geographically mapped
Sourcing Your Map
https://exploratory.io/map has a number of high quality maps and for this post we'll be using the Australian State file. If you download the file, extract it and take a look in it, you will find a repetitive structure, with the geoshapes we need and other fields that we will use later.
There are a number of other sources out there that build and provide geojson files for you to download and use, your favourite search engine can help locate them for you.
Ultimately, if you can't find what you want on the internet then you can build your own geojson files. That's outside the scope of this blog post, but luckily exploratory.io themselves have an excellent blog post on how to do that right here!
Configuring Your Source
Now that we have our geojson file, we need to let Kibana know how to read it and map the geoshapes it holds onto the tiles that the Elastic Map Service provides.
kibana.yml
Using the extracted aus_state.geojson from the "Australia States" archive, we need to configure some custom settings in your kibana.yml file. Open the yaml file in your favourite editor and add this on the end;
# Custom Region Maps
regionmap:
  layers:
     - name: "Australian States"
       url: "http://localhost:8000/aus_state.geojson"
       attribution: "https://exploratory.io/maps"
       fields:
          - name: "STATE_NAME"
            description: "State Name"
These settings are explained in this page of the documentation, but let's break it down here;
- name: a description of the geojson file we are defining. Also used in the Options tab as we will see later.
- url: is where Kibana can retrieve the geojson file from. For now it needs to live on a webserver but we are working on other options, such as a file.
- attribution: it's always nice to provide a reference to the source of the file where we can!
- fields.name: this field is used to setup an inner join between the Elasticsearch document and the geojson file. More details on that soon.
- fields.description: is a human readable label that is displayed in the Options tab when building the visualisation. Just like with name, we will see that below.
The fields.name we define above is extremely important. It tells Kibana how to take the documents in Elasticsearch and then figure out which shapes in the geojson file it needs to place that document for the aggregation results to be displayed. We will run through this in detail and step by step, so don't worry if that's a bit confusing for right now.
Serving Up The Geojson File
The last step we need to do here is to serve the geojson file from a web server, as was defined in url. For this post we kept it simple and used this awesome little tool from npm, http-server, and ran this command via our shell from the same directory that the aus_state.geojson lives in;
http-server --cors='*' -p 8000
You can test this by opening http://localhost:8000/aus_lga.geojson from your browser, and you should see the contents of the geojson file.
There are also dedicated products to serve your geo-data, like Geoserver that would be better suited for ongoing, production level deployments. We'd definitely recommend investigating them as more permanent solutions.
Deploying Your Configuration
It's all been pretty text heavy so far, especially for what is ultimately a visualisation. So let's take a look at what this all translates to in the Kibana UI.
The Aggregation Settings
As with most things in Kibana, we need to build an aggregation to show our data on our custom geoshapes. For this example dataset we will change the default Count Aggregation, under Metrics, to a Max and select the Population field to run the agg on. Then we Bucket the data using a Terms Aggregation on the Name field.
Here's what we mean;
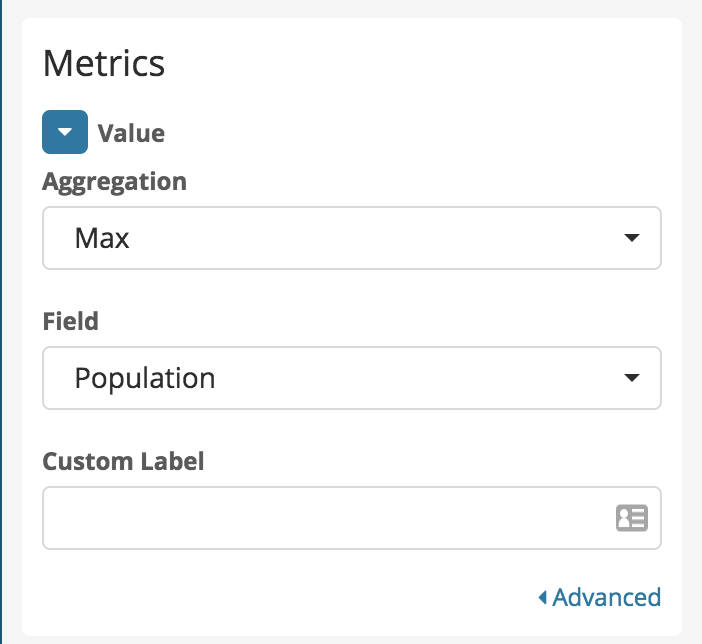
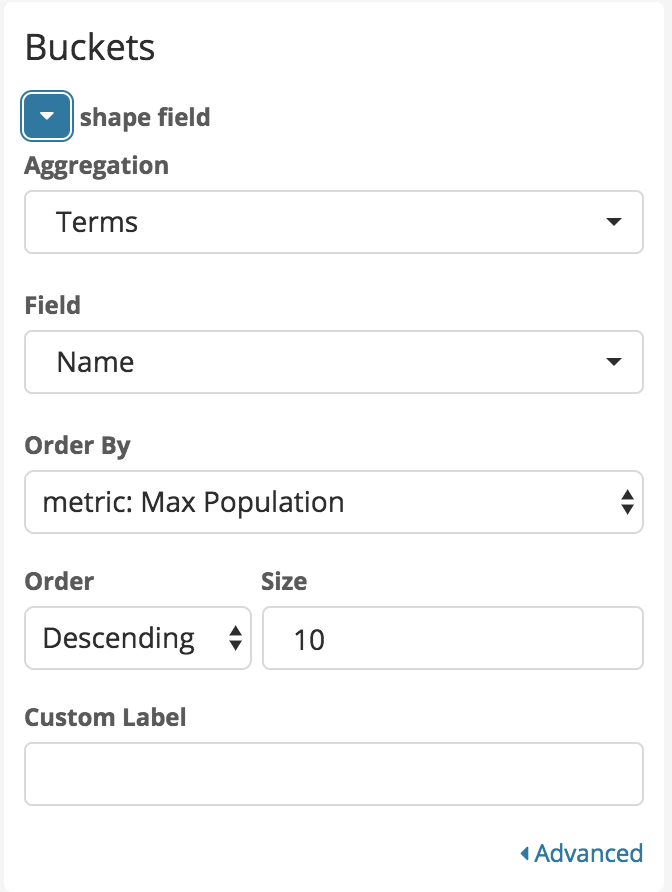
Note - these are shown side-by-side to save room on this page. In Kibana they are displayed as a single vertical column on the left of the browser window.
The Map Settings
Now we have to tell Kibana to use the regionmap settings as we defined in the kibana.yml.
Under the Options tab we need to change the default Vector map to point to the one we configured, this is where the name field from above is used, so select Australian States. After that we select the Join field, which you have probably already guessed, will show the fields.description value of State Name.
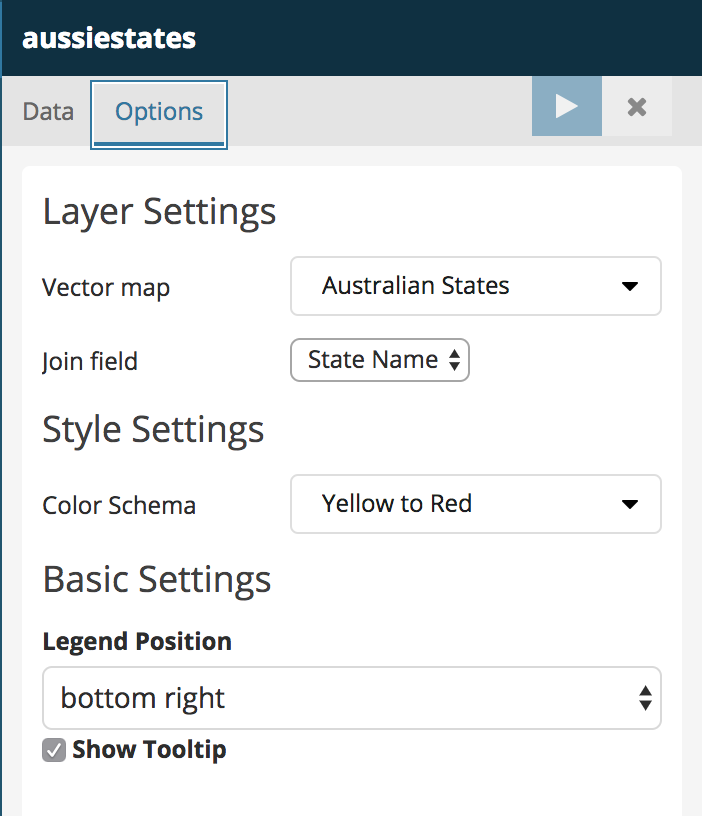
Then we hit the Apply changes button and….
The Outcome
Let's break and explain something we briefly touched on earlier, remember when we talked about the inner-join? Well, at this point Kibana has;
- Loaded the geojson file from the webserver we specified.
- Built and run our aggregation to retrieve the results.
- Mapped those results into our custom geoshapes.
- And if you're playing along using the link we provided above, you can probably see the map already (lucky you!).
However! Most importantly to all this is what happens between steps 2 and 3, where we run this inner join we keep referring to. Let's break that down as it's super important to understand if you want to start building these maps for your own datasets.
Joint Pain
In our aus_state.geojson file we have a number of geoshapes that represent the boundaries of the Australian States (and Territories). Each of those has a STATE_NAME field with, funnily enough, the name of the state/territory in it.
For any custom regionmap to display the data correctly, we need a field in each document we've indexed into Elasticsearch to have one of the same values as is in the specified join field from the geojson file.
Therefore, if we have these values in the geojson file;
grep STATE_NAME aus_state.geojson
        "STATE_NAME": "New South Wales",
        "STATE_NAME": "Victoria",
        "STATE_NAME": "Queensland",
        "STATE_NAME": "South Australia",
        "STATE_NAME": "Western Australia",
        "STATE_NAME": "Tasmania",
        "STATE_NAME": "Northern Territory",
        "STATE_NAME": "Australian Capital Territory",
        "STATE_NAME": "Other Territories",
And if we create a document in Elasticsearch like so;
PUT aussiestates/doc/nsw
{
  "Name": "New South Wales",
  "Population": 7757800
}
We then create a terms aggregation on the `Name` field (i.e. step 2). Kibana takes the value of the `Name` field and look in the geojson file against the field we defined in `fields.name`, which is `STATE_NAME`. Given it finds an exact match, it adds the max value in the `Population` field to the `New South Wales` bucket (i.e. step 3). Then it takes the custom geoshape and transposes it onto the tilemap service with the results of the aggregation. Then it repeats this over and over until all the documents have been processed and we have the final results being displayed (step 4).
And what does that all translate to?
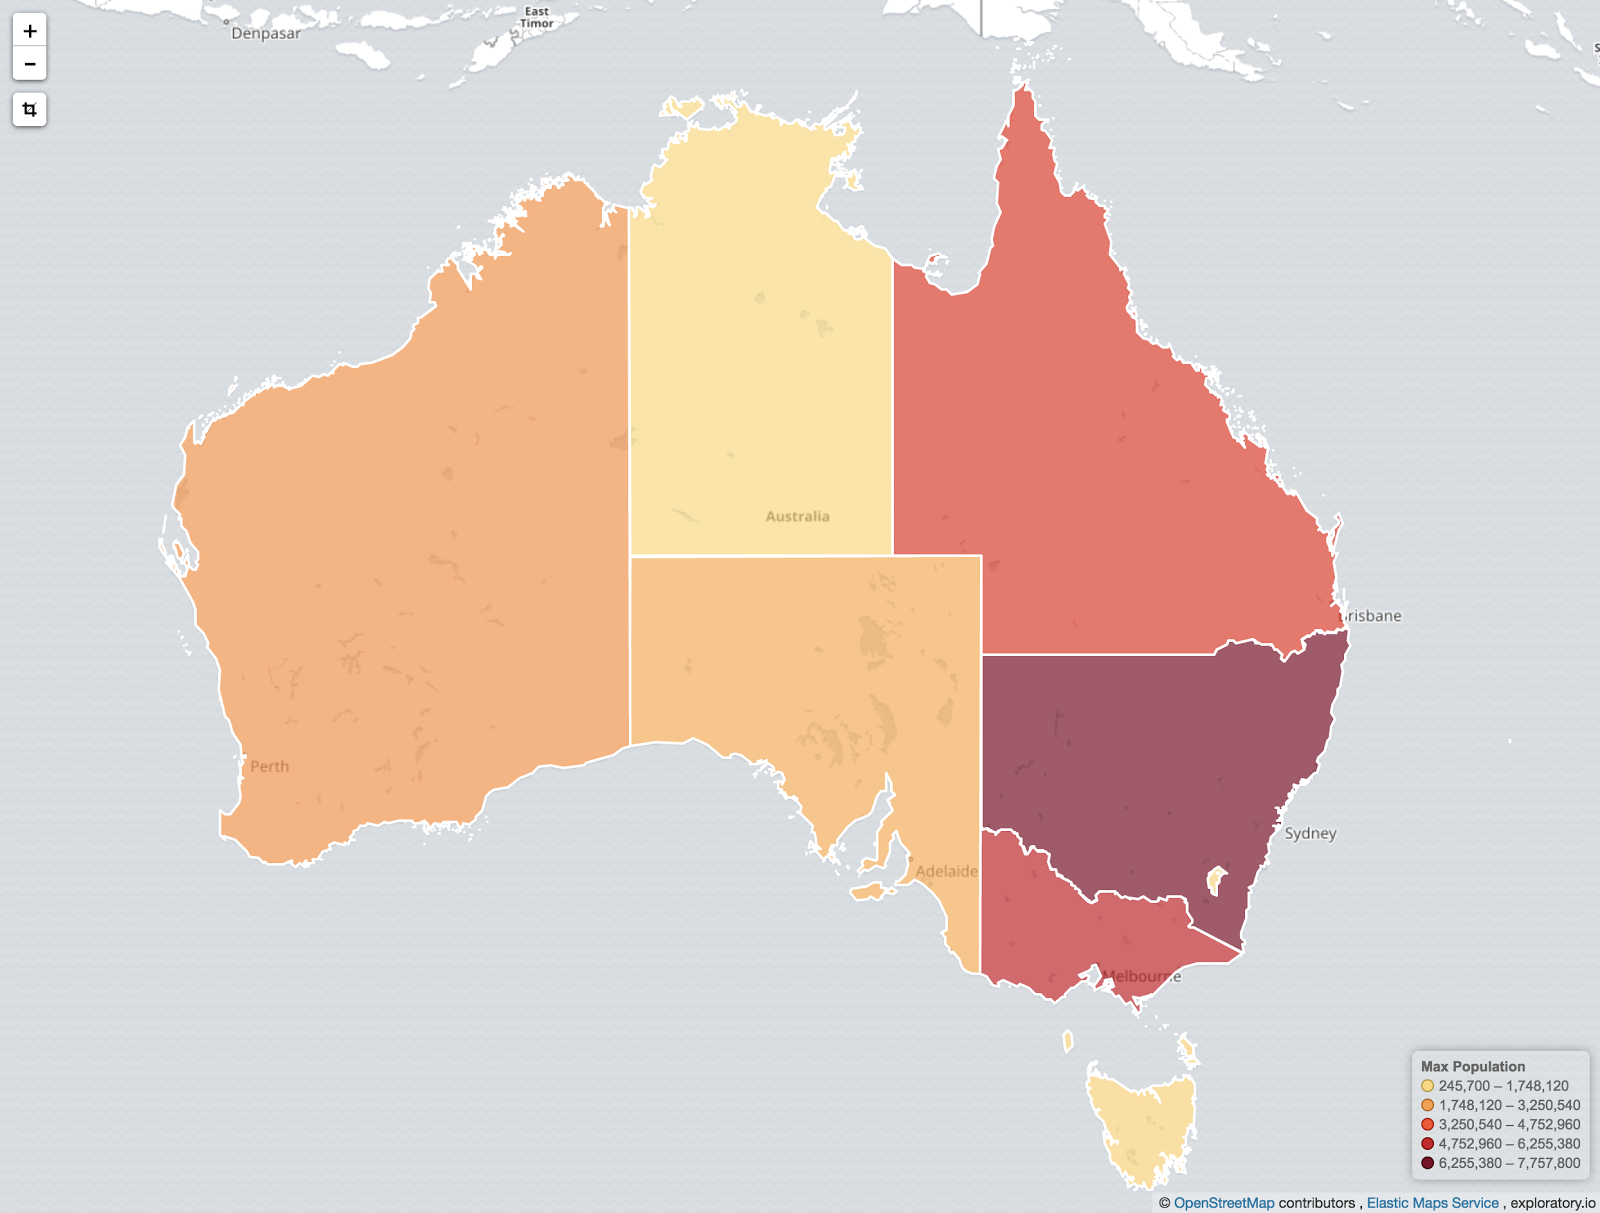
Glorious, sunburnt Australia! Some places more than others ;)
Troubleshooting
space-not-tabs.yml
One general point we will start with is that the configuration file for Kibana is yaml formatted. That means that spaces are super important for nested definitions like the one we use here. If you run into problems then it's always good to check your indentation is correct and uses spaces and not tabs.
There's Nothing On My Map!
If you've still gotten this far but your maps are still blank, remember that the values in the geojson file and the Elasticsearch document need to be the same. Not just similar, exactly the same. If you aren't already adjusting your mappings, make sure you do and set the field that contains the value to a keyword to ensure it doesn't get split and/or lower-cased like a text field would. Ultimately you need make sure your processing pipeline normalises the field values to the geojson file values.
From 6.1 there will be improvements on how we handle failed joins. We will allow users to turn off warnings for failed joins, so when some terms aren't present in the geojson source, the dashboard won't be overloaded with error warnings.
CORS Mate!
CORS stands for Cross-Origin Resource Sharing and is an important feature of the browser's security model. CORS configurations define how a browser decides what content any given web-application has access to, based on the domain (or origin) of where that web application is hosted. The default behavior is simple; Browsers do NOT allow Javascript to load or post any content cross-origin. If this were so the browser would make data-theft very easy! After all, as administrators, we generally do not want a web-application to retrieve (possibly malicious) code or post (possibly private) content from or to another domain we do not control. Our users certainly would not want this!
For example, javascript-code from the Kibana application hosted on the http://engineering.example.org cannot execute a request to fetch files hosted on http://accounting.example.org, as they are on two different domains.
To work around this, servers can advertise which other domains they "trust". This is a server's CORS configuration. As an example, the admins of accounting.example.org can configure the CORS-headers of their server so it will accept requests from the engineer.example.org domain.
The browser's behavior would then look something like this: When users visit Kibana running on the on engineering.example.org domain, the browser will first sent a preliminary 'test'-request to accounting.example.org. When the server on accounting.example.org responds that it accepts requests from websites hosted on the engineering.example.org domain, the browser will then send the "real" request for the data to accounting.example.org.
So why did we decide to require users to setup CORS? After all, why can't the Kibana server serve the geojson file so we can avoid this whole CORS business? The reason for this is that geodata comes from many different sources, and a lot of organisations already have an established stack for geo-data deployed, products like Geoserver or ArcGIS server. It is very common that these dedicated services would be running on a different domain from where Kibana will be hosted.
And That's It!
One last thing that we will note is that the Region map provides a zoom level of 10 by default. To increase the zoom levels, install X-Pack alongside Kibana and Elasticsearch and then register for a free Basic license for all 18 levels!
We hope this has been useful and given you some great ideas on how to use custom maps with the flexibility built natively into the Elastic Stack. Imagine extending this to show voting levels based on your state/district/electoral areas, or grades for schools based on their coverage area, or even showing soil type, soil infiltration capability, land use, and the depth of the seasonal high water table! It's now even easier if you have the data.
Feel free to head on over to our forums if you have any further questions, or if you just want to share your awesome custom Region map successes, and thanks for reading.