


Using Elastic Stack to Explore Australia 2018 Budget
The Treasurer handed down Budget 2018-19 at 7:30pm on Tuesday 8 May 2018. The budget is a complex set of documents and for an ordinary individual understanding or even navigating the document could be quite a daunting task. Interactive visuals have always been a preferred choice for many when it comes to deciphering numbers, particularly multi-dimensional dollar values that run across a number of years.
In this article, we will demonstrate how Kibana could be used to visualise a subset of the budget data elegantly than one would normally do using a spreadsheet application.
The challenge of multi-dimensional data in its raw form
With data (e.g., .csv or .xls) provided in their raw form, one would normally open a spreadsheet application, select the rows and columns in a sheet, and configure some sort of visualisation. The visuals thus created would be static, and one would not be able to select a dimension or dig deeper into that column. Moreover, the process of creating the visual, sharing across an organisation or publicly becomes inefficient and error prone. And by the way, who wants to read a csv or .xls file cell by cell?
We need a simple tool to be able to visualise data and understand its content.
Visualising Australia 2018 Budget - An example
Budget 2018-19 Tables and Data are publicly available here.
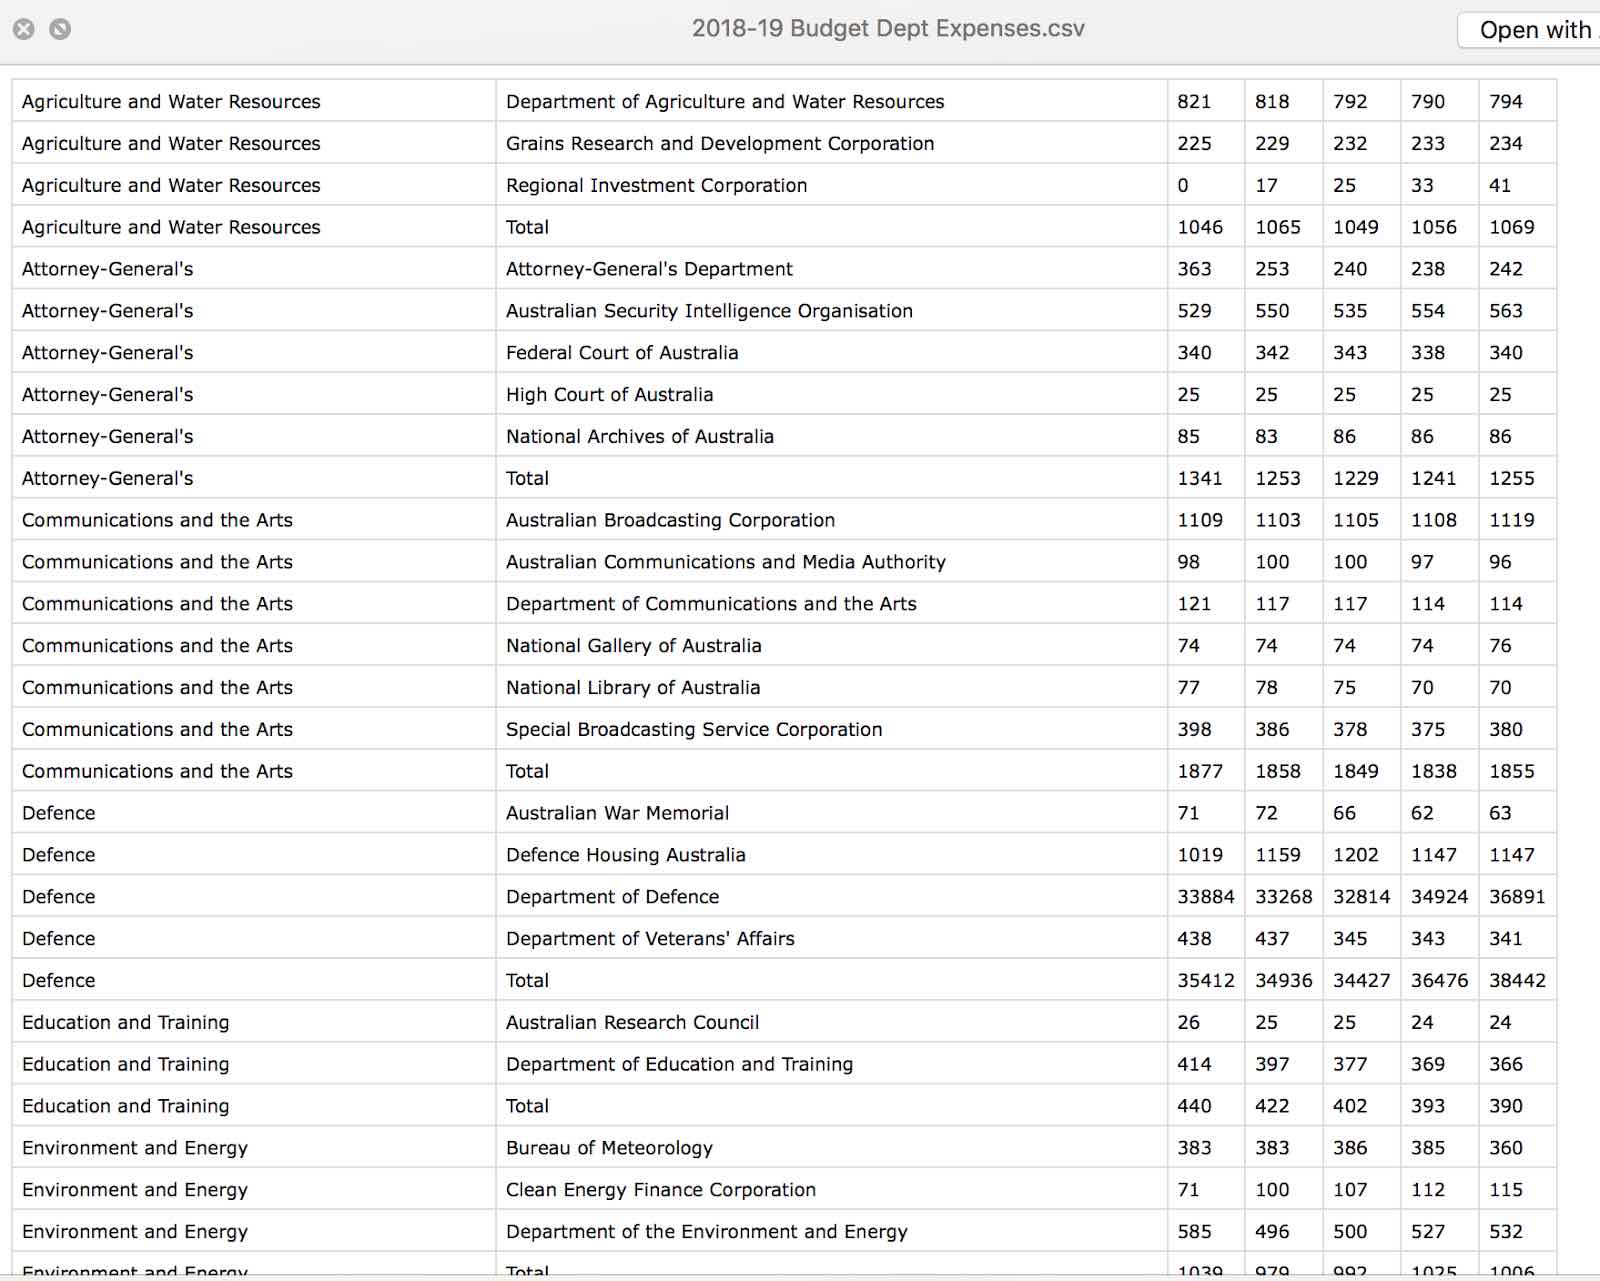
One of the files “2018-19 Budget Dept Expenses.csv” if opened in a spreadsheet, would look like:
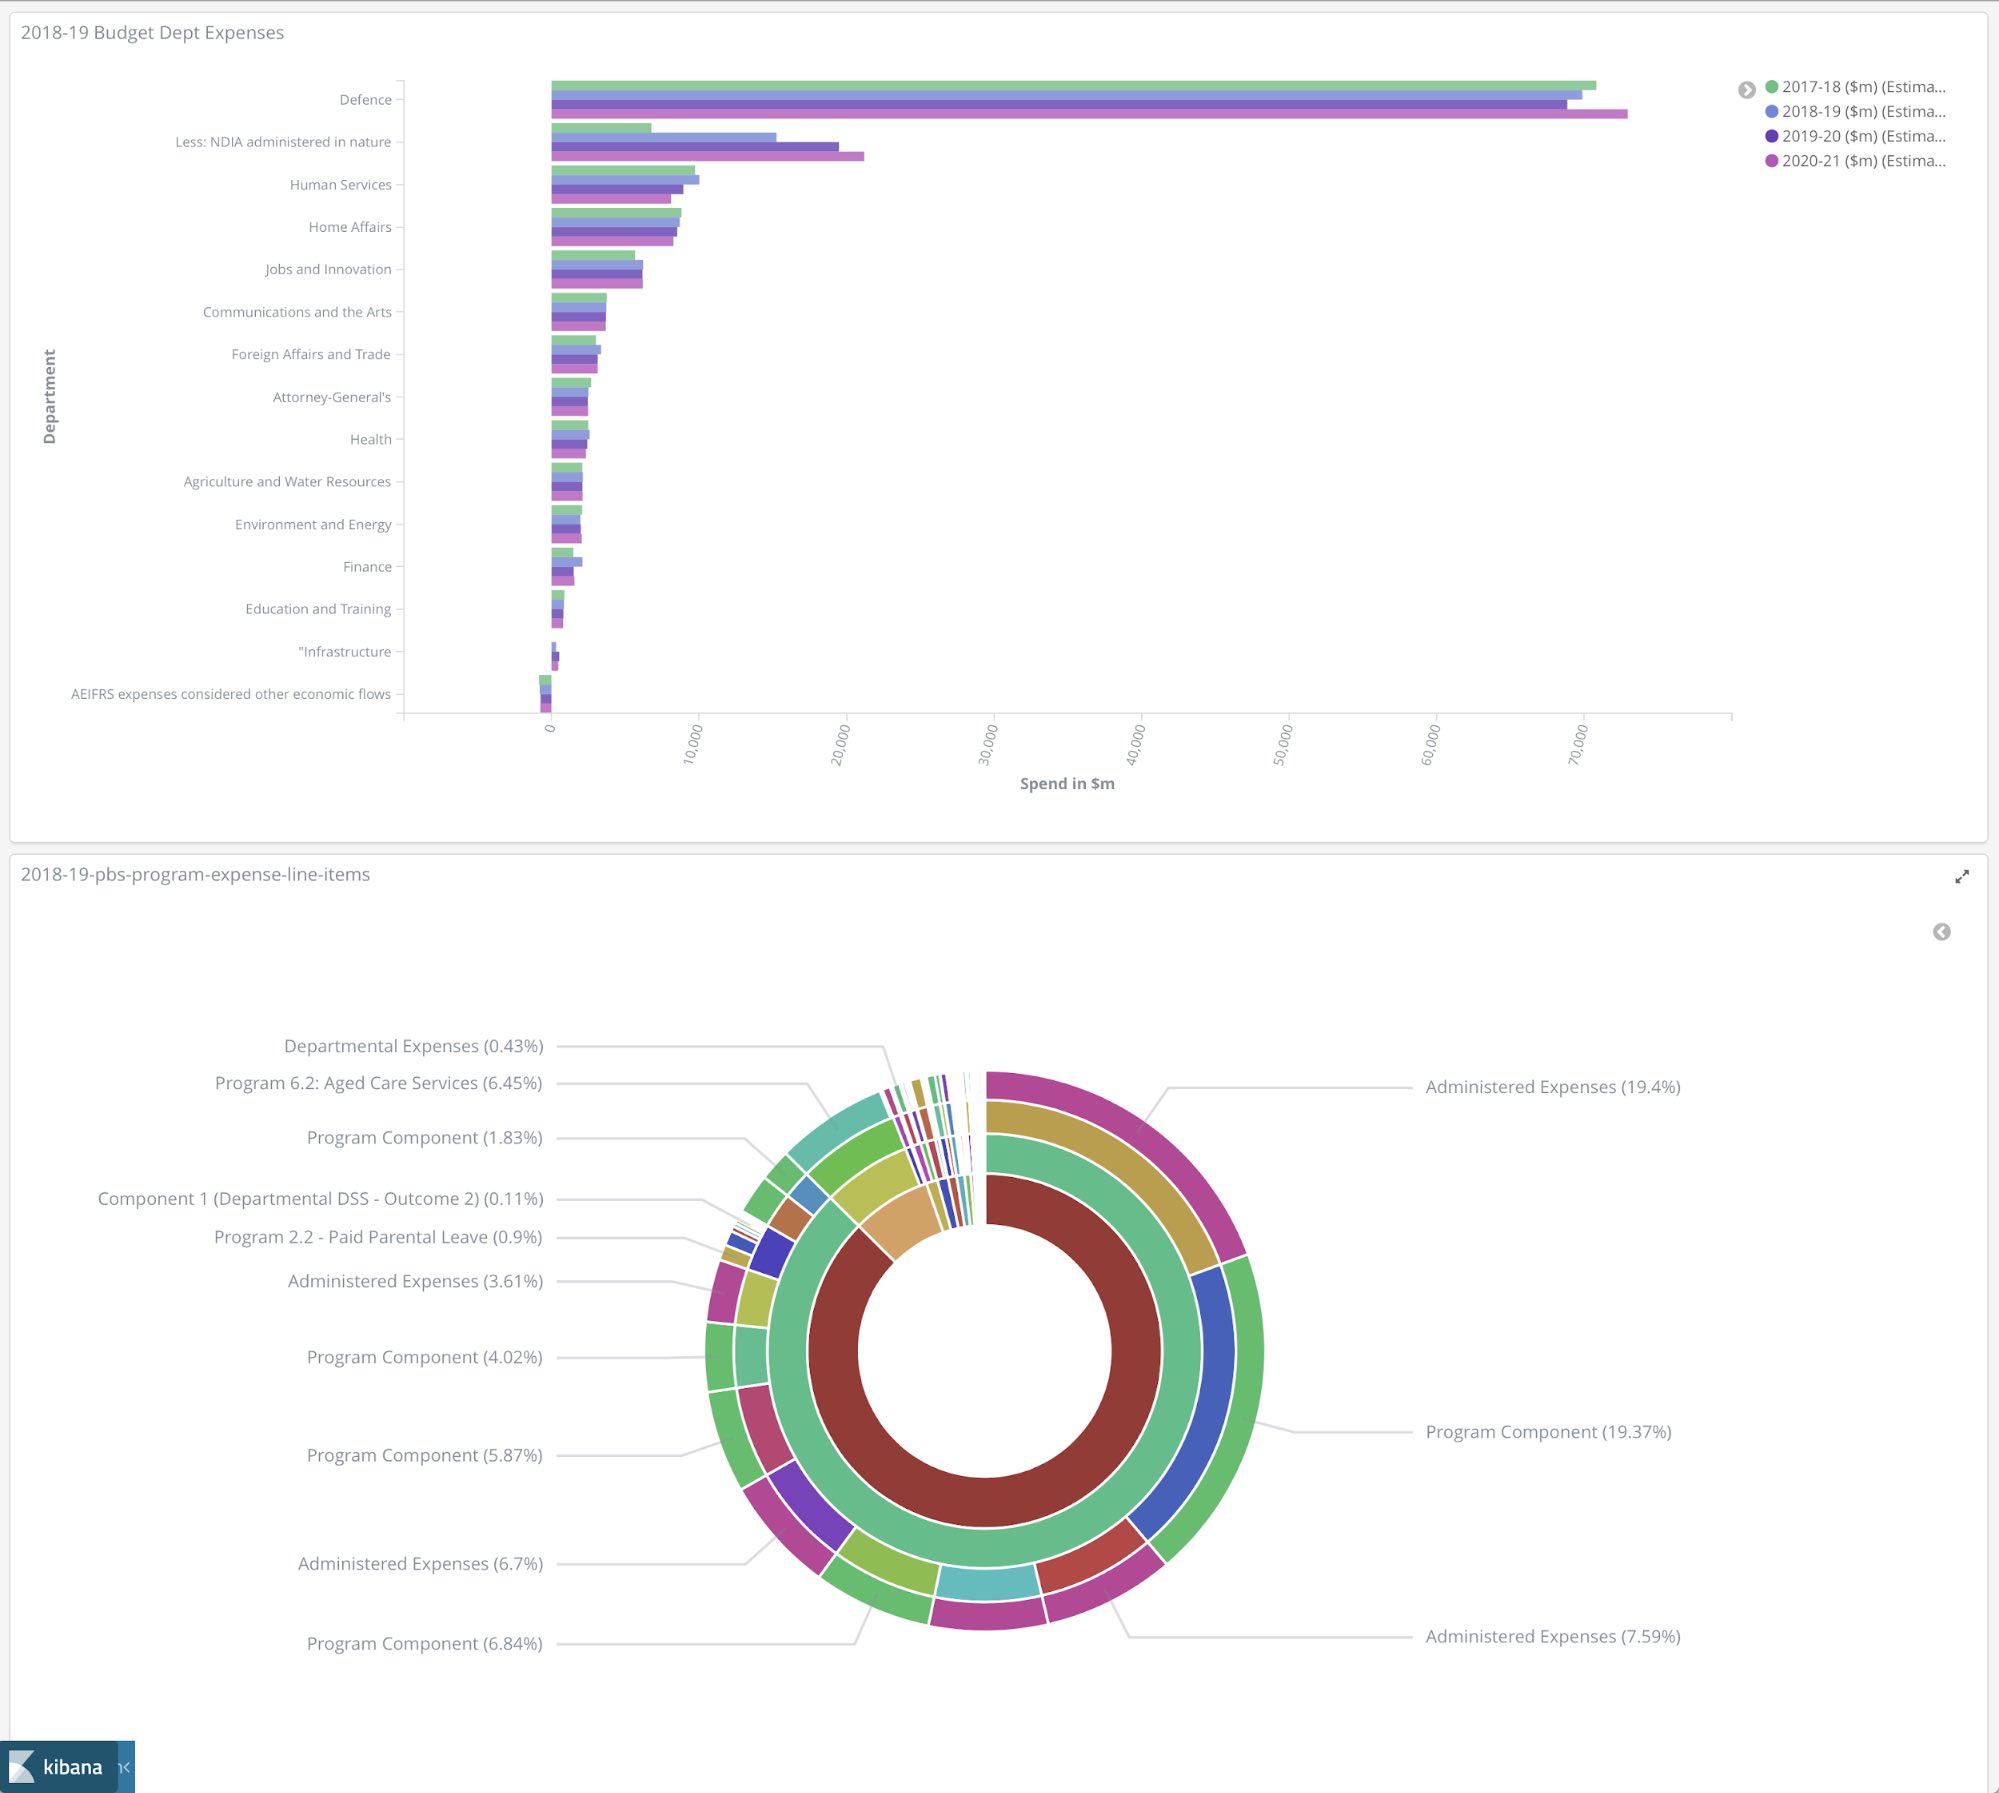
Using Kibana, that data is now presented in an interactive manner as below:
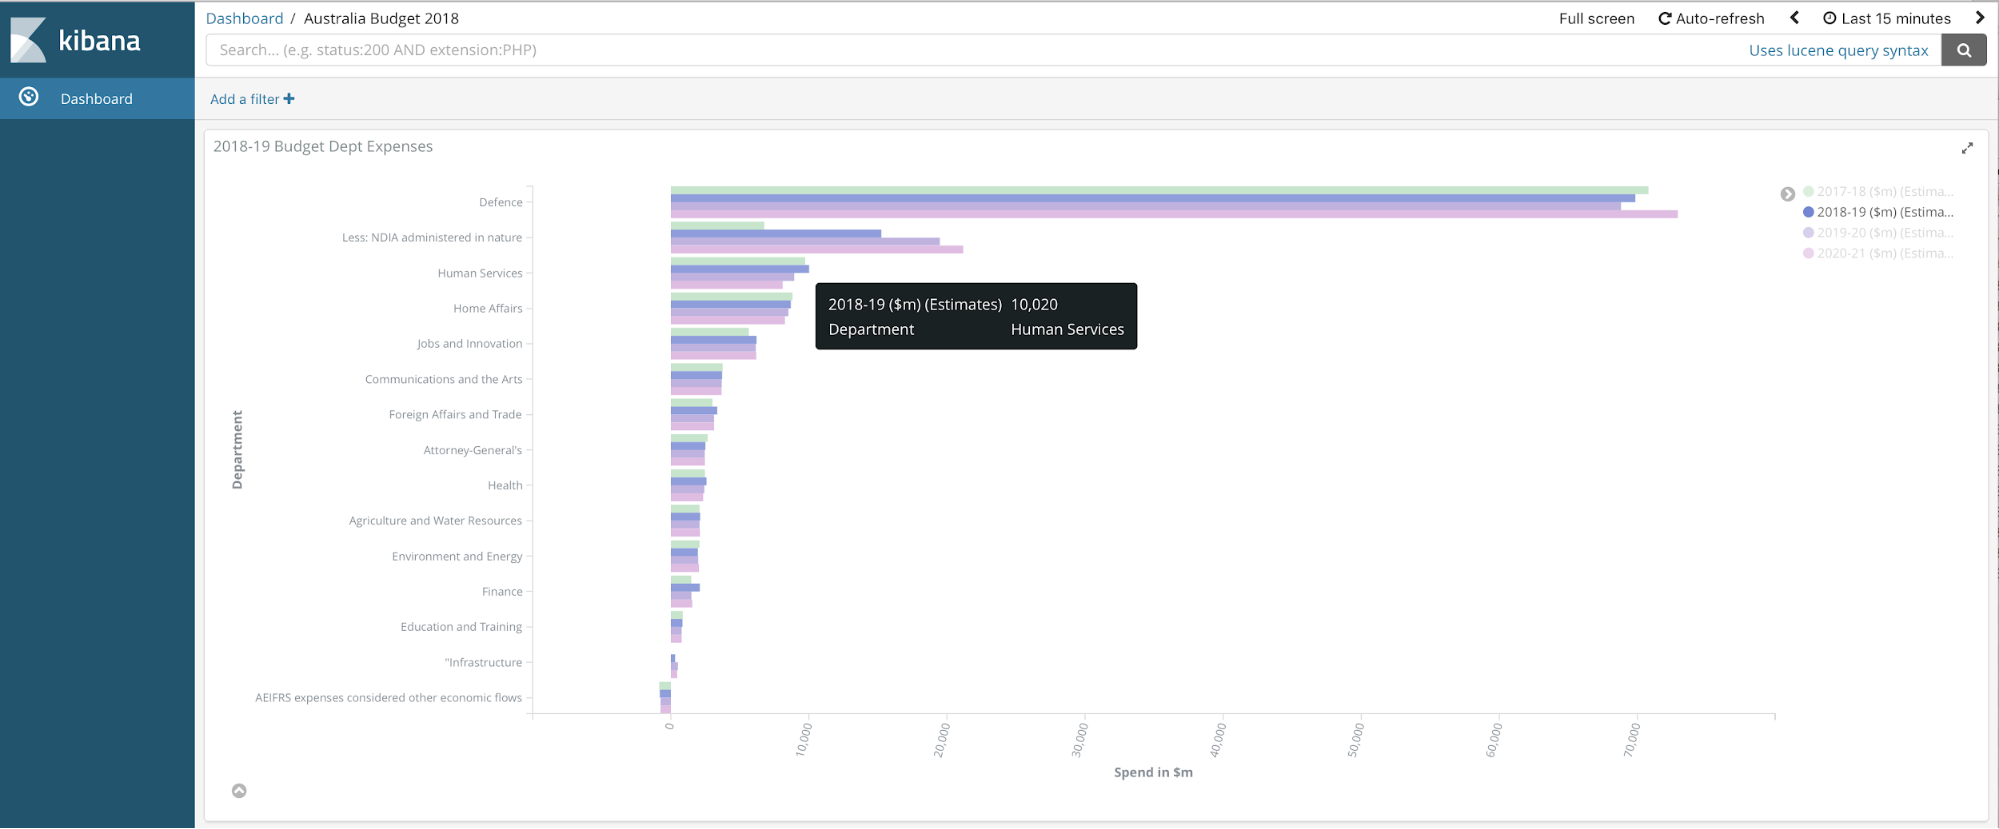
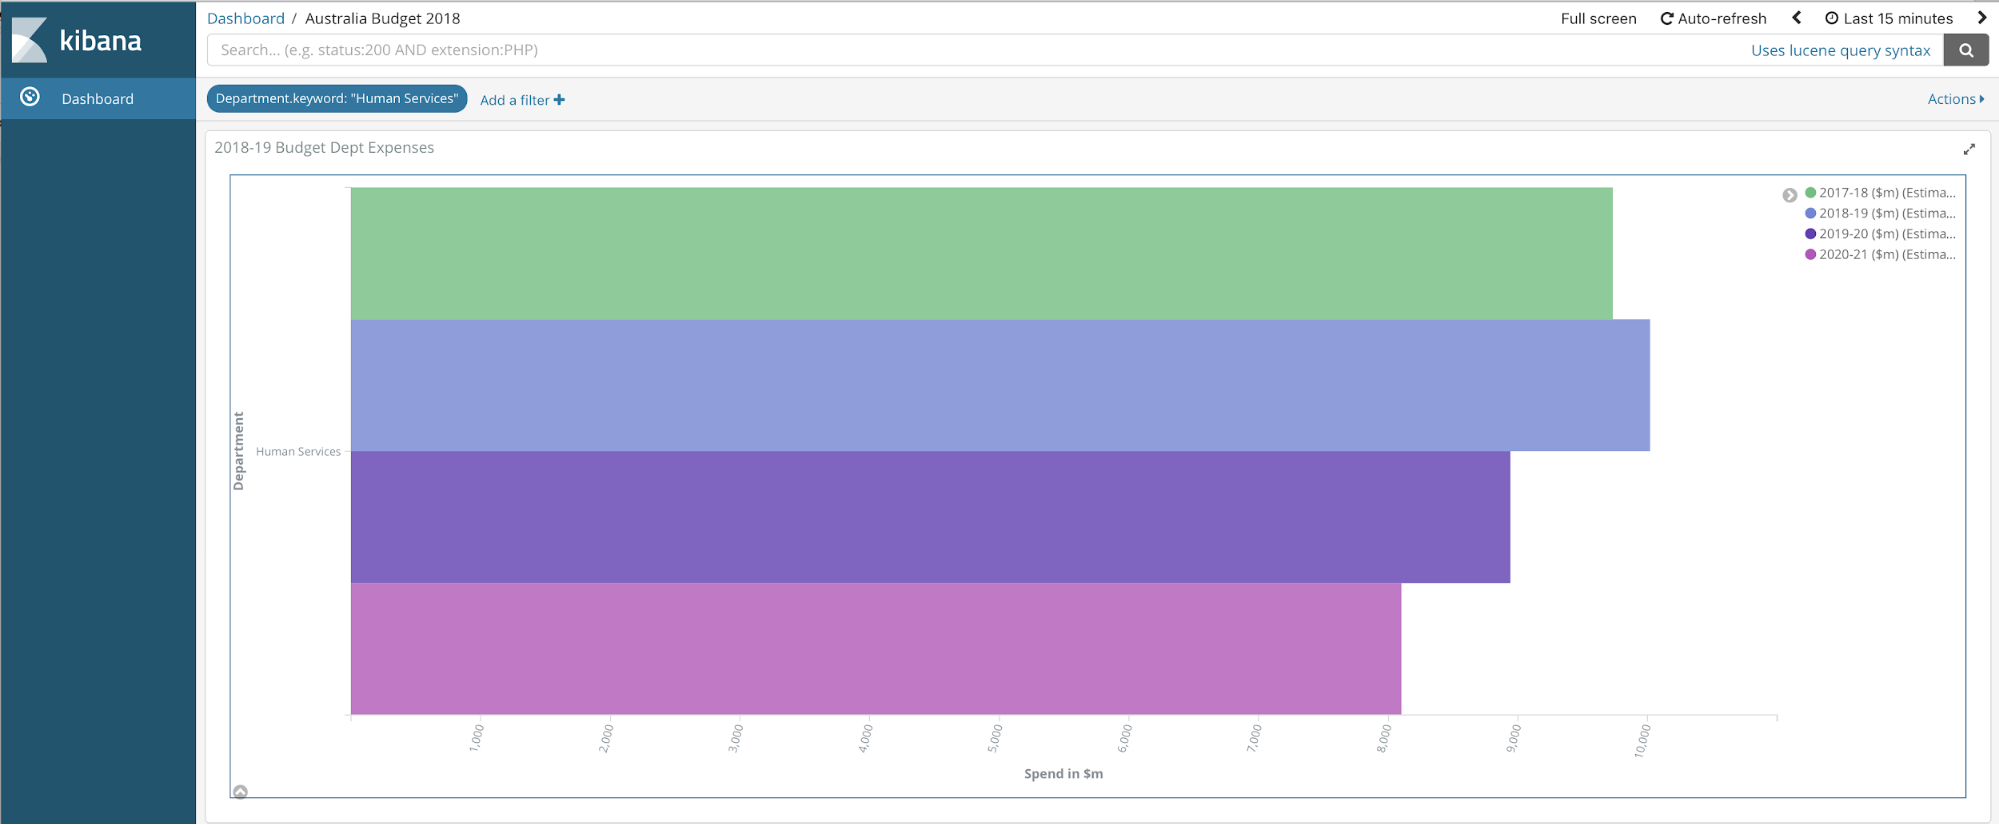
If you were interested in drilling-down on the “human services” department expenses, then just clicking on that bar would take you to a visualisation like below:
By the way, have you noticed that these visuals are a part of a webpage and the http link could be shared with anyone you wish?
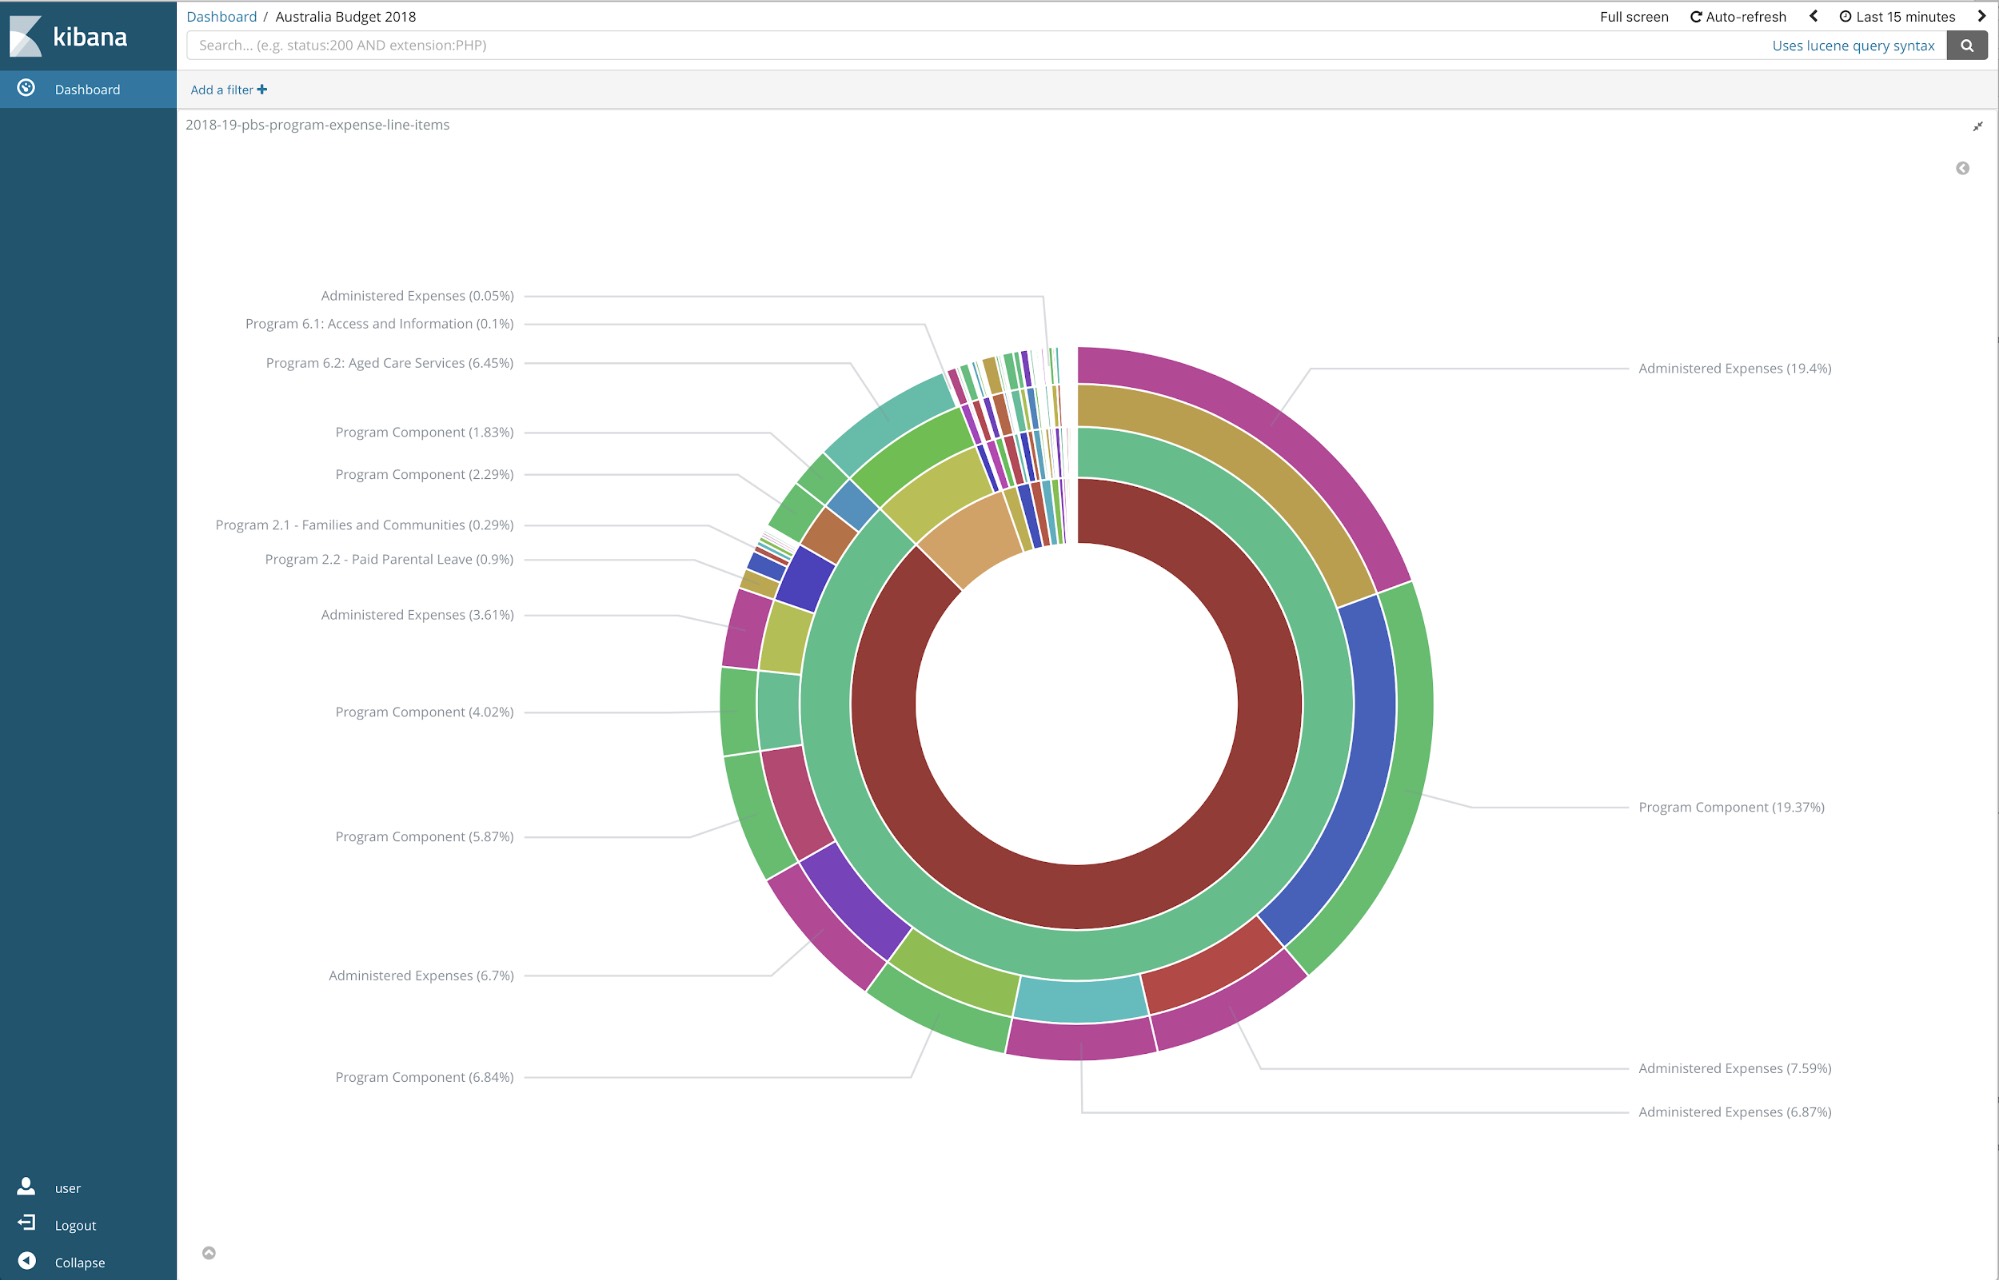
We wanted to see and understand more. So we opened the file “2018-19-pbs-program-expense-line-items.csv”, and the results on piechart showed so much detail.
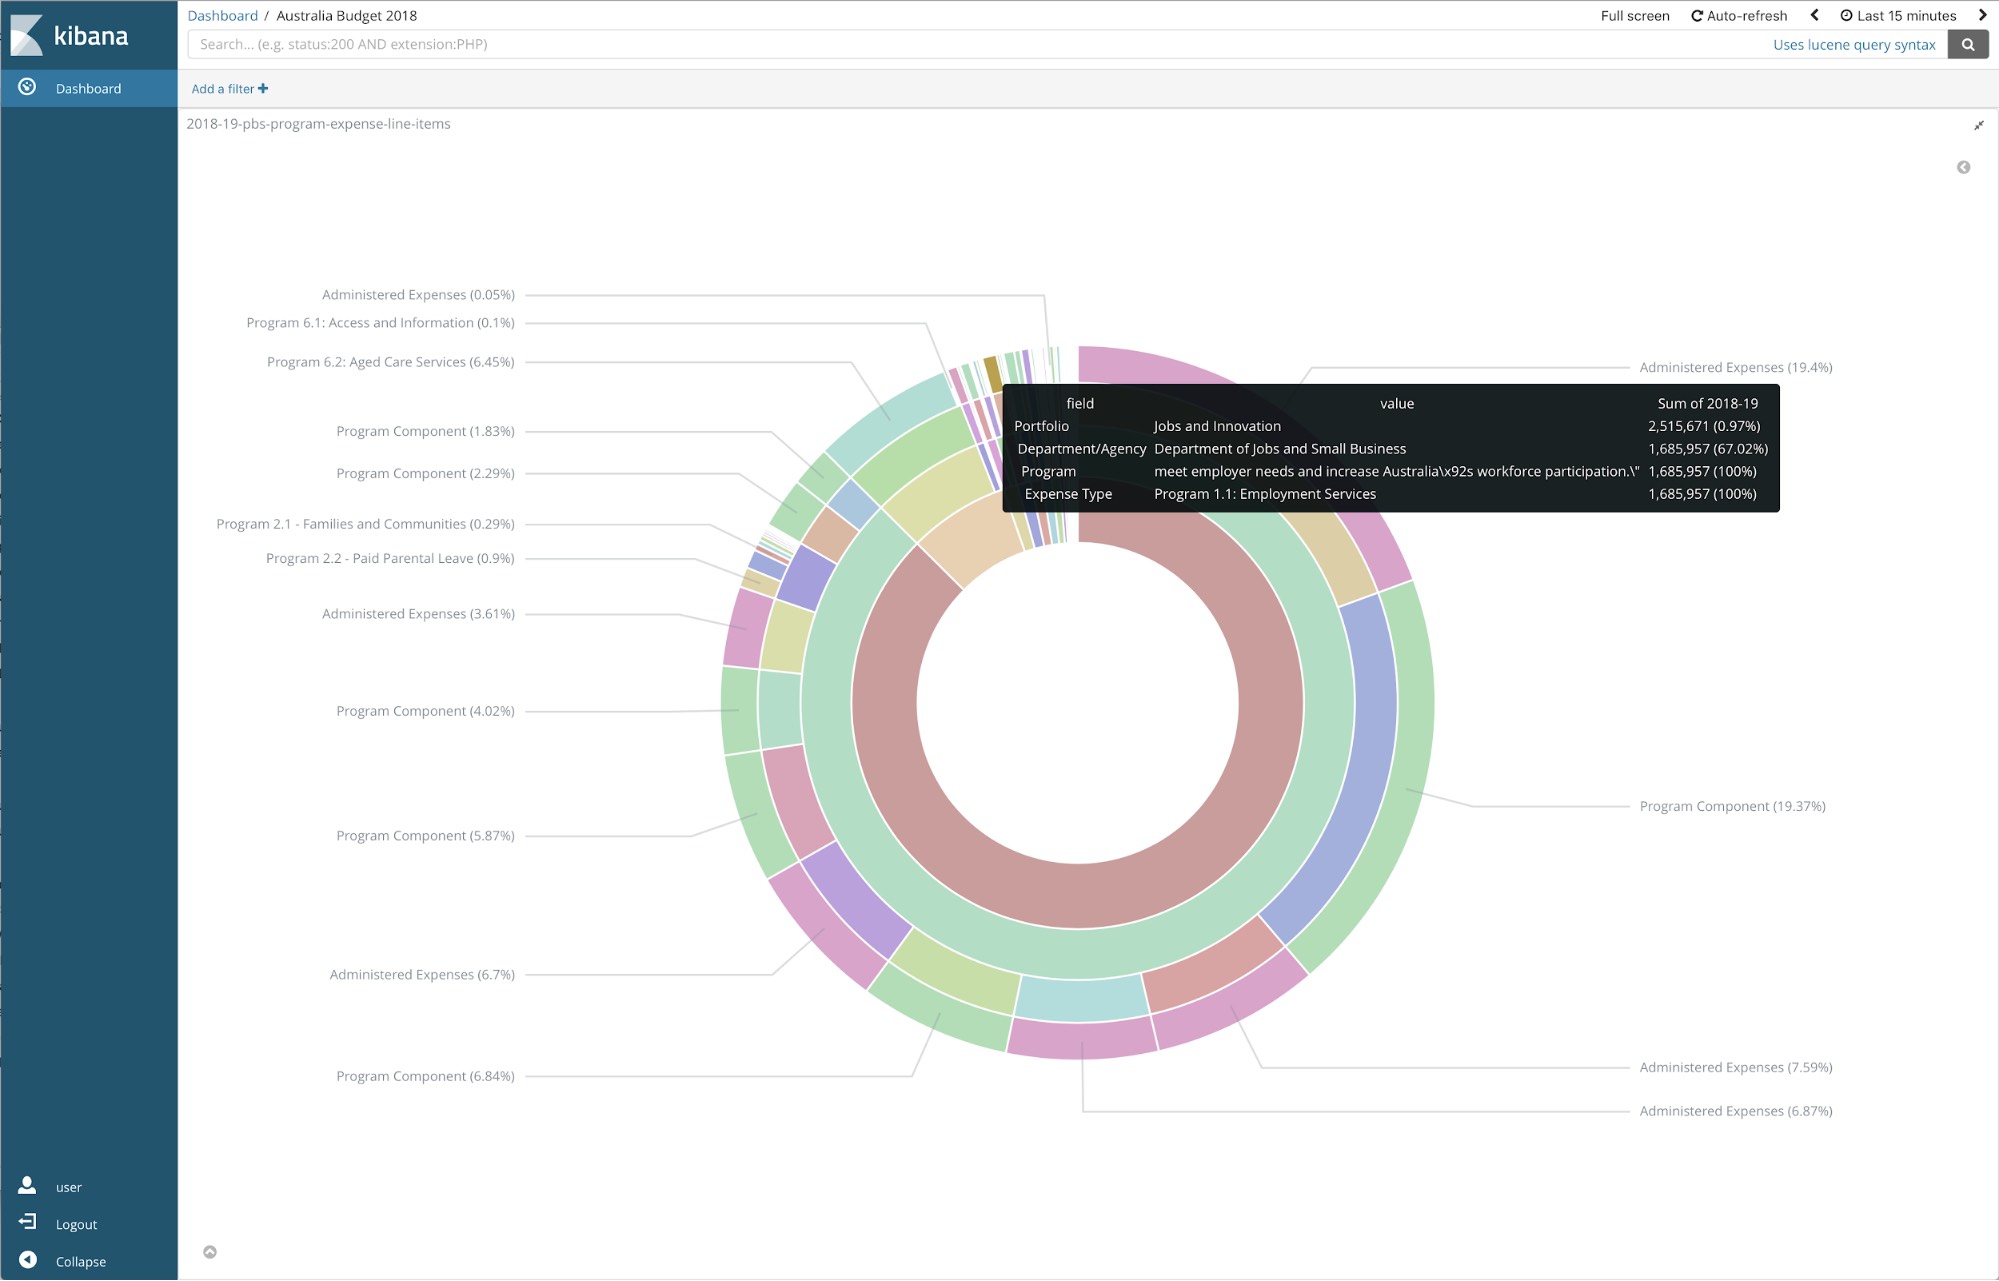
Drilling down onto one of the programs, e.g,. Employment Services, we can ascertain how much funds the budget has allocated, as depicted below:
Post the technical setup, visualisation creations and final touches, the dashboard is ready to be shared in a multi-tenant way, and it could look as simple as below:
At Elastic, we make things simple!
Now on the technical side of things...
Importing, Storing, and Visualizing Australia 2018 Budget - An Engineering Approach
Steps to follow to get to the Kibana visuals that could be shared with masses.
- Sign up for an Elastic Cloud account.
- Download and install Logstash.
- Copy-paste the below configuration in your Logstash’s config path.
- Run the Logstash pipeline.
- Start creating visualisations and dashboard in Kibana.
Below, you will find a Logstash configuration for importing a csv file. You may name this file as “2018-19-pbs-program-expense-line-items.conf”:
# This is where your .csv file will be read
input {
    file {
        path => "/usr/share/logstash/pipeline/aubudget2018/2018-19-pbs-program-expense-line-items.csv"
        start_position => beginning
    }
}
# This section will allow you to specify the columns, their types, and any additional formatting
filter {
   dissect {
      mapping => {
        "message" => "%{Portfolio},%{Department/Agency},%{Outcome},%{Program},%{Expense type},%{Appropriation type},%{Description},%{2017-18},%{2018-19},%{2019-20},%{2020-21},%{2021-22},%{Source document},%{Source table},%{URL}"
       }
   }
   mutate {
    convert => { "2017-18" => "float" }
    convert => { "2018-19" => "float" }
    convert => { "2019-20" => "float" }
    convert => { "2020-21" => "float" }
    convert => { "2021-22" => "float" }
   }
}
# This section defines the Elasticsearch output configuration
output {
   elasticsearch {
    hosts => "https://elasticsearch-hostname:9243/"
    ssl => true
    user => "elastic"
    password => "youwishyouknewthisdidn'tyou?"
    index => "2018-19-pbs-program-expense-line-items"
   }
}
If you have a docker installed, then you could use the following command to run Logstash pipeline:
docker run --rm -it -v `pwd`:/usr/share/logstash/pipeline -e xpack.monitoring.enabled=false -e log.level=debug -e pipeline.workers=4 docker.elastic.co/logstash/logstash:6.2.4
For more information on the dissect filter being used above, please visit the documentation.
This is it for now friends.