


Kibana 6.4.0 Released
Welcome to the 6.4.0 release of Kibana!
You can get all the details in the release notes linked above, but there are a few changes which are worth highlighting:
- One-click sample data
- Improved workflow for inspecting data
- New Beta tutorials
- Saved Objects refresh
- Scripted fields preview
- Custom rules for fine tuning machine learning results
- Improved usability for managing machine learning jobs
- Response time anomalies with machine learning in APM
- New query bar for searching and filtering APM data
- Landing page for Elastic Maps Service
- Apply Vega filters to dashboard context
- Experimental API docs
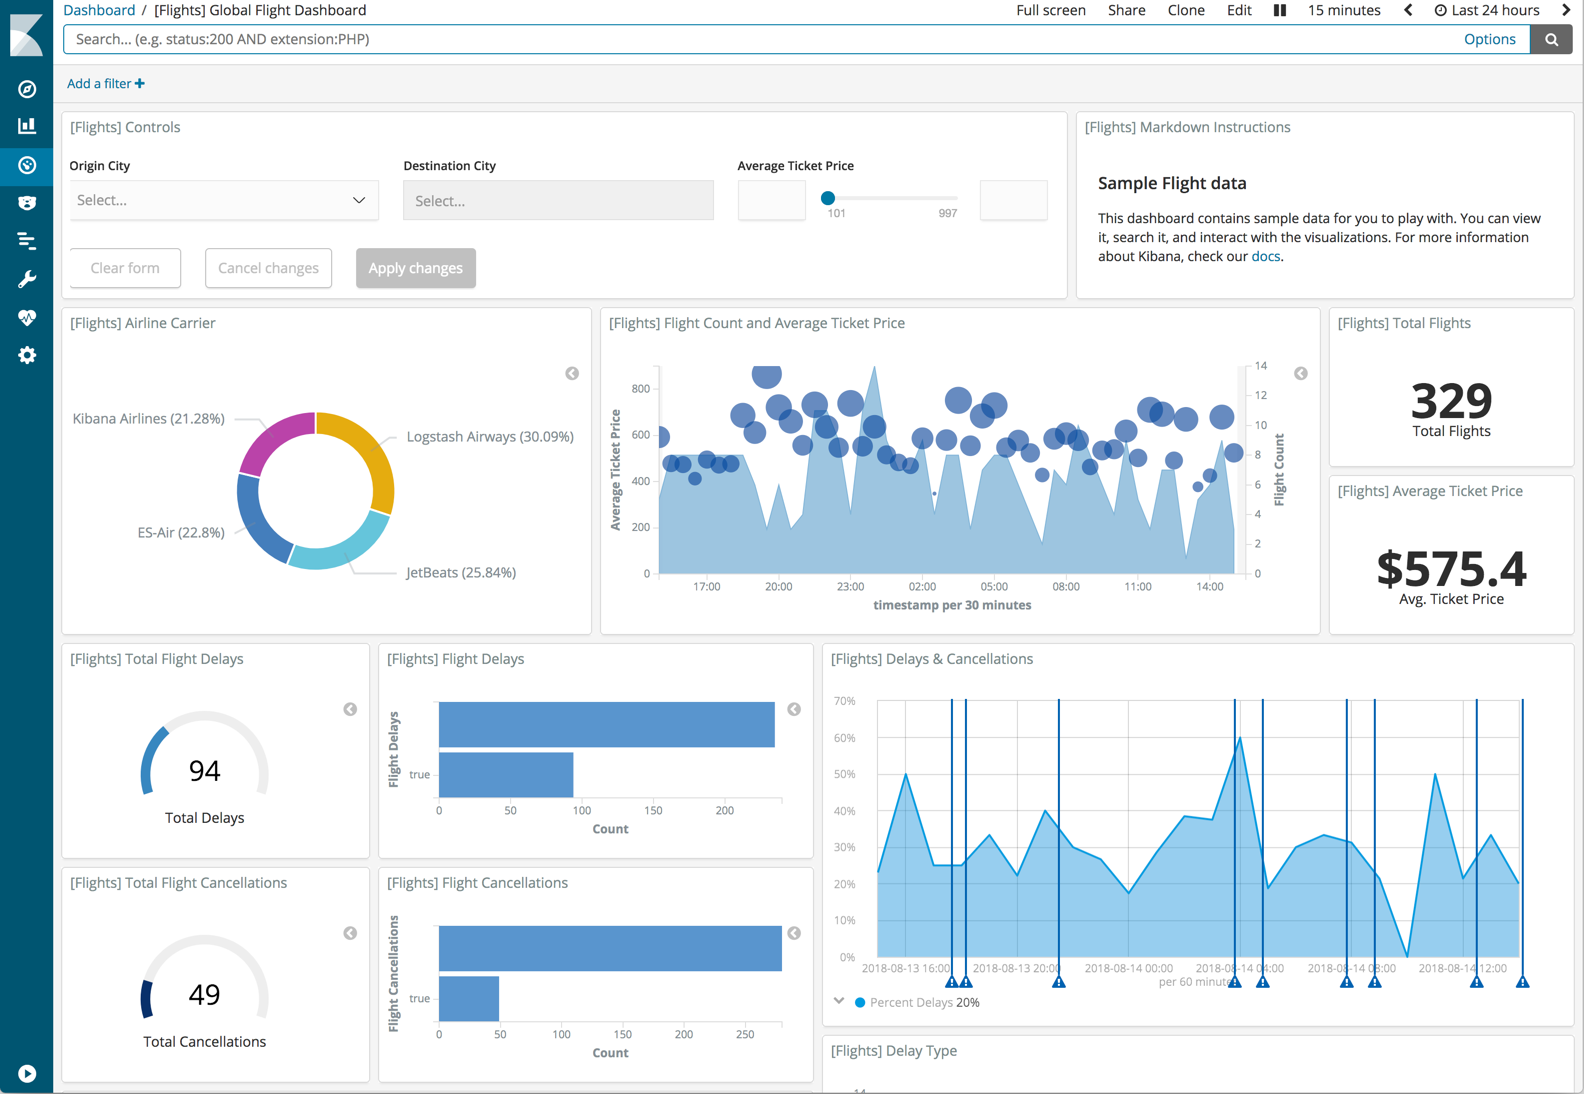
One-click sample data
To improve the getting started experience, Kibana has a sample data set that enables you to take Kibana for a test ride without having to go through the process of loading data yourself. With one click, you can install a Flight data set and start interacting with Kibana visualizations in seconds.
To access the sample data, go to the Kibana home page and click the link next to Sample Data.
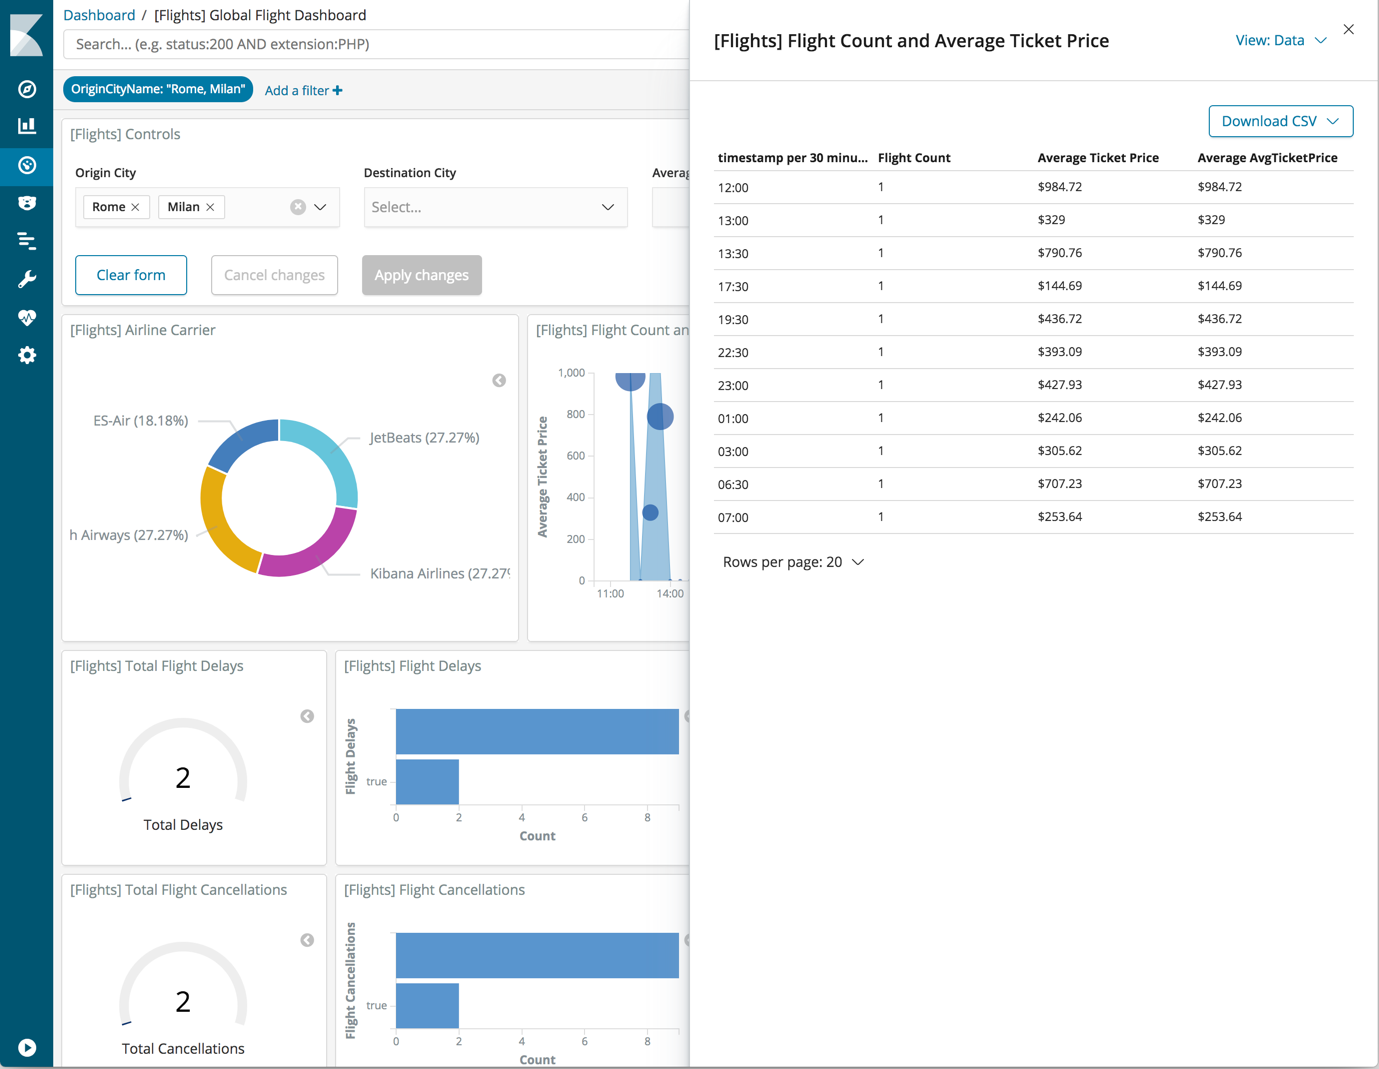
Improved workflow for inspecting data
If you’ve used a spy panel in the past to inspect the data behind a visualization, you’ll notice that this feature's been given a facelift. It’s also easier to access--you can inspect visualizations from multiple places in the UI. On a dashboard, open the panel menu for a visualization and select Inspect. In the visualization editor, click Inspect in the menu bar.
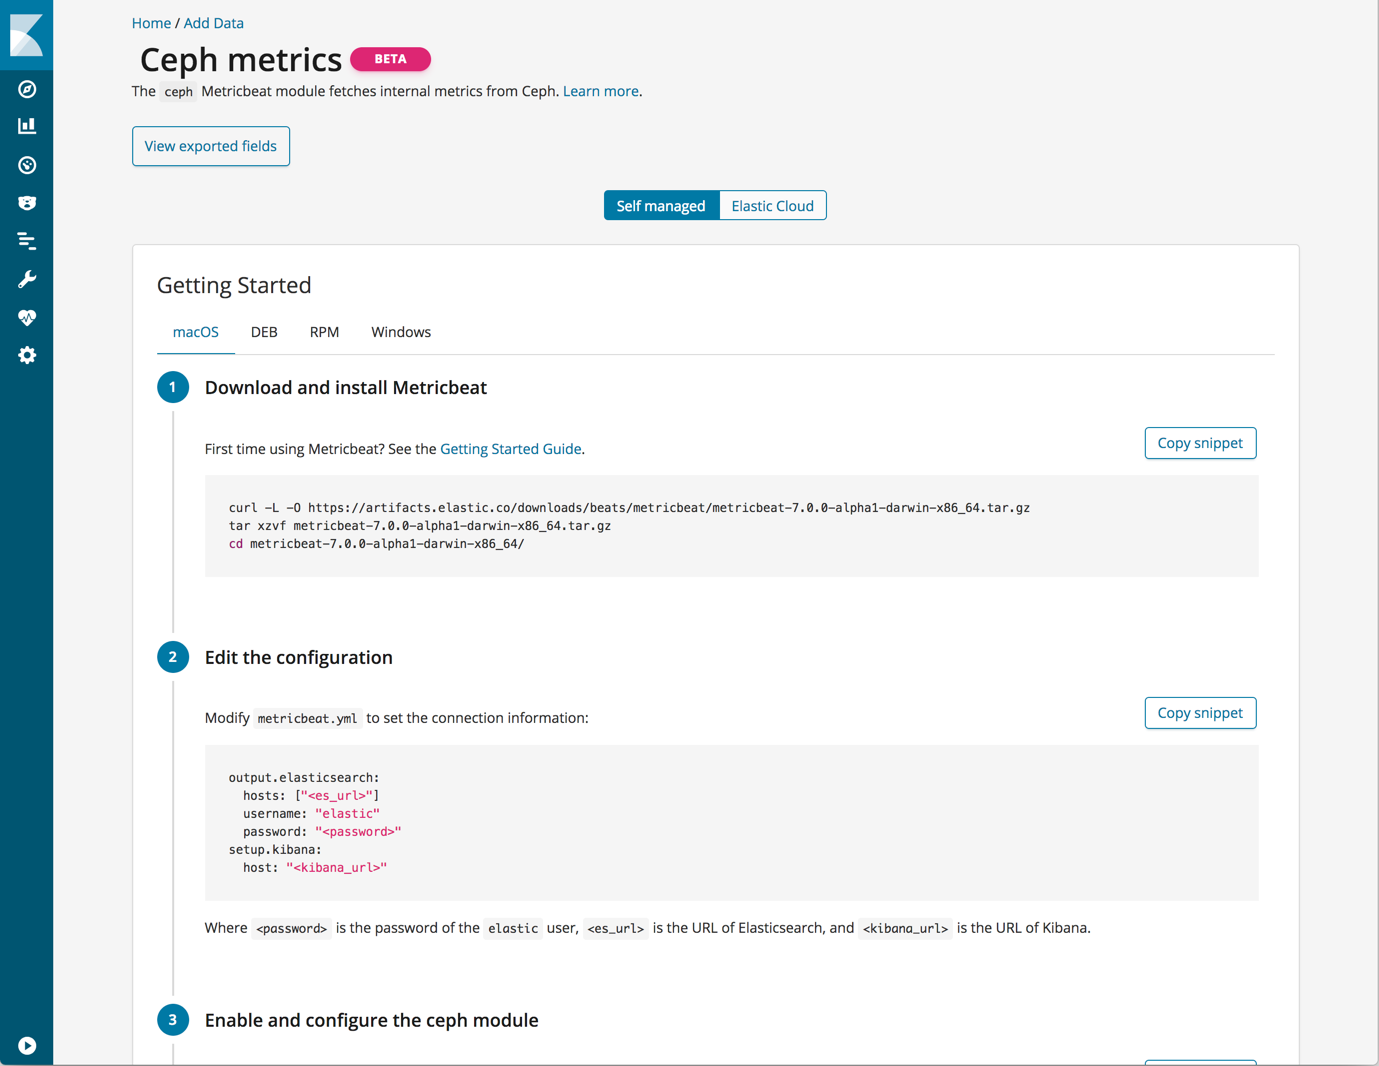
Additional tutorials for adding data to Kibana
You’ll find new Beta tutorials on the Add Data page. The majority of these tutorials are for Metricbeat modules that fetch metrics from services. They include the Beta label to indicate that they are a pre-release of the software.
To access the tutorials, go to the Kibana home page. In Add Data to Kibana, find the data type you’re interested in and click its button to view a list of available tutorials.
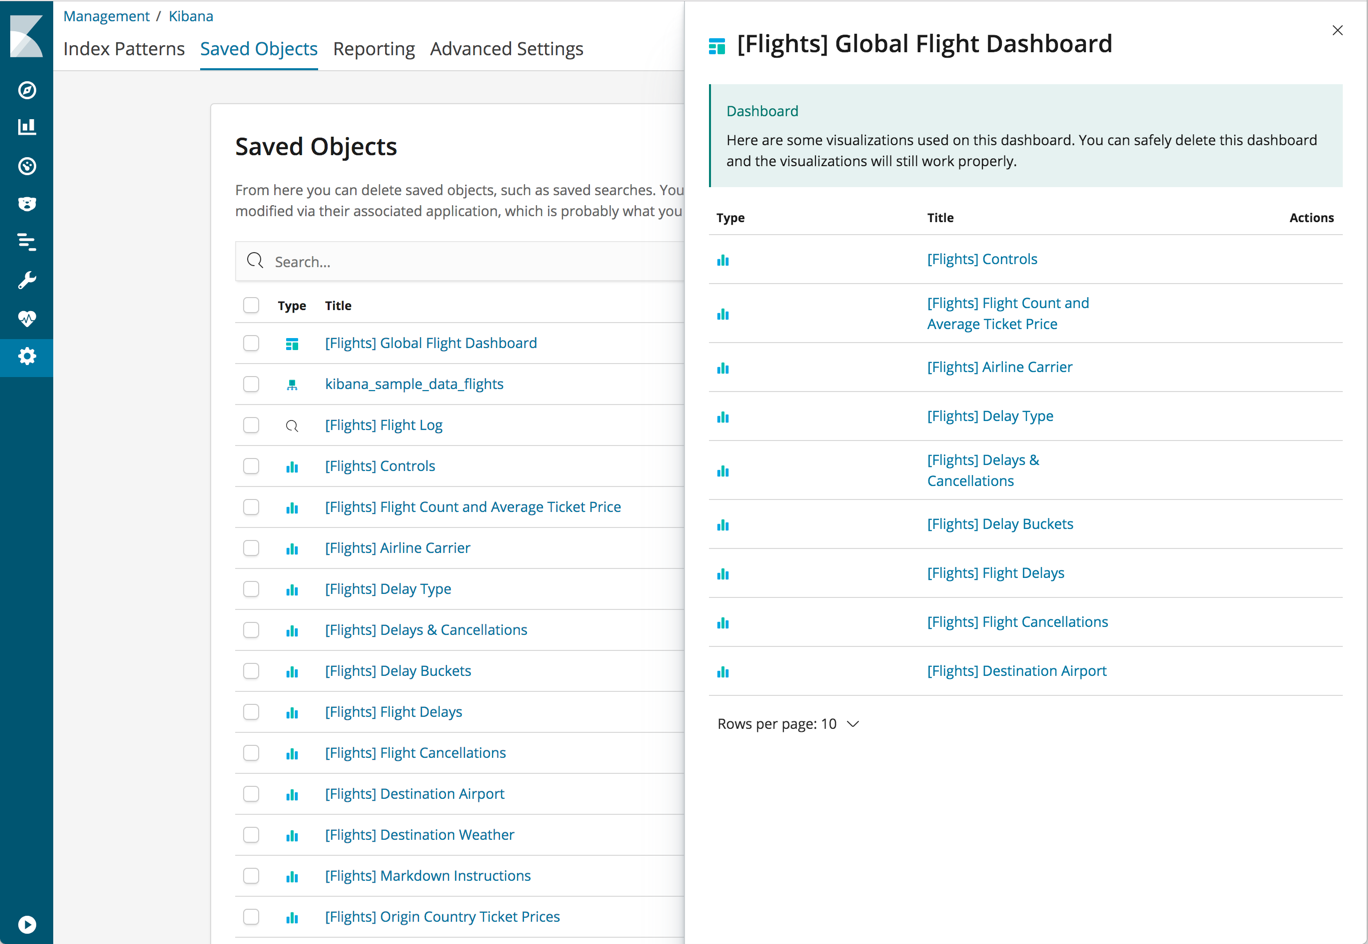
Saved Objects design refresh
Saved Objects in Management has a new look. The updated page provides the same features in terms of filtering, importing, exporting, and deleting of saved objects, plus three main improvements:
- You can now import and export index patterns.
- Importing saved objects has a more user-friendly workflow.
- A new Relationship view allows you to view how other objects use an object, so you know the impact of deleting it.
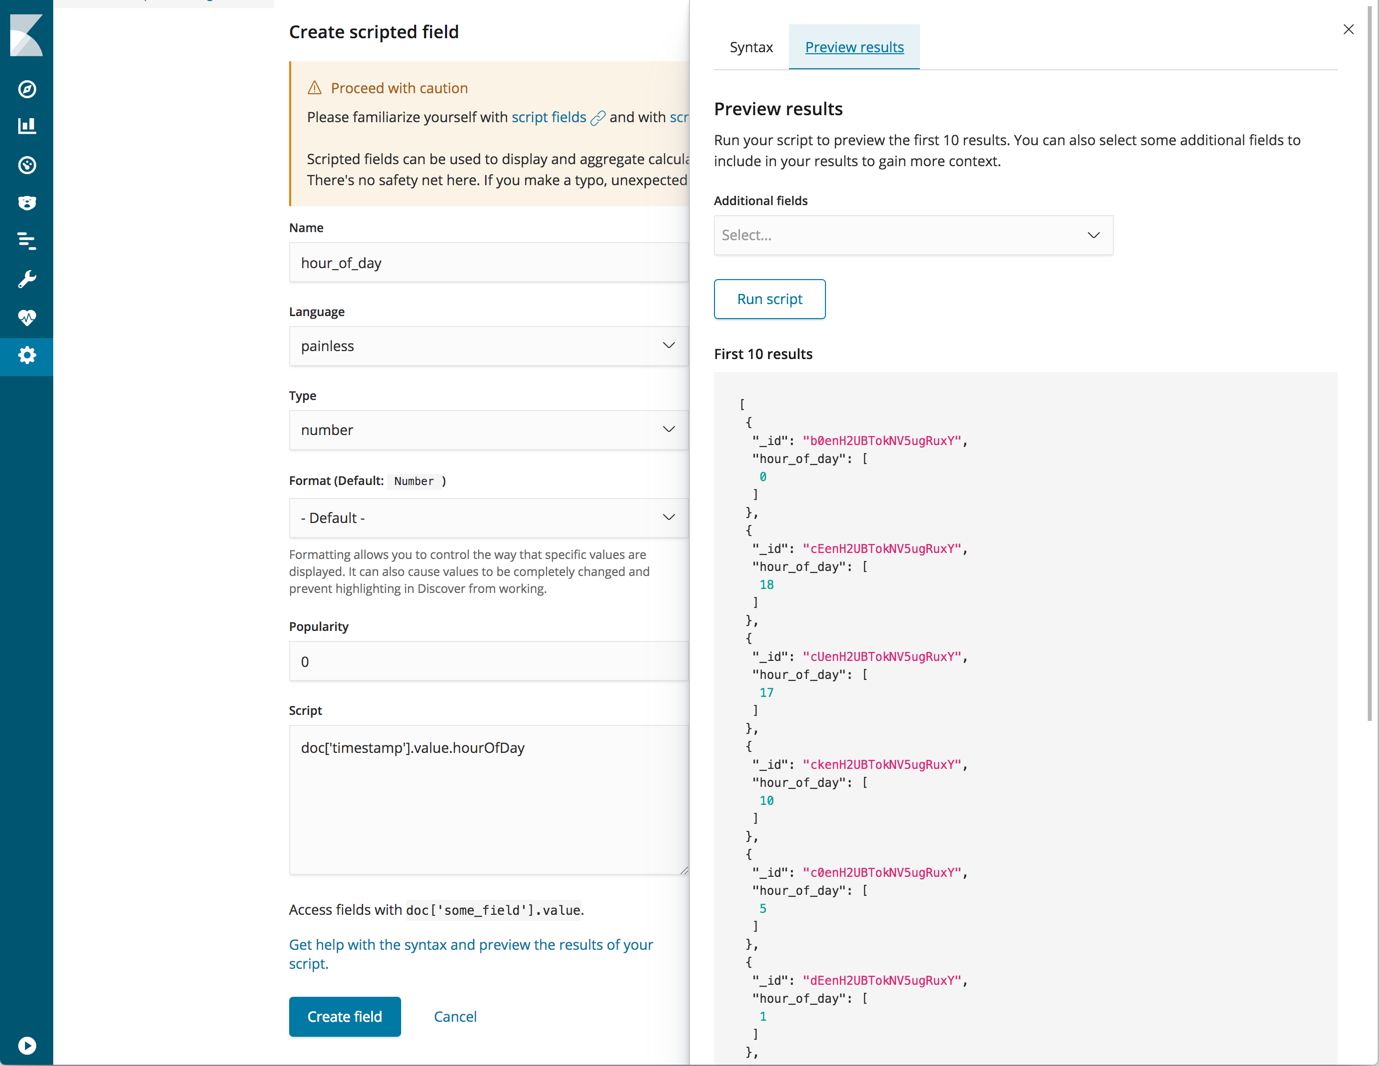
Preview your scripted fields
Index patterns in Management now allows you to test run a script to see if your scripted fields work as intended. If your results require more context, you can easily include more fields in the test run.
To try out this feature, open Index patterns > Scripted fields. Add or edit a scripted field and click Get help with syntax and preview the results or your script.
Scripts are validated on save. You can’t save a script that won't compile.
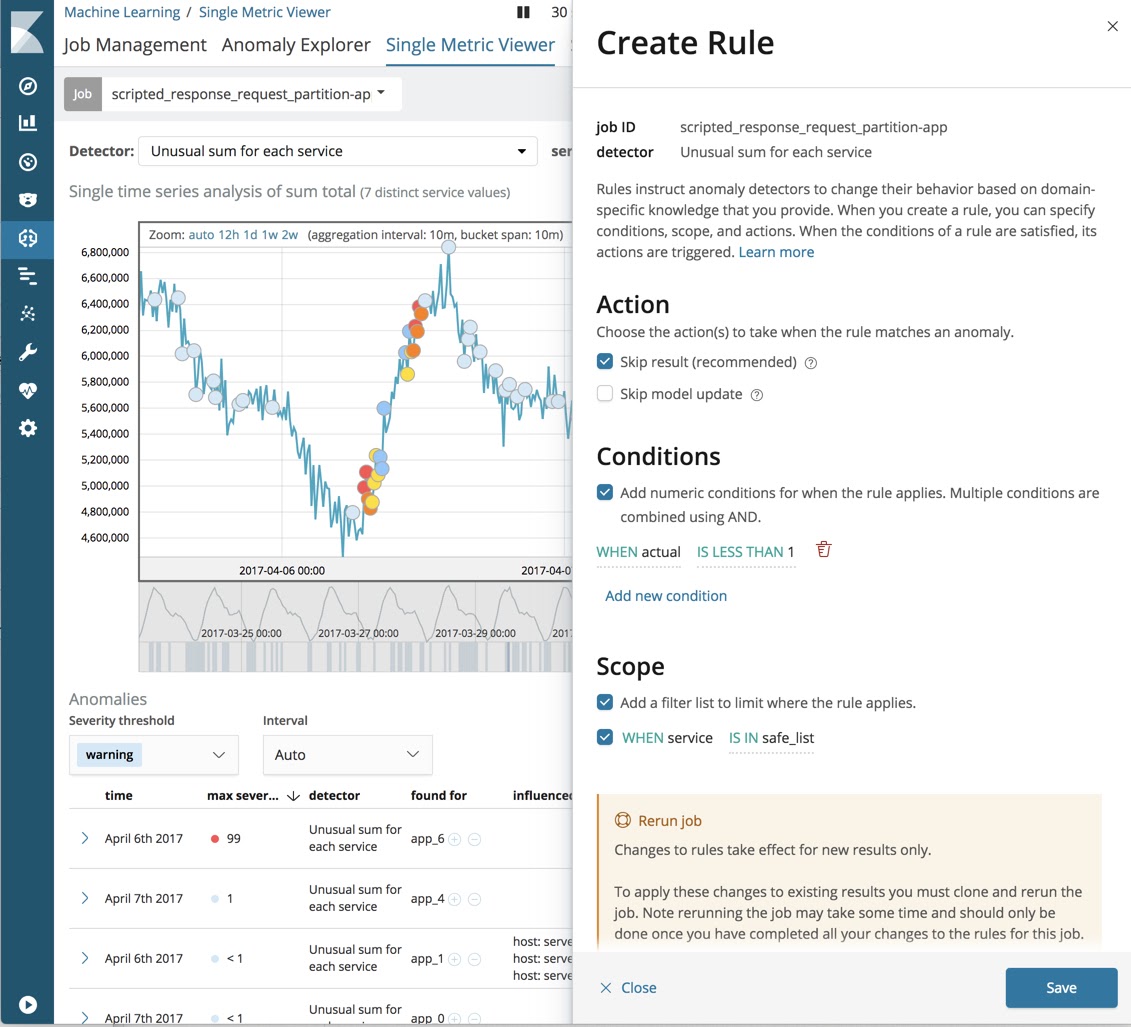
Custom rules for fine tuning machine learning results
If you want to fine tune your machine learning results (for example, to skip anomalies related to certain servers), you can now create custom rules in Kibana. Custom rules instruct anomaly detectors to change their behavior based on domain-specific knowledge that you provide. See machine learning custom rules.
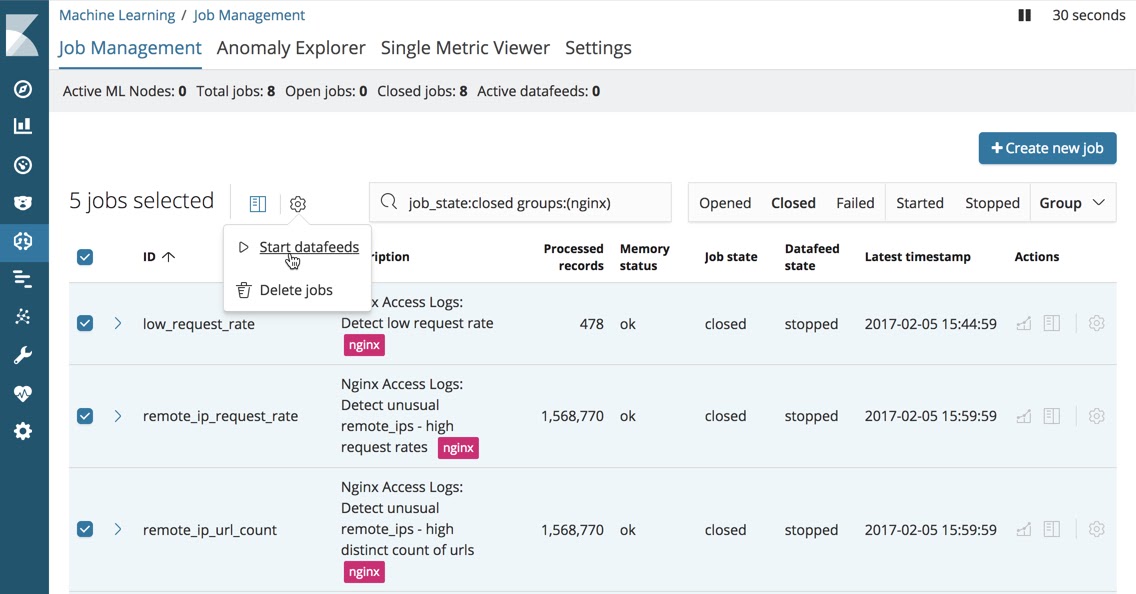
Improved usability for managing machine learning jobs
The Machine Learning > Job Management page has a new look, which comes with better searching, filtering, and multi-select options, enabling you to manage multiple jobs with fewer clicks.
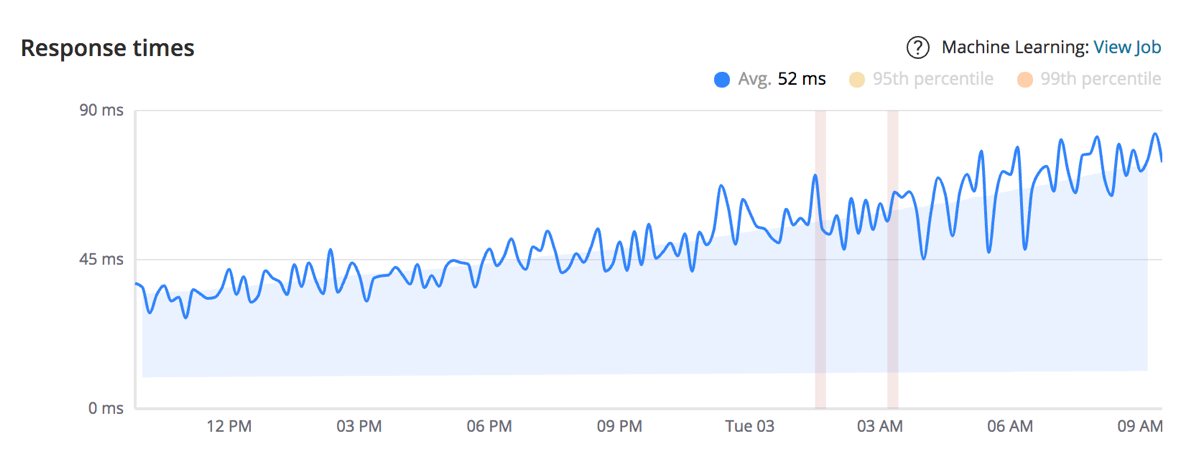
Response time anomalies with machine learning in APM
The APM UI now integrates with machine learning to show anomalies in response times on transactions. This makes catching unexpected behavior in your services much easier by annotating critical anomalies on top of the response times graph. It’s a one-click setup in the APM UI to get the job running. Please note that the feature is beta in 6.4.
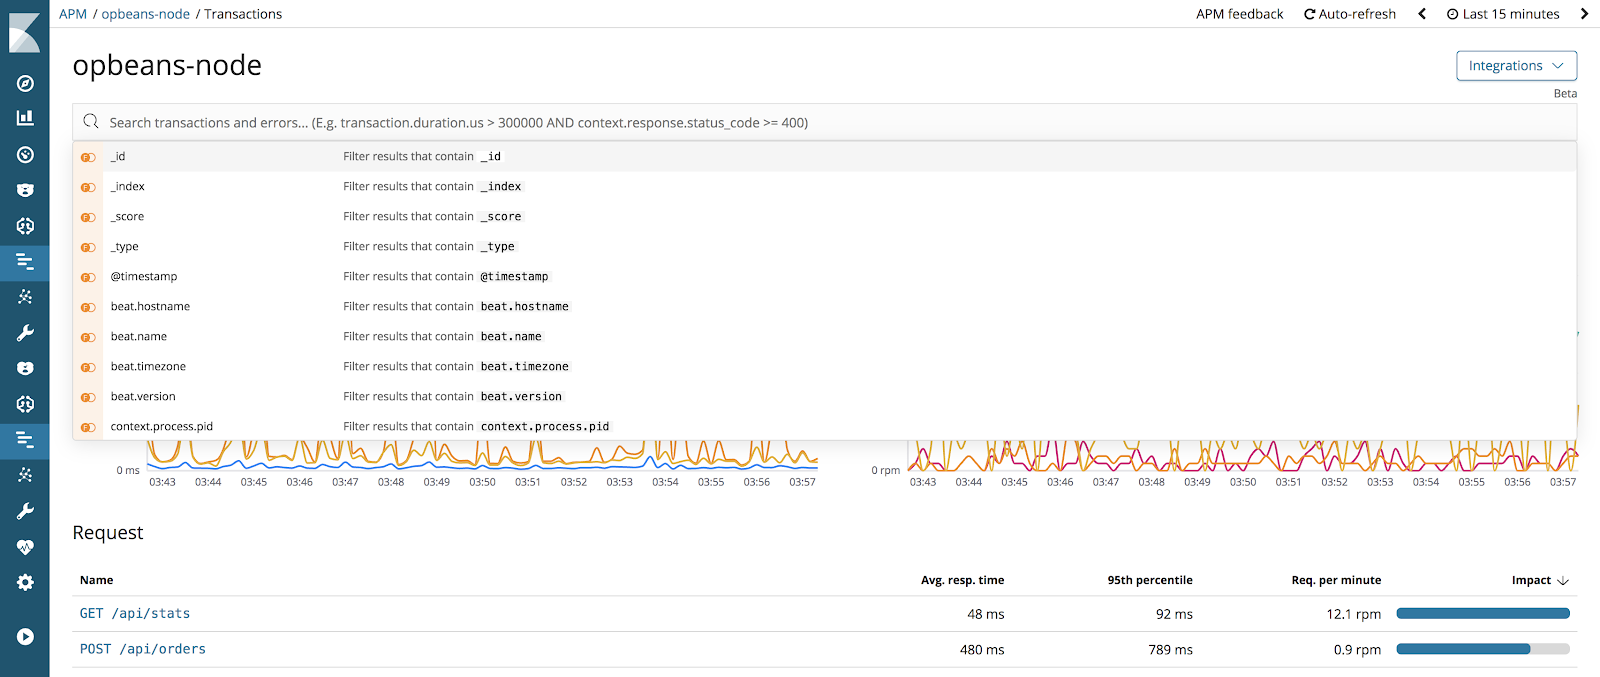
New query bar for searching and filtering APM data
Adding a query will instantly apply to the data shown in graphs and tables, making the scope of the data immediately more focused. It comes with a handy autocomplete that helps find the fields and even provides suggestions to the data they include. This way you can easily filter for transaction response times higher than 2000 ms, a particular user ID, or even a response status code. Please note that the feature is beta in 6.4.
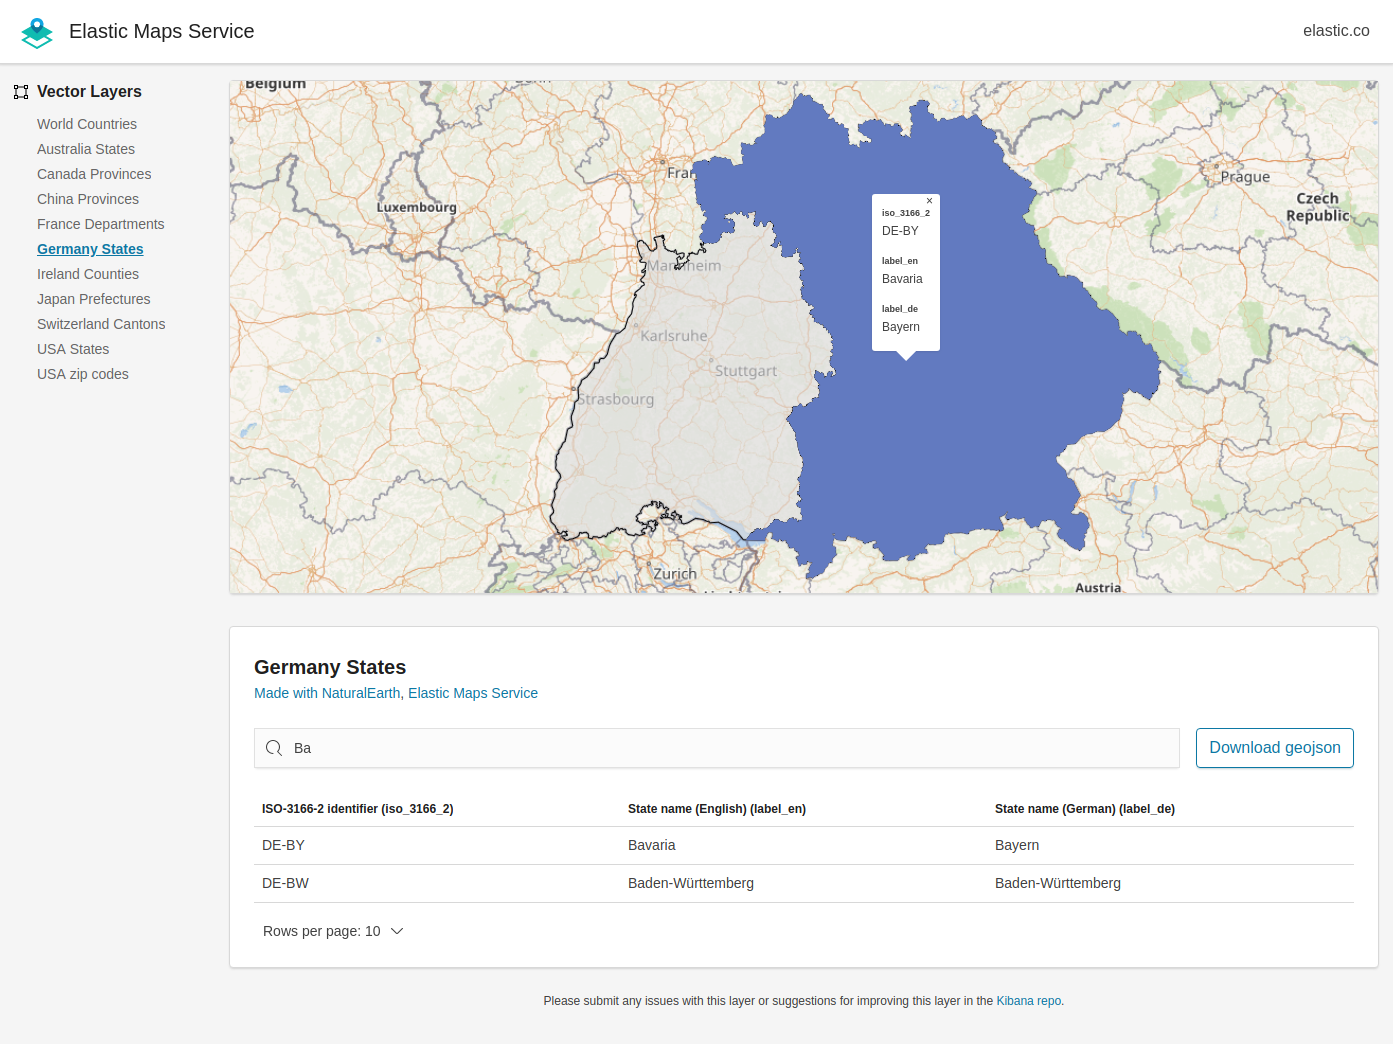
Landing page for Elastic Maps Service
The Elastic Maps Service powers all geospatial visualizations for Kibana by serving up basemaps tiles and vector boundary layers, key features that are essential for visualizing geodata. The new landing page allows you to preview the data that is published by Elastic Maps Service, either as a map or as data.
You can do a text search for feature properties, or use your mouse to see the available properties for each feature. You can also use the landing page to download the vector data that is hosted by the Elastic Maps Service.
Apply Vega filters to dashboard context
Vega now allows modifying filters and the time range in Kibana, by adding utility functions, that can be called in your signal handlers. Check the PR description for a description of the functions.
Experimental API docs
This release adds documentation for these experimental APIs:
- The Kibana role management API enables you to control access to Kibana features and saved objects.
- The Logstash configuration management API allows you to programmatically integrate with the Logstash configuration management feature.
Kibana also provides documentation for the saved objects API, which allows you to manage Kibana saved objects, including dashboards, visualizations, and index patterns.