Detections (beta)edit
This functionality is in beta and is subject to change. The design and code is less mature than official GA features and is being provided as-is with no warranties. Beta features are not subject to the support SLA of official GA features.
The SIEM Detections feature automatically searches for threats and creates signals when they are detected. Signal detection rules define the conditions for creating signals. Additionally, you can use the Kibana Alerting and Actions framework to send notifications via other systems, such as email and Slack, when signals are generated.
To use Kibana Alerting for signal notifications, you need the appropriate license.
The SIEM app comes with prebuilt rules that search for suspicious activity on your network and hosts. For information on how to optimize the prebuilt rules, see Tuning prebuilt detection rules. You can also create your own rules.
You can manage detection rules and signals via the UI or the Detections API.
To make sure you can access Detections and manage rules, see Detections configuration and index privilege prerequisites.
Terminologyedit
- Rules
-
Perform background tasks to detect suspicious activity. There are two types of rules:
- Query-based rules search indices for documents that match their queries at scheduled intervals. When a document matches, a signal is created.
- Machine learning rules create a signal when a machine learning job discovers an anomaly score above a rule’s defined threshold.
- Signals
-
Always refer to SIEM produced detections. Signals are never received from external systems. When a rule’s conditions are met, the SIEM app writes one or more signals to an Elasticsearch
signalsindex.Signal indices are created for each Kibana space. The naming convention is:
.siem-signals-<space name>. For the default space, the signals index is named.siem-signals-default. - Alerts and events
- Always refer to data the SIEM app receives from external systems, such as Elastic Endpoint and Suricata.
- Actions
- Used to send notifications via other systems when a signal is created, such as email, Slack, PagerDuty, and Webhook.
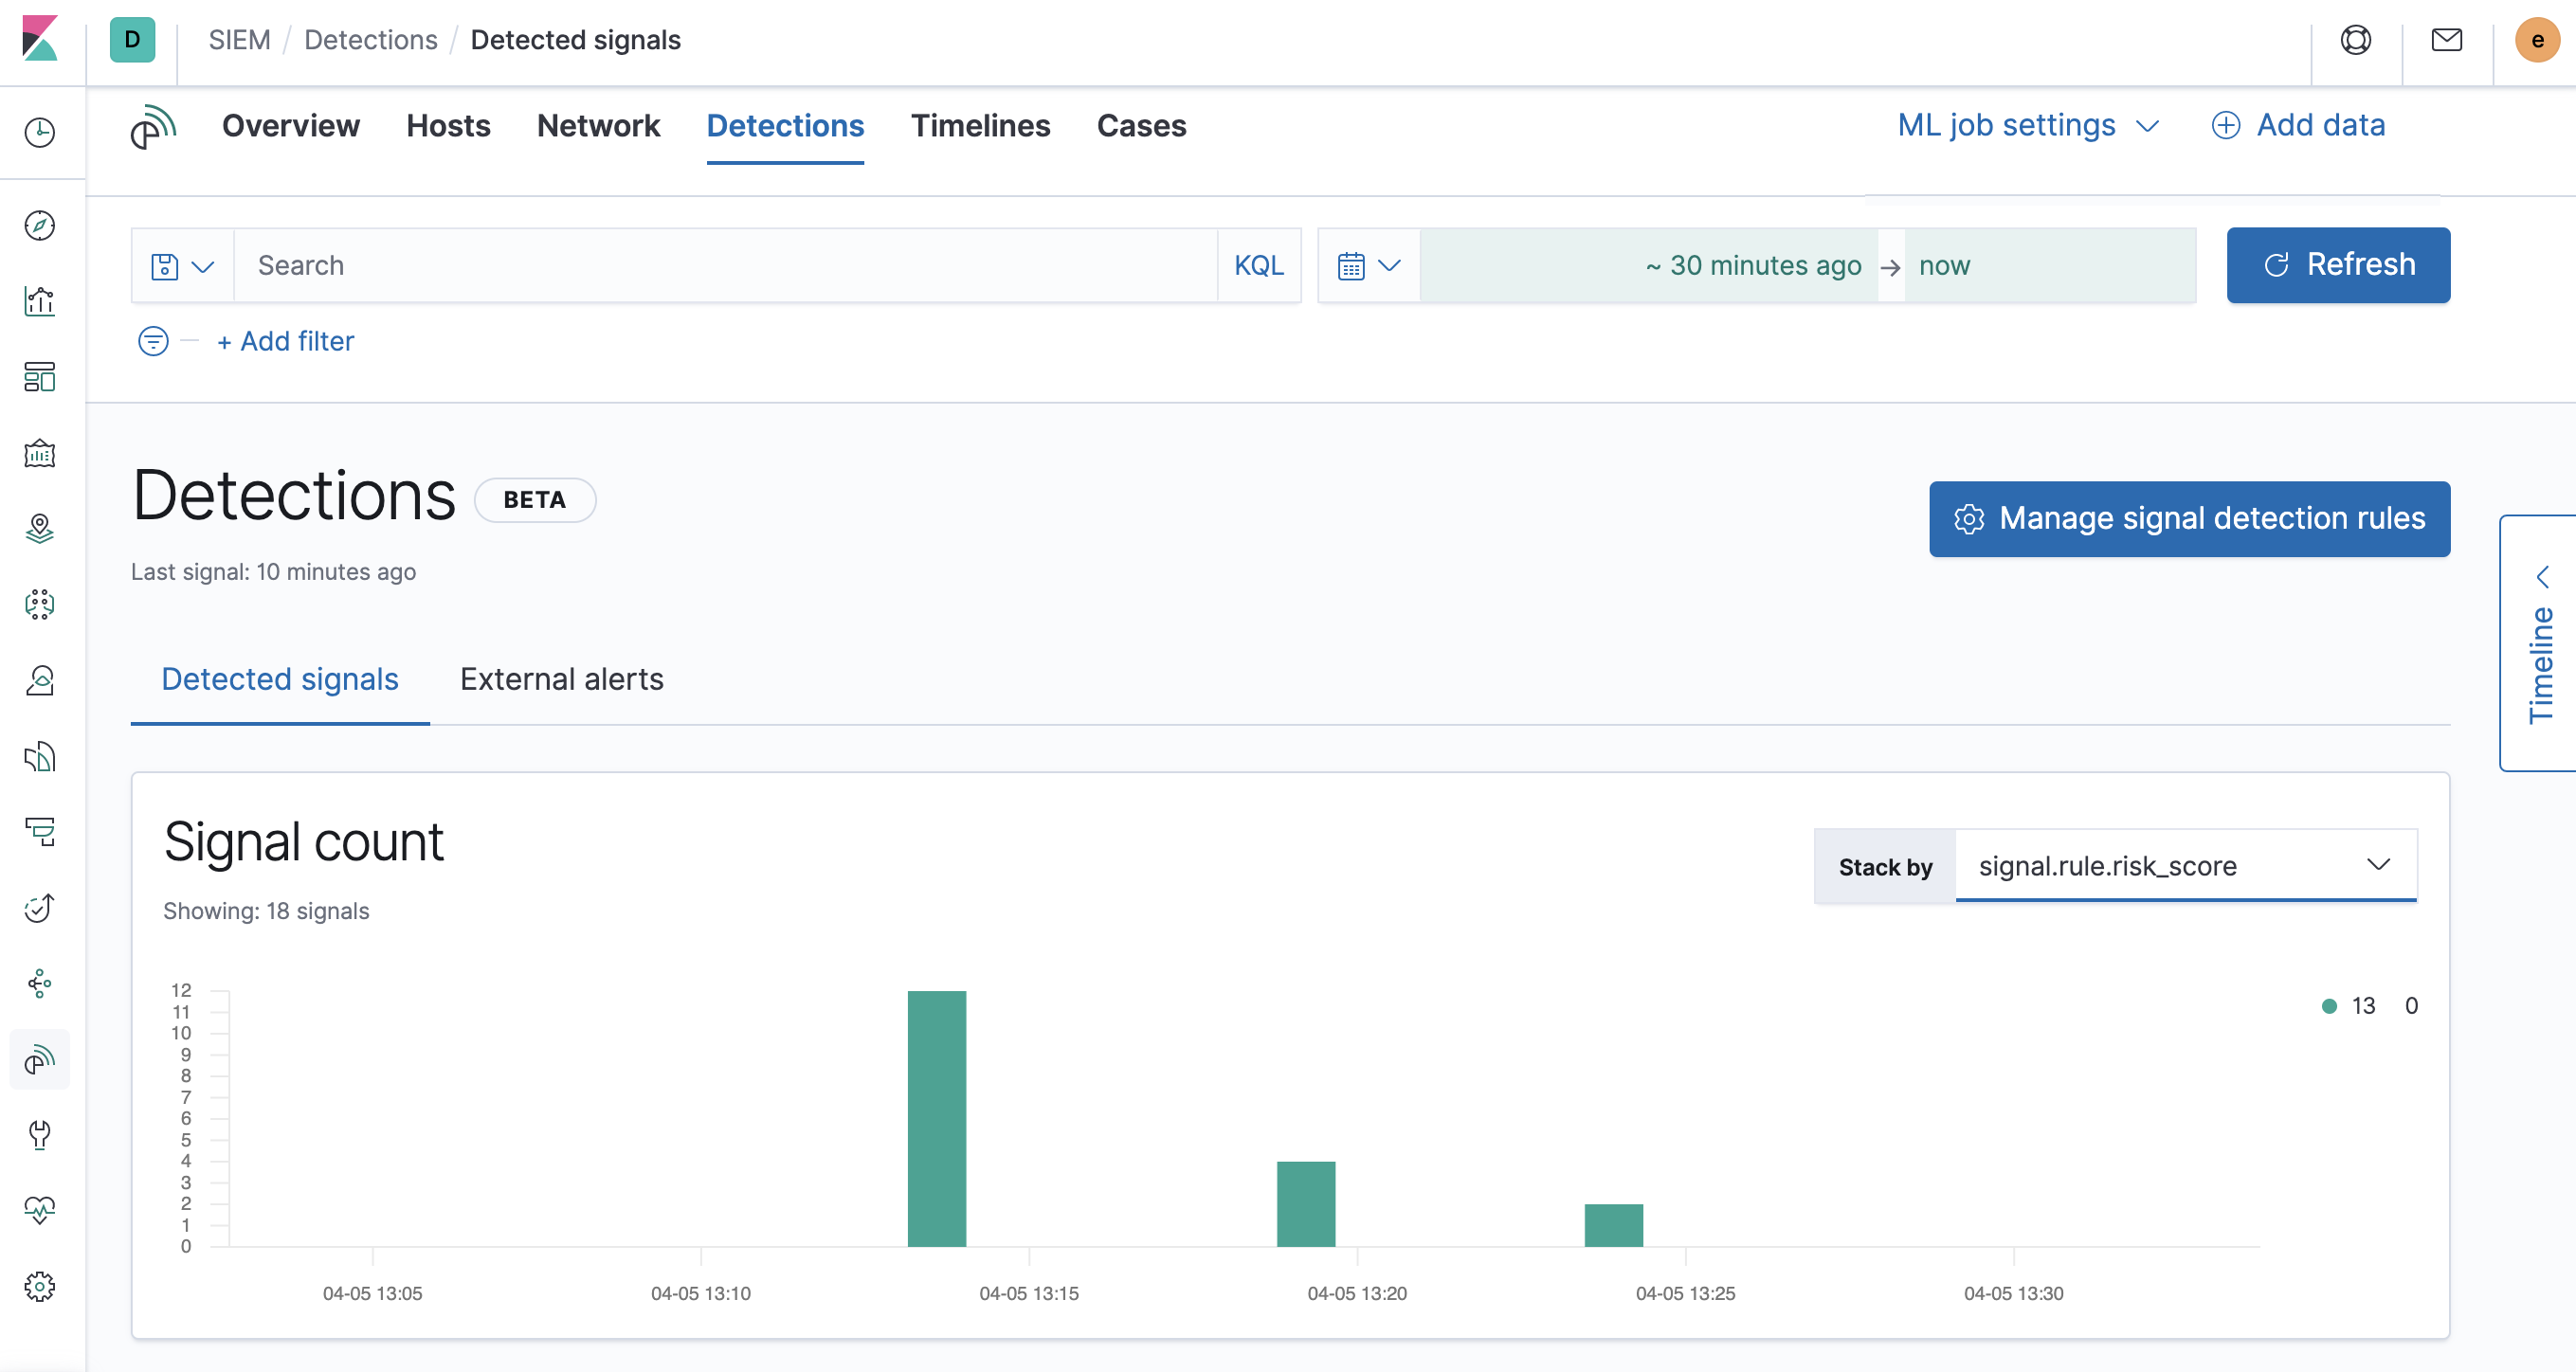
Signals and external alertsedit
The Detections page displays all signals and alerts. To view signals created by a rule, you can:
-
Filter for a specific rule in the KQL bar (for example,
signal.rule.name :"SSH (Secure Shell) from the Internet"). - View signals in the Rule details page (click Manage signal detection rules → rule name in the All rules table).
KQL autocomplete for .siem-signals-* indices is available on the
Detections and Rule details pages, and in Timeline when either All events
or Signal events is selected.
To view alerts from external data shippers, click External alerts.
Open and close signalsedit
You can close signals to indicate they do not need any further investigation. By default, the All signals table displays open signals. To view closed signals, click Closed signals.
To open and close signals, either:
- Click the Close/Open signal icon.
- Select the signals you want to open or close and then click Close/Open selected.
Investigate signals in Timelineedit
To investigate a signal in Timeline, click the Investigate in timeline icon.
If the rule that generated the signal uses a timeline template, when you investigate the signal in Timeline, the following dropzone query values are replaced with their corresponding signal values:
-
host.name -
host.hostname -
host.domain -
host.id -
host.ip -
client.ip -
destination.ip -
server.ip -
source.ip -
network.community_id -
user.name -
process.name
Example
The timeline template used in the rule has this dropzone query:
host.name: "Linux-LiverpoolFC". When signals generated by the rule are
investigated in Timeline, the host.name value is replaced with the signal’s
host.name value. If the signal’s host.name value is Windows-ArsenalFC,
the timeline dropzone query is host.name: "Windows-ArsenalFC".
For information on how to add timeline templates to rules, see Create a new rule.
Detections configuration and index privilege prerequisitesedit
If you are using an on-premises Elastic Stack deployment:
- HTTPS must be configured for communication between Elasticsearch and Kibana.
-
In the
elasticsearch.ymlconfiguration file, set thexpack.security.enabledsetting totrue. For more information, see Configuring Elasticsearch and Security settings in Elasticsearch. -
In the
kibana.ymlconfiguration file, add thexpack.encryptedSavedObjects.encryptionKeysetting with any alphanumeric value of at least 32 characters. For example:xpack.encryptedSavedObjects.encryptionKey: 'fhjskloppd678ehkdfdlliverpoolfcr'
For all deployments (on-premises and hosted):
-
To view signals and detection rules, you must have at least:
-
readpermissions for the.siem-signals-<space name>index, where<space name>is the name of the Kibana space you are using to view Detections (see Indices privileges). -
Kibana space
Readprivileges for theSIEMfeature (see Feature access based on user privileges).
-
-
To create and modify detection rules, you must have:
-
Kibana space
Allprivileges for theSIEMfeature (see Feature access based on user privileges). -
Write permissions for the
.siem-signals-<space name>index, such ascreatecreate_doc,write,index, andall(see Indices privileges).
-
Kibana space
Resolve UI error messagesedit
Depending on your privileges and whether a .siem-signals-<space name> index
has already been created for the Kibana space, you might see an error message
when you try to open the Detections page.
Let’s set up your detection engine
If you see this message, a user with these privileges must visit the Detections page before you can view signals and rules:
-
The
managecluster privilege (see Elasticsearch security privileges). -
The
create_indexindex privilege (see Elasticsearch security privileges). -
Kibana space
Allprivileges for theSIEMfeature (see Feature access based on user privileges).
For on-premises Elastic Stack deployments only, this message may be displayed
when the
xpack.encryptedSavedObjects.encryptionKey
setting has not been added to the kibana.yml file.
Detection engine permissions required
If you see this message, you do not have the required privileges to view the Detections page, and you should contact your Kibana administrator.
For on-premises Elastic Stack deployments only, this message may be
displayed when the xpack.security.enabled
setting is not enabled in the elasticsearch.yml file.