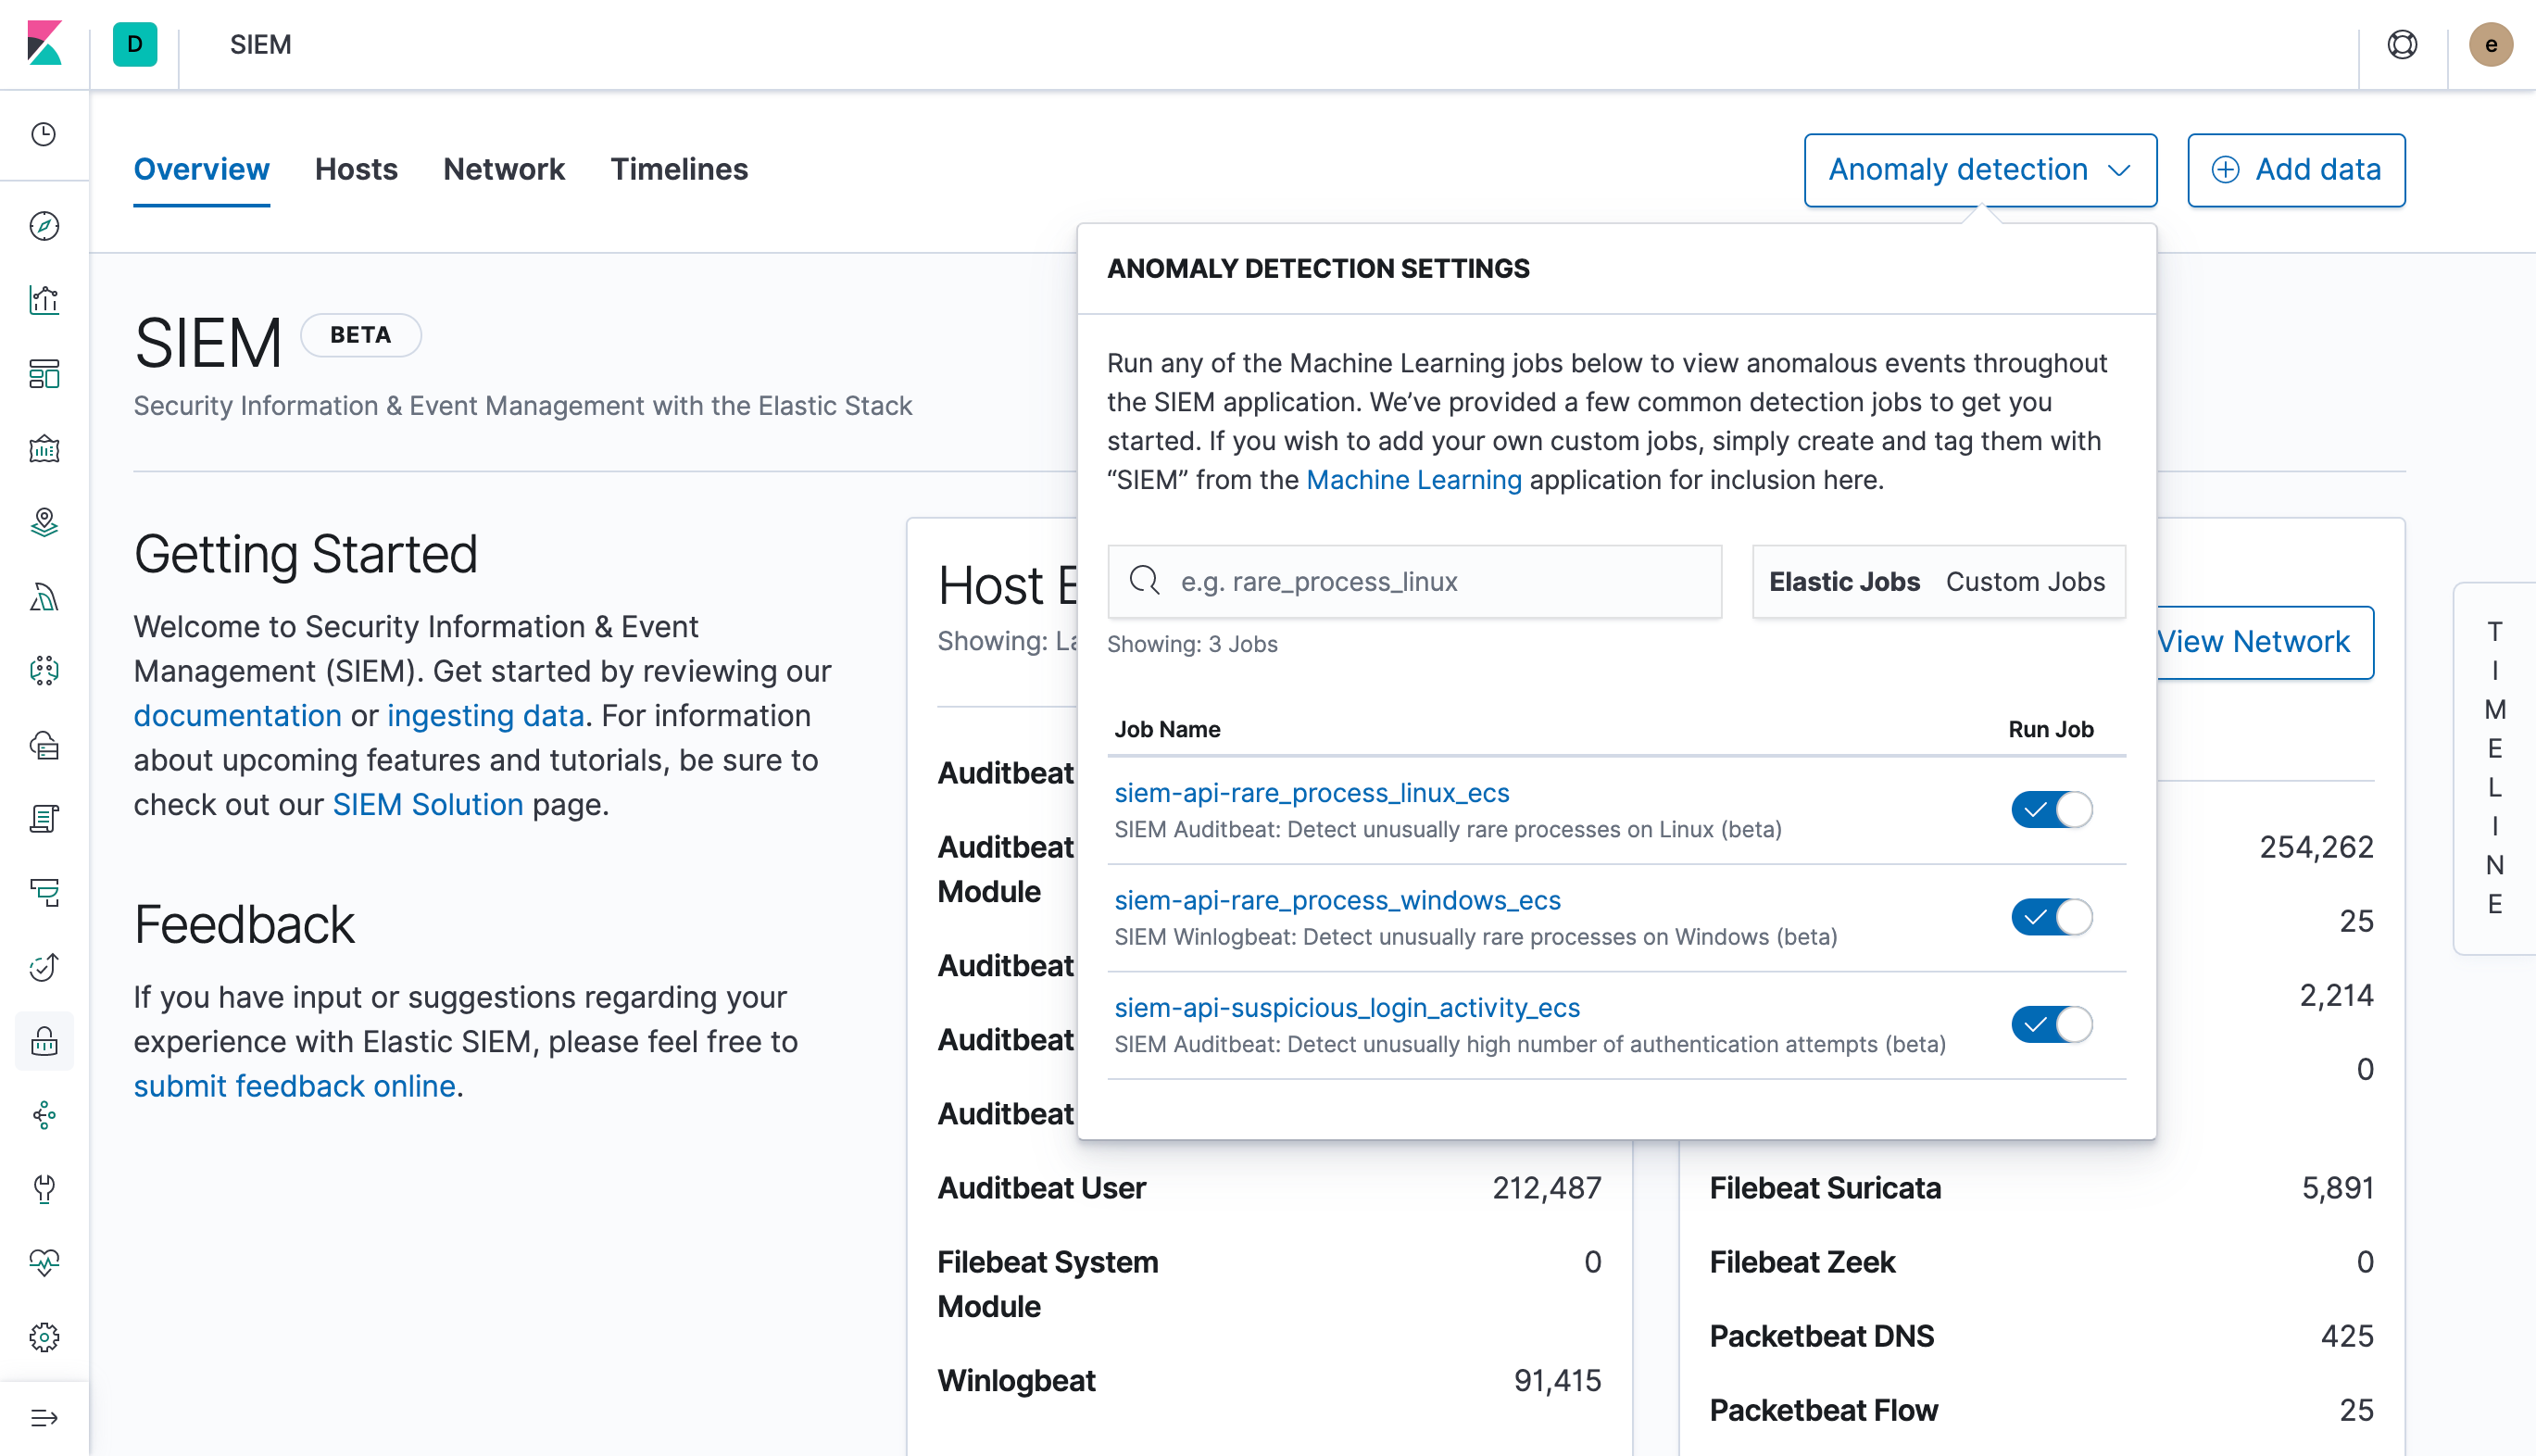
Anomaly Detection with Machine Learningedit
For Free Trial
and Platinum License deployments,
Machine Learning functionality is available throughout the SIEM app. You can
view the details of detected anomalies within the Anomalies table widget
shown on the Hosts, Network and associated Details pages, or even narrow to
the specific daterange of an anomaly from the Max Anomaly Score details in
the overview of the Host and IP Details pages. Each of these interfaces also
offer the ability to drag and drop details of the anomaly to Timeline, such
as the Entity itself, or any of the associated Influencers.

Manage machine learning jobsedit
For users with the ml_admin role, the Anomaly Detection interface within
the main navigation header can be used for for viewing, starting, and stopping
SIEM Machine Learning Jobs.
Prebuilt Jobsedit
The SIEM app ships with prebuilt Machine Learning Jobs for detecting anomalies.
If your environment is configured with the appropriate indices (auditbeat-*
and winlogbeat-*) via Kibana → Management → Index Patterns, the jobs will be
installed on page load, and will be displayed within the Anomaly Detection
interface.
-
SIEM Auditbeat: Detect suspicious logins and unusual processes in Auditbeat ECS data (beta)
- siem-api-suspicious_login_activity_ecs
- siem-api-rare_process_linux_ecs
-
SIEM Winlogbeat: Detect unusual processes in Winlogbeat ECS data (beta)
- siem-api-rare_process_windows_ecs
View detected anomaliesedit
To view the Anomalies table widget and Max Anomaly Score By Job details,
the user must have the ml_admin or ml_user role.
To adjust the score threshold for which anomalies are shown, you can
modify Kibana → Management → Advanced Settings → siem:defaultAnomalyScore.