Host risk scoreedit
This feature is available for Elastic Stack versions 7.16.0 and newer and requires a Platinum subscription or higher.
The host risk score feature highlights risky hosts from within your environment. It utilizes a transform with a scripted metric aggregation to calculate host risk scores based on alerts that were generated within the past five days. The transform runs hourly to update the score as new alerts are generated.
Each rule’s contribution to the host risk score is based on the rule’s risk score (signal.rule.risk_score) and a time decay factor to reduce the impact of stale alerts. The risk score is calculated using a weighted sum where rules with higher time-corrected risk scores also have higher weights. Each host risk score is normalized on a scale of 0 to 100.
Specific host attributes can boost the final risk score. For example, alert activity on a server poses a greater risk than that on a laptop. Therefore, the host risk score is 1.5 times higher if the host is a server. This boosted score is finalized after calculating the weighted sum of the time-corrected risks.
The following table shows how risk levels are applied to a host, based on the normalized risk score:
| Risk level | Host risk score |
|---|---|
Unknown |
< 20 |
Low |
20-40 |
Moderate |
40-70 |
High |
70-90 |
Critical |
> 90 |
Enable host risk scoreedit
To enable the host risk score feature, you must have alerts in your environment. If you previously enabled host risk score and are upgrading the Elastic Stack to 8.5–8.10, refer to Upgrade host risk score.
You can enable host risk score from the following places in the Elastic Security app:
- The Entity Analytics dashboard
- The Host risk tab on the Hosts page
- The Host risk tab on a host’s details page
Or, in Kibana, you can enable host risk score in Console.
To enable host risk score from the Entity Analytics dashboard:
- In the Elastic Security app, go to Dashboards → Entity Analytics.
- In the Host Risk Scores section, click Enable to install the module.
To enable host risk score from the Hosts page:
- Go to Explore → Hosts.
- Select the Host risk tab, then click Enable to install the module.

To enable host risk score from a host’s details page:
- Go to Explore → Hosts.
- Select the All hosts tab, then click a host name.
- On the details page, scroll down to the data tables, then select the Host risk tab.
- Click Enable to install the module.
To enable host risk score from Console in Kibana, open a browser window and enter the following URL:
{KibanaURL}/s/{spaceID}/app/dev_tools#/console?load_from={KibanaURL}/s/{spaceID}/internal/risk_score/prebuilt_content/dev_tool/enable_host_risk_score
If there’s existing content in Console, scroll to the bottom to find the output loaded.
If you receive an error message during the installation process, delete the host risk score module manually, then re-enable it. Refer to Troubleshooting for more information.
Upgrade host risk scoreedit
If you previously enabled host risk score and you’re upgrading to Elastic Stack version 8.11 or newer, you can upgrade to the latest risk scoring engine.
Before upgrading, note the following:
-
Since older data is not preserved, previous host risk scores will be deleted, and new scores will be created. However, if you want to retain old host risk scores, you can reindex them before upgrading. To learn how, refer to Reindex API. New data will be stored in the
ml_host_risk_score_<space-id>andml_host_risk_score_latest_<space-id>indices. -
You must edit your Kibana user settings and remove the
xpack.securitySolution.enableExperimental:['riskyHostsEnabled']feature flag.
After this is done, you can proceed with upgrading the host risk score feature from any of the following places in the Elastic Security app:
- The Entity Analytics dashboard
- The Host risk tab on the Hosts page
- The Host risk tab on a host’s details page
After you enable or upgrade host risk score, you might get a message that says, "No host risk score data available to display." To verify that the transform that installs the host risk score module is picking up data, refer to Verify that host risk score data installed successfully.
If you receive an error message during the upgrade process, delete the host risk score module manually, and then re-enable it. Refer to Troubleshooting for more information.
Analyze host risk score dataedit
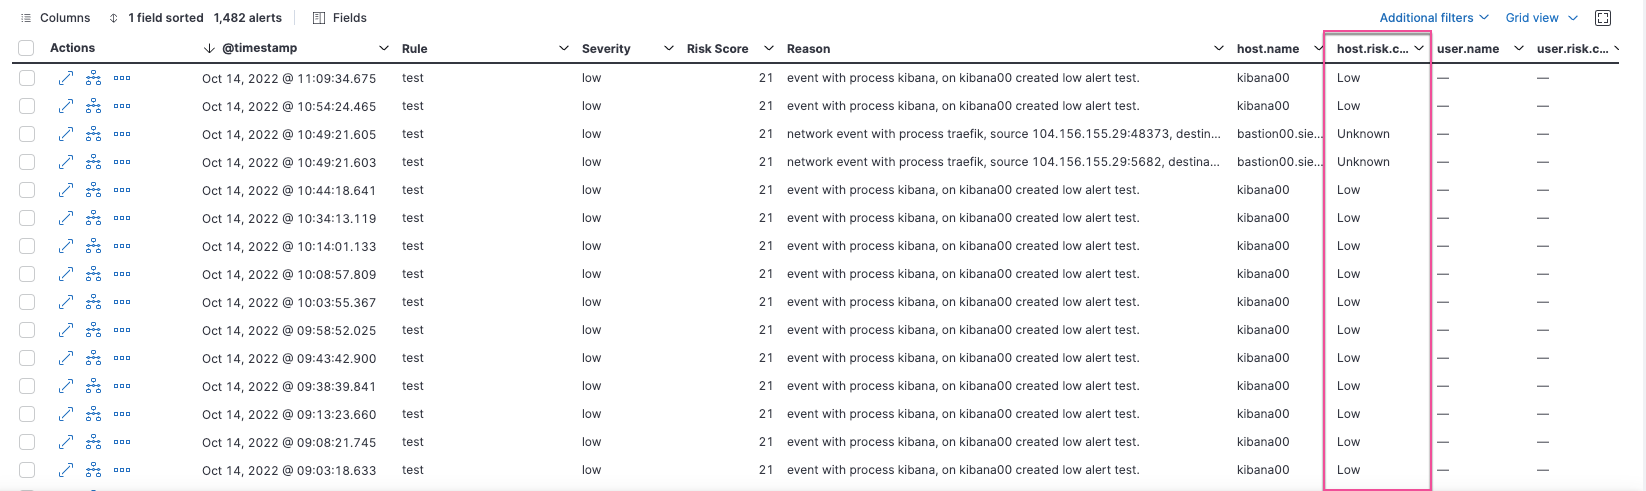
It is recommended you analyze hosts with the highest risk scores first — those in the Critical and Moderate categories. Host risk score data appears in the following places in the Elastic Security app:
The host.risk.calculated_level column in the Alerts table:
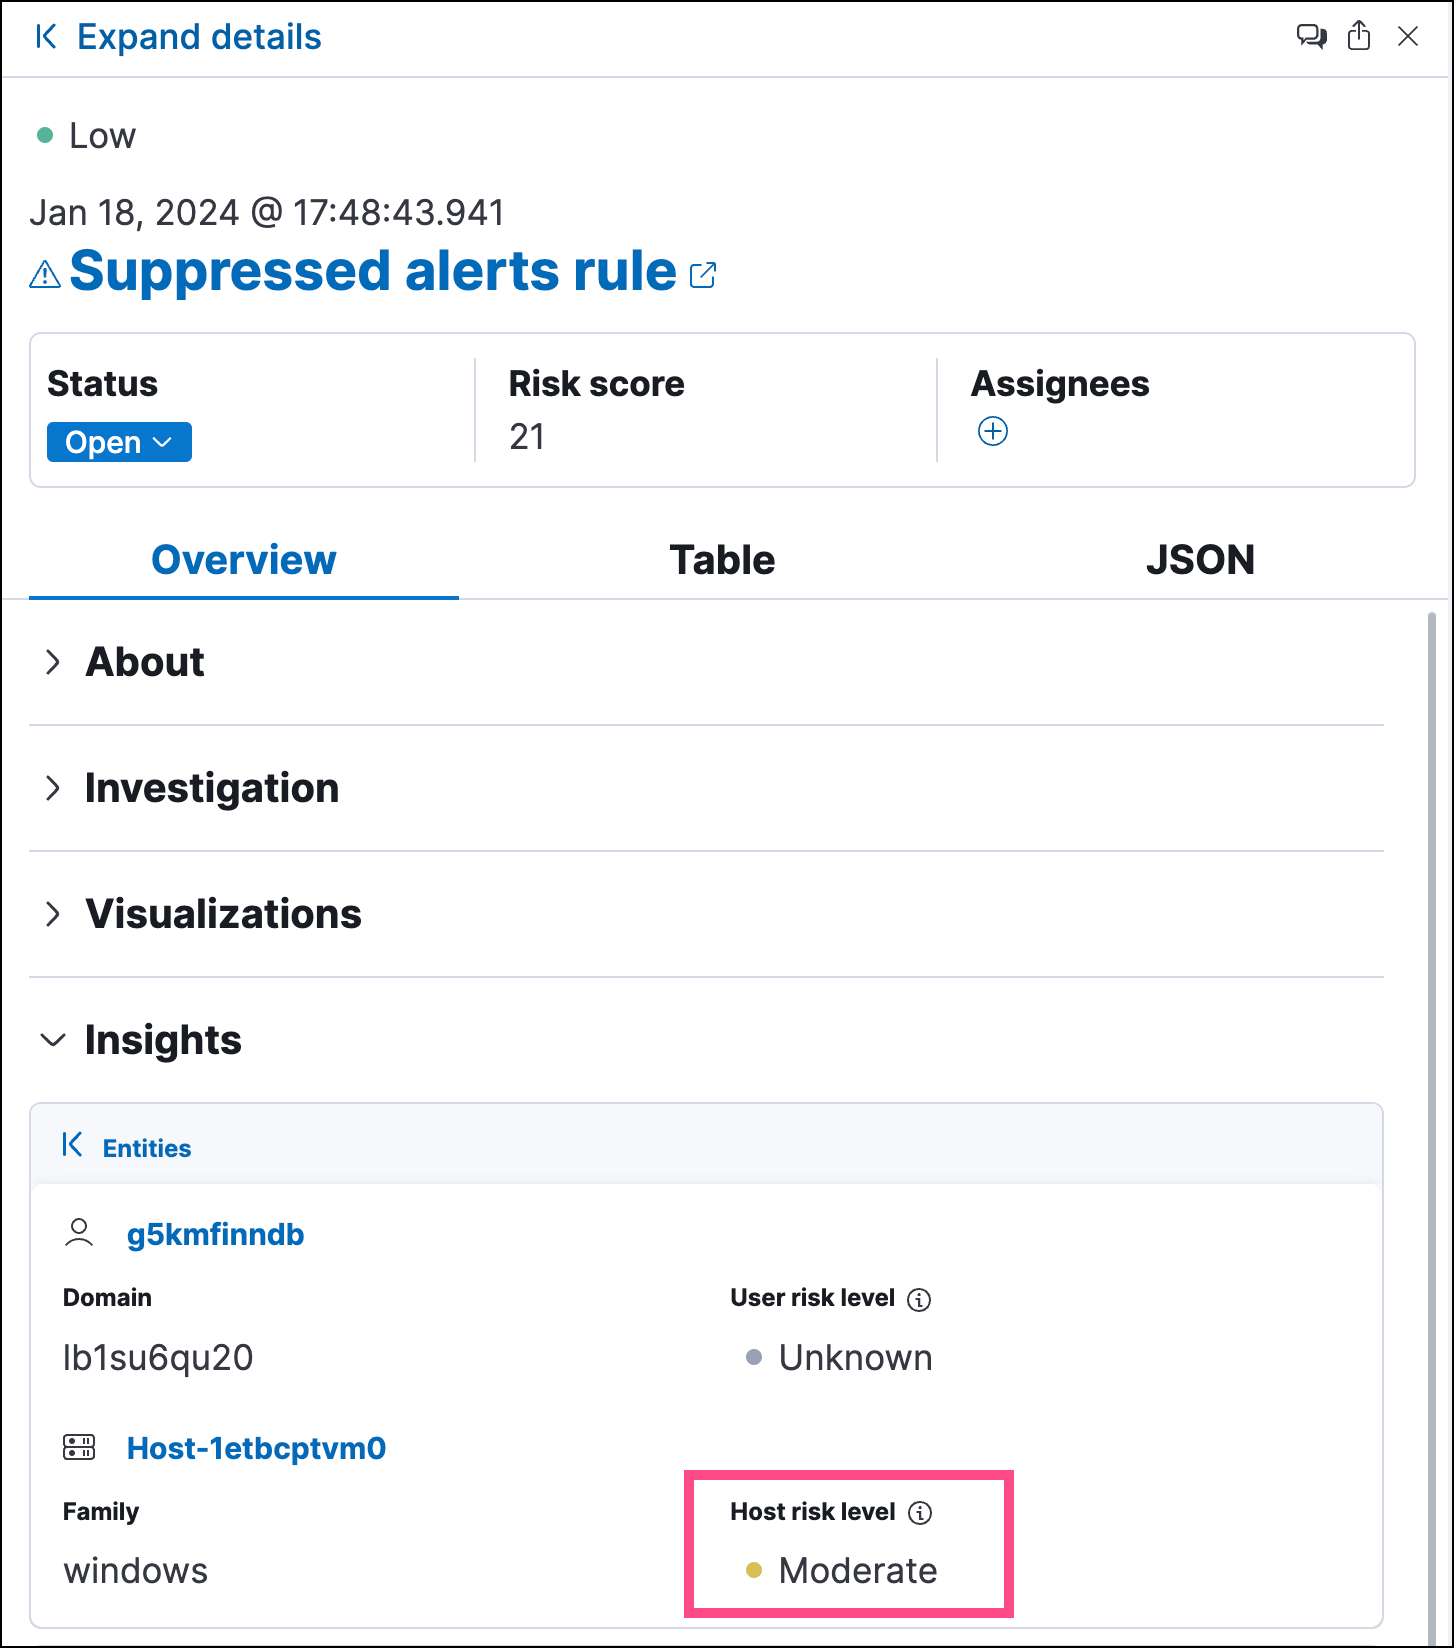
The Insights → Entities section on the Overview tab within the alert details flyout:
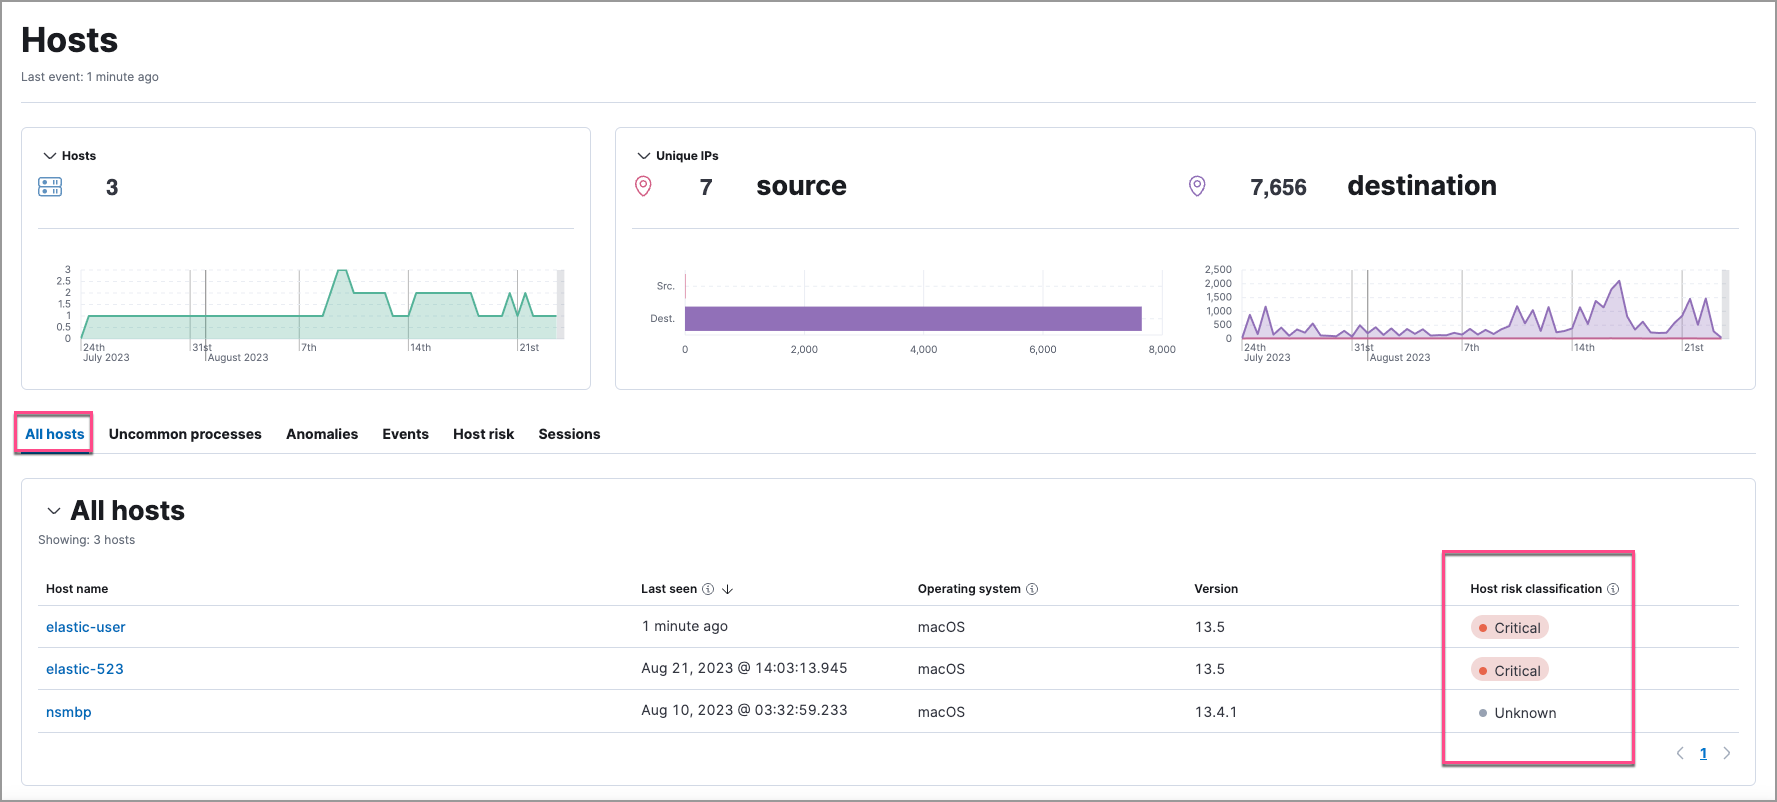
The Host risk classification column in the All hosts table on the Hosts page:
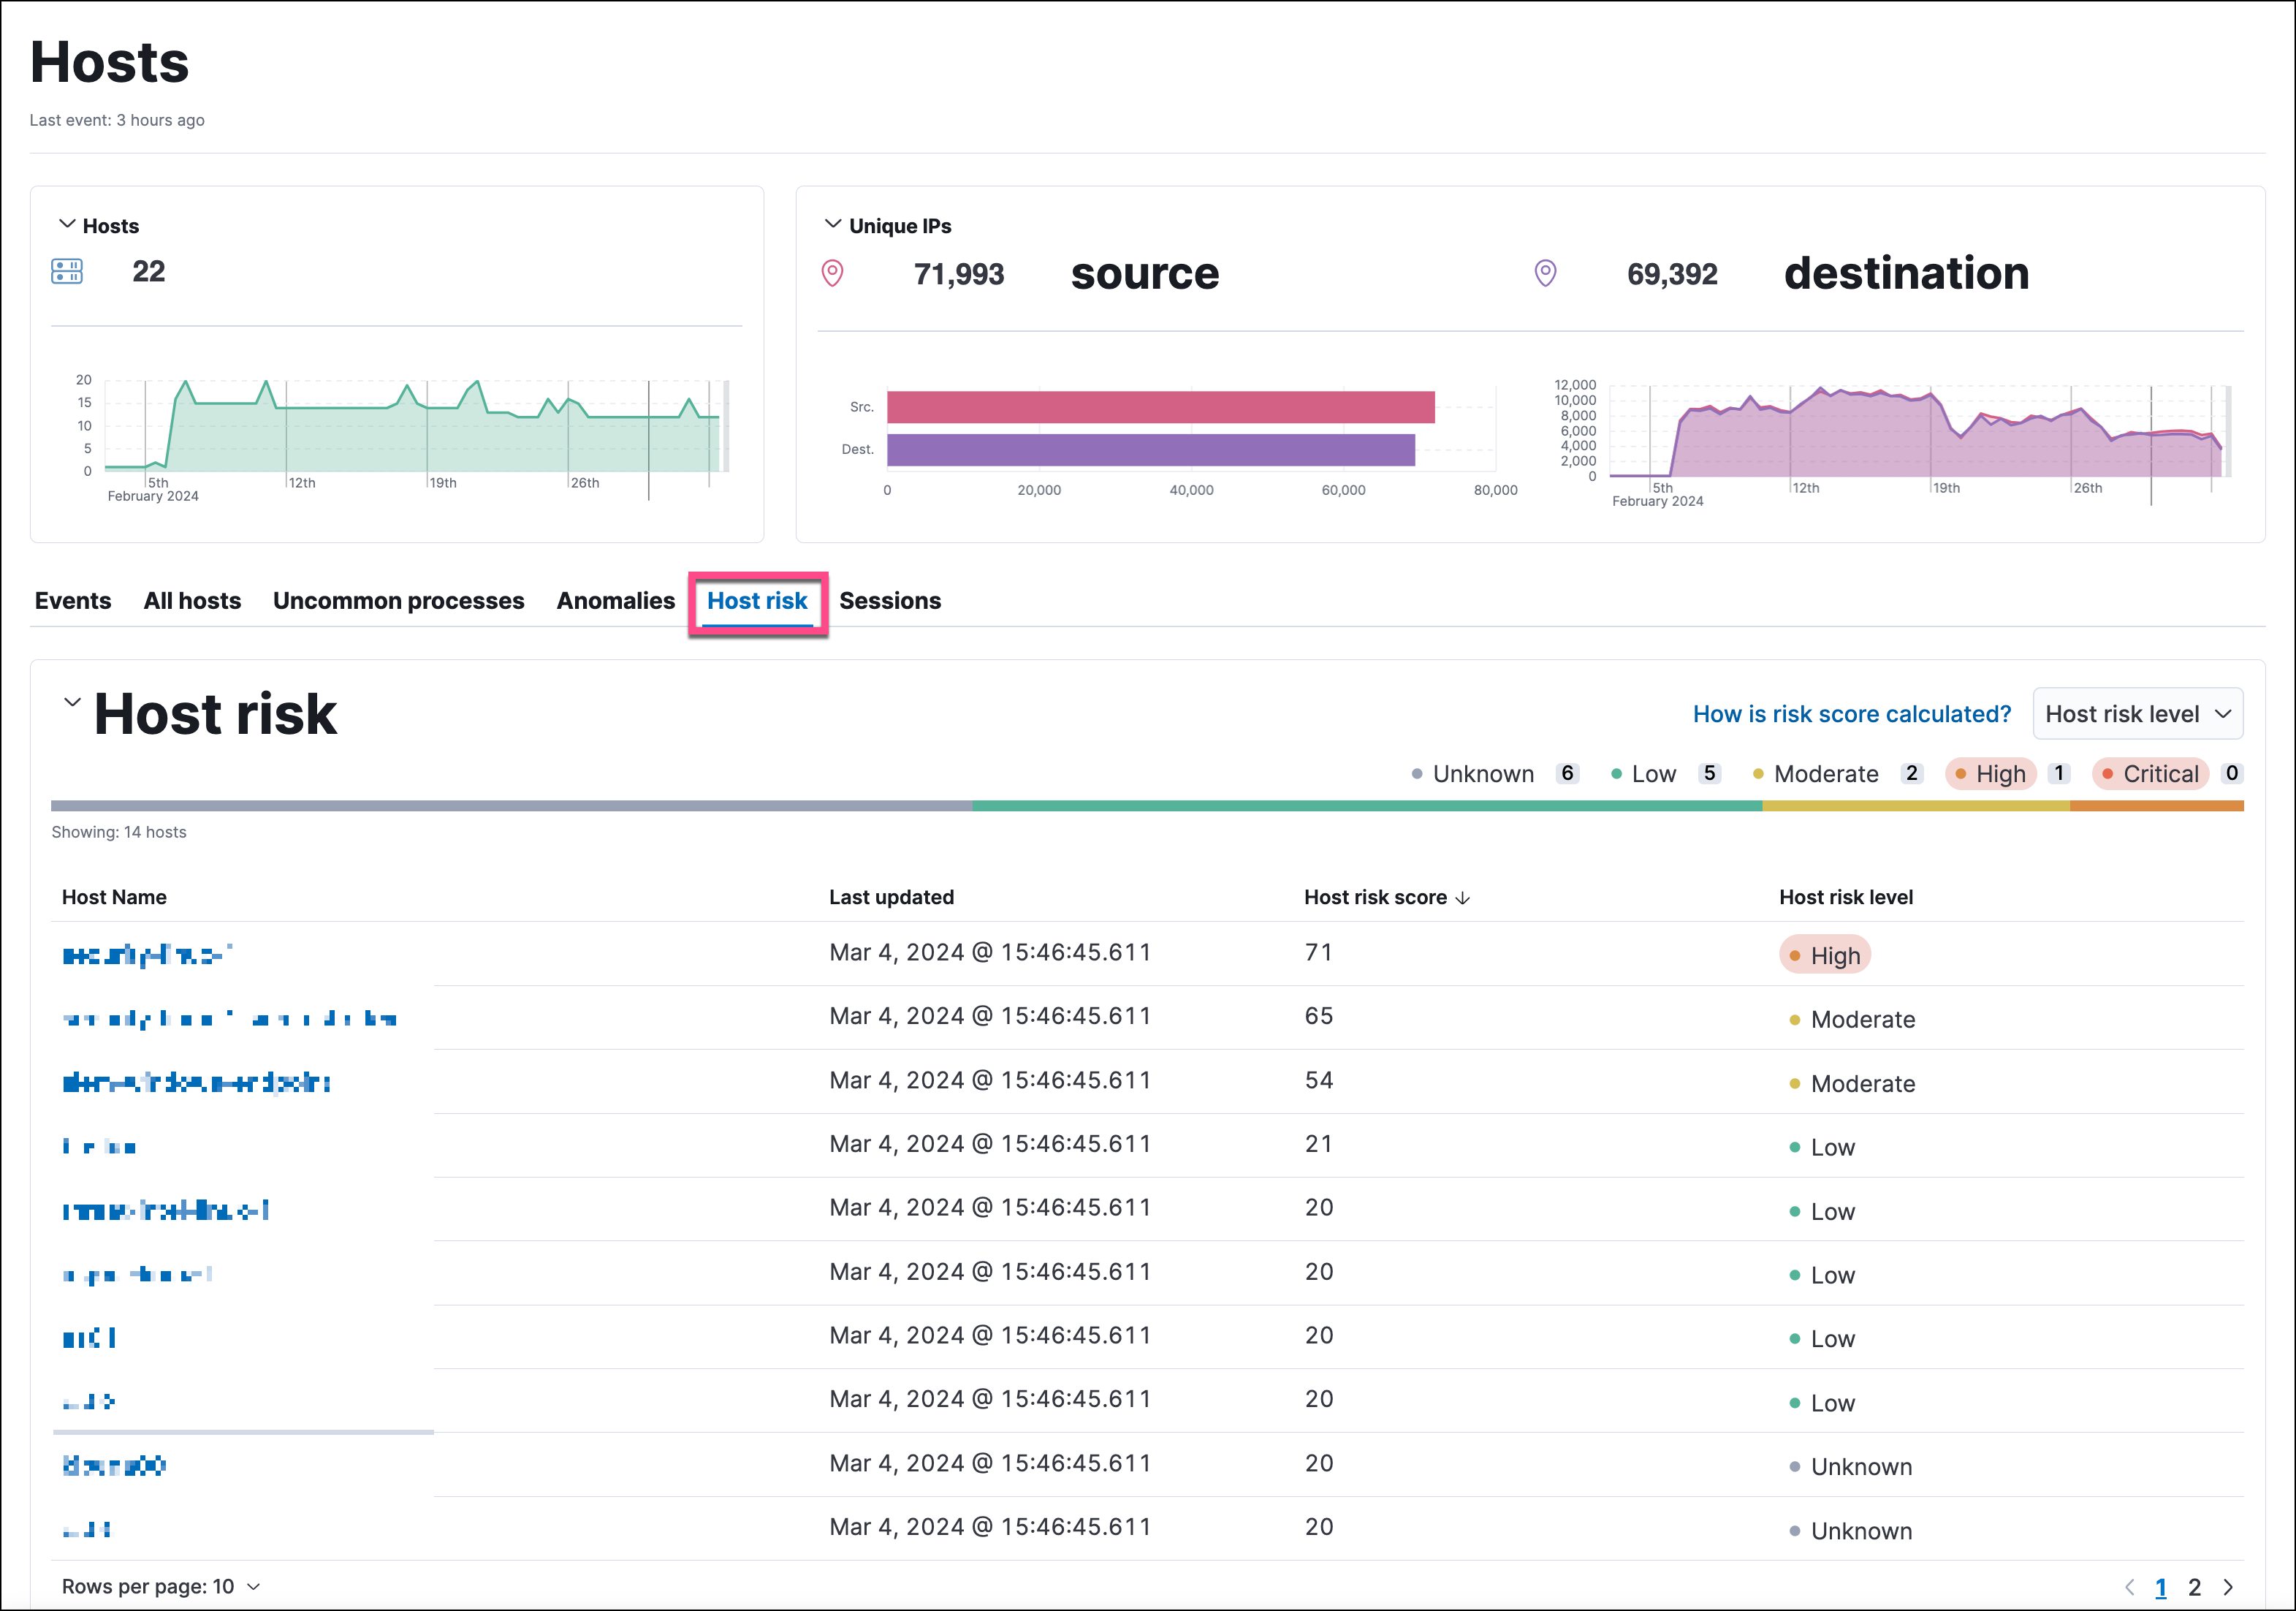
The Host risk tab on the Hosts page:
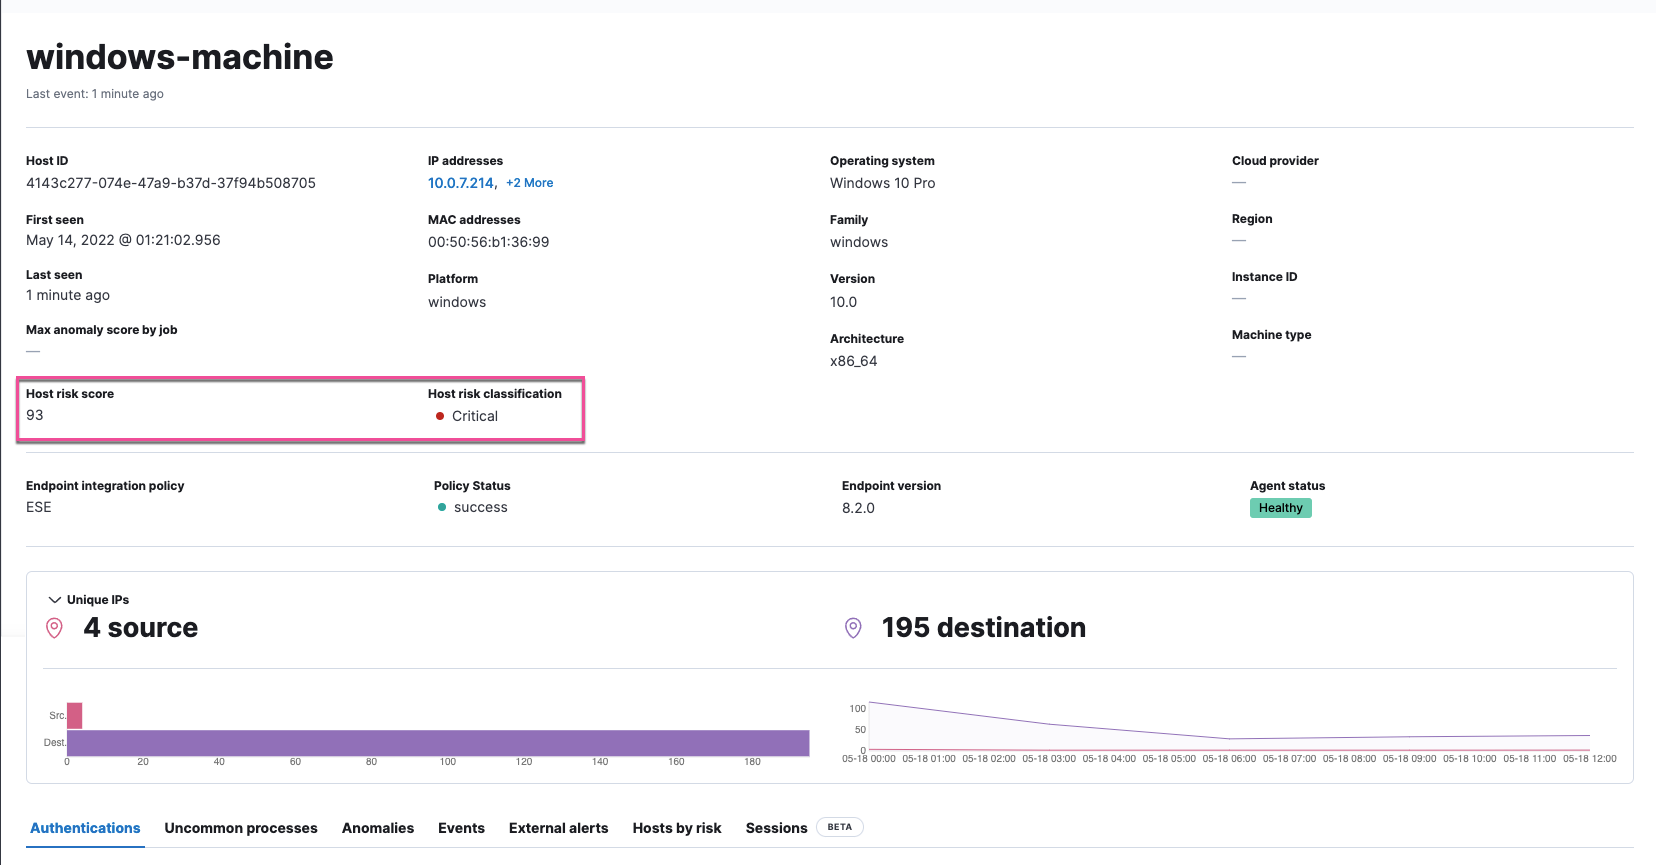
The Overview section on the host details page:
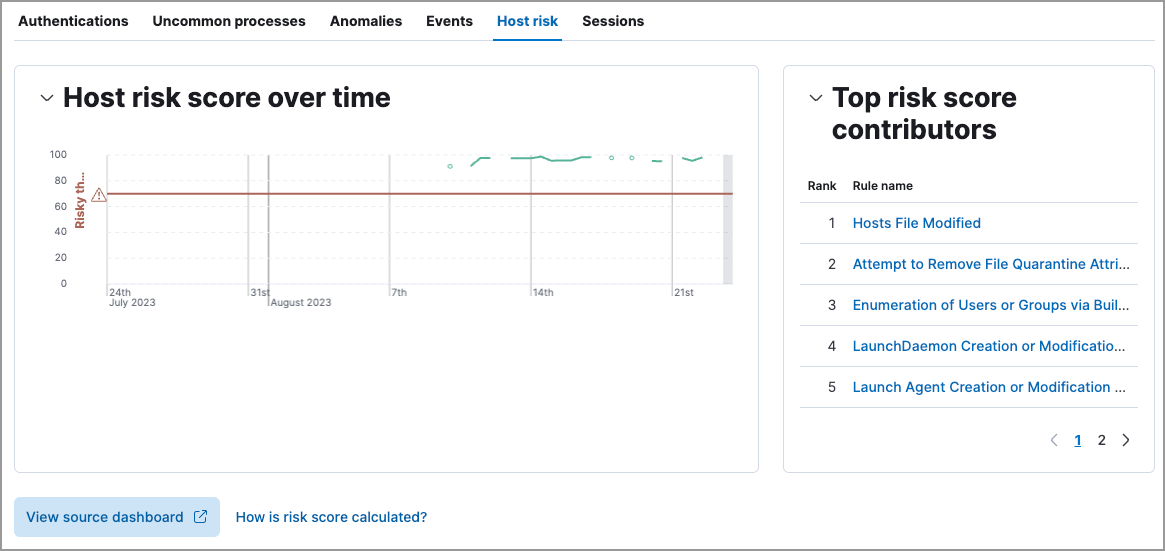
The Host risk tab on the host details page:
You can also visualize host risk score data using prebuilt dashboards that are automatically imported when the feature is enabled.
To access the dashboards:
-
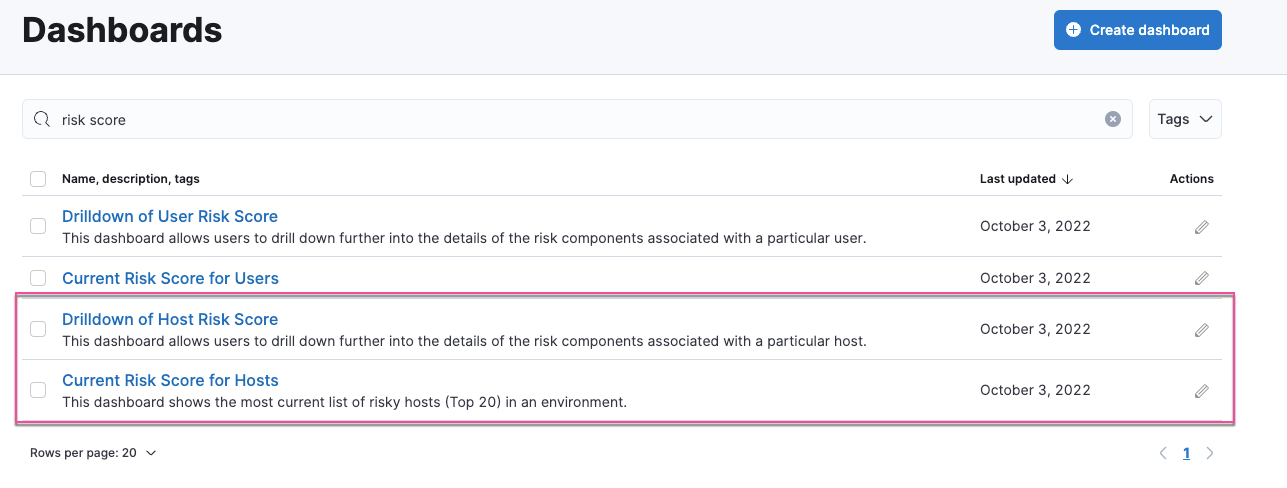
In Kibana, go to Analytics → Dashboard, then search for
risk score. - Select Drilldown of Host Risk Score to analyze the risk components of a host, or Current Risk Score for Hosts to display a list of current risky hosts in your environment.
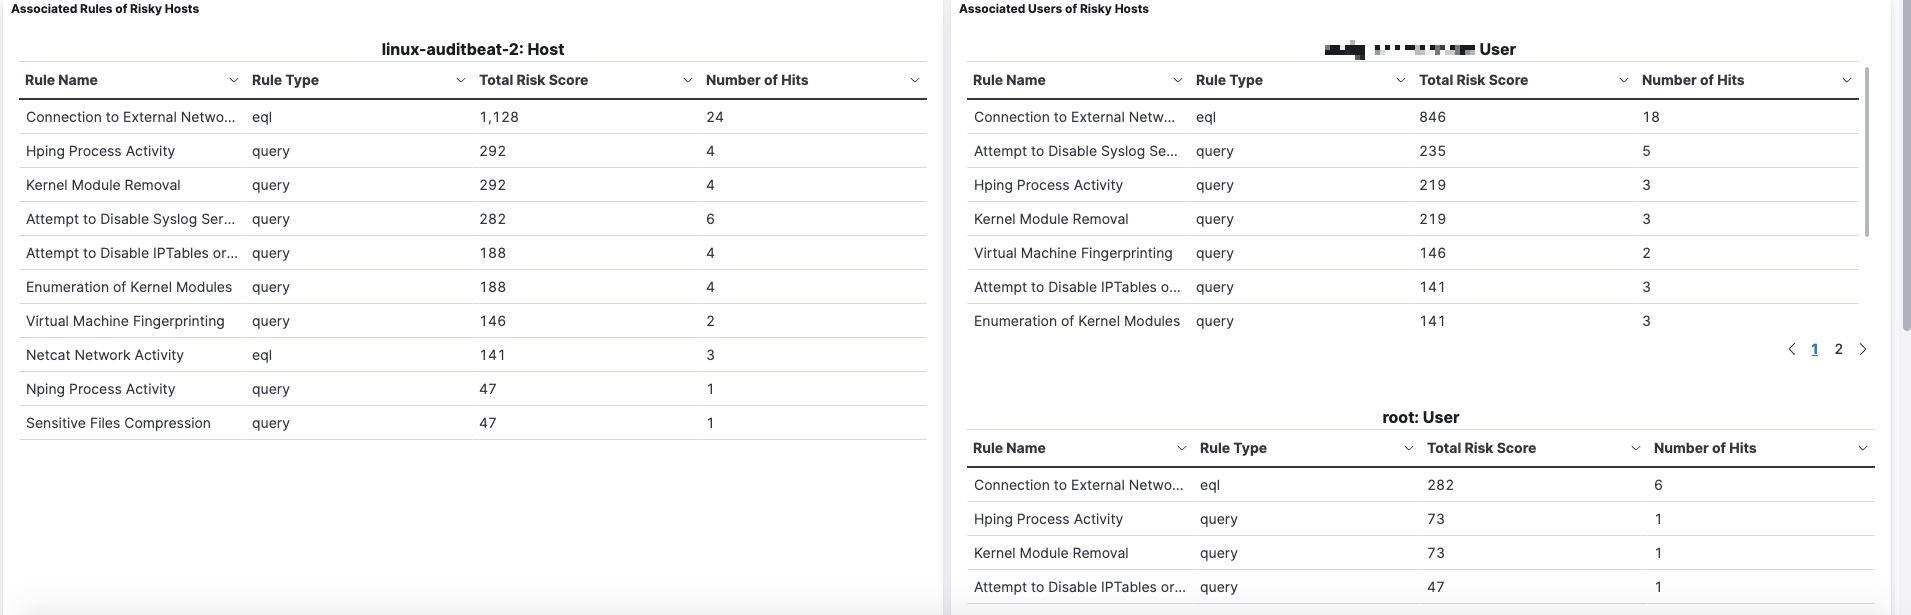
In this example, we’ll explore the Drilldown of Host Risk Score dashboard.
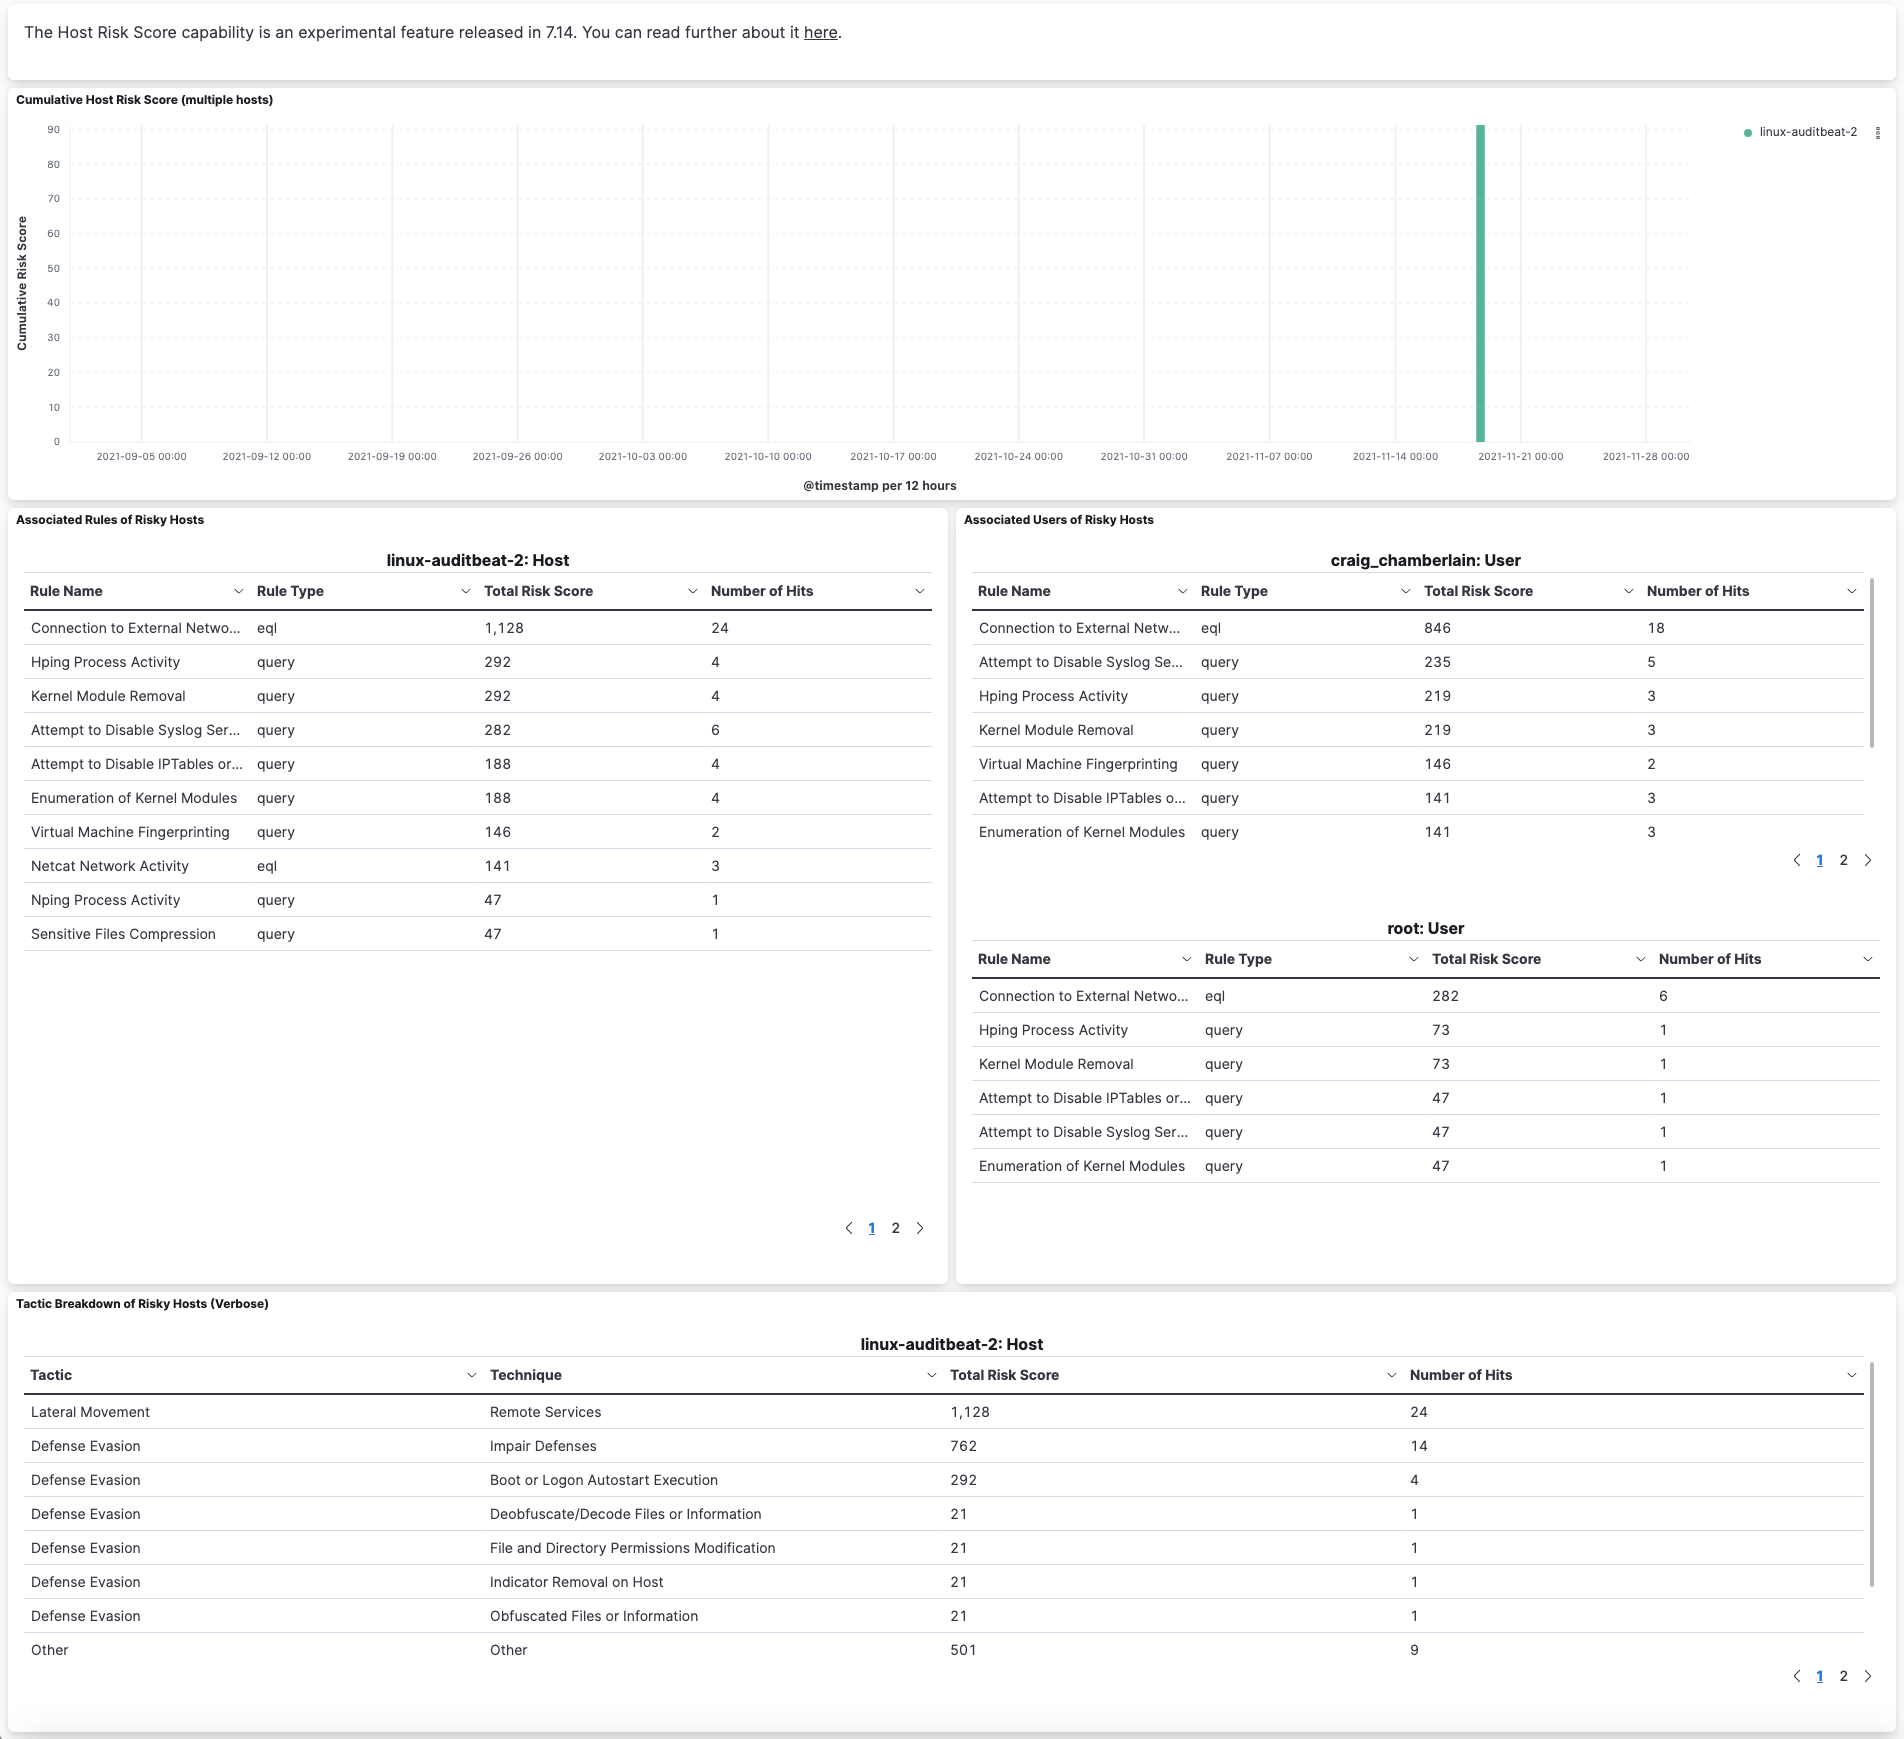
Use the histogram to track how the risk score for a particular host has changed over time. To specify a date range, use the date and time picker, or drag and select a time range within the histogram.
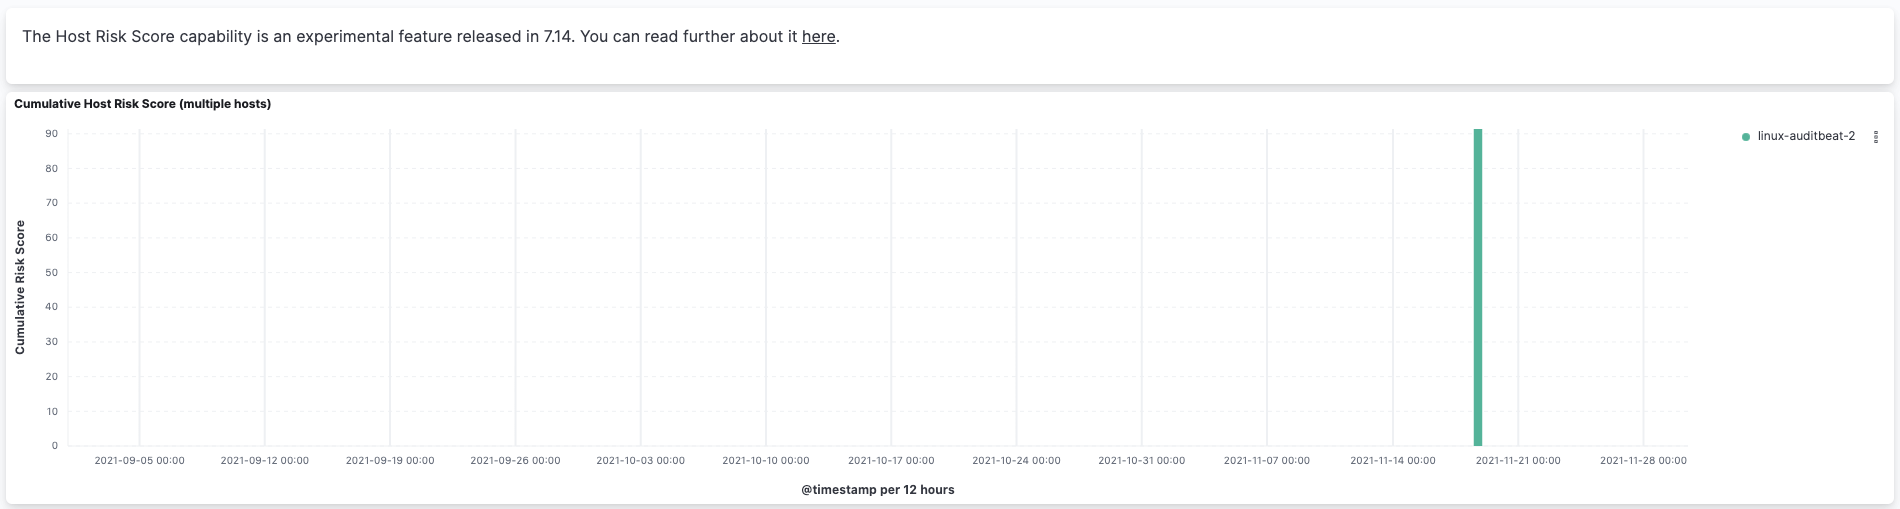
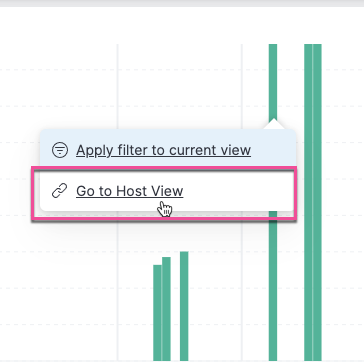
To go to the host’s details page, click any host’s corresponding bar in the histogram, then select Go to Host View.
The histogram shows historical changes in a particular host’s risk score(s). To specify a date range, use the date and time picker, or drag and select a time range within the histogram.
Troubleshootingedit
During the installation or upgrade process, you may receive the following error messages:
-
Saved object already exists -
Transform already exists -
Ingest pipeline already exists
In this case, we recommend that you manually delete the host risk score module, then re-enable it. To manually delete the module:
-
Delete the host risk score saved objects:
- From the Kibana main menu, go to Stack Management → Kibana → Saved Objects.
-
Delete the saved objects that have the
Host Risk Score - <space-id>tag.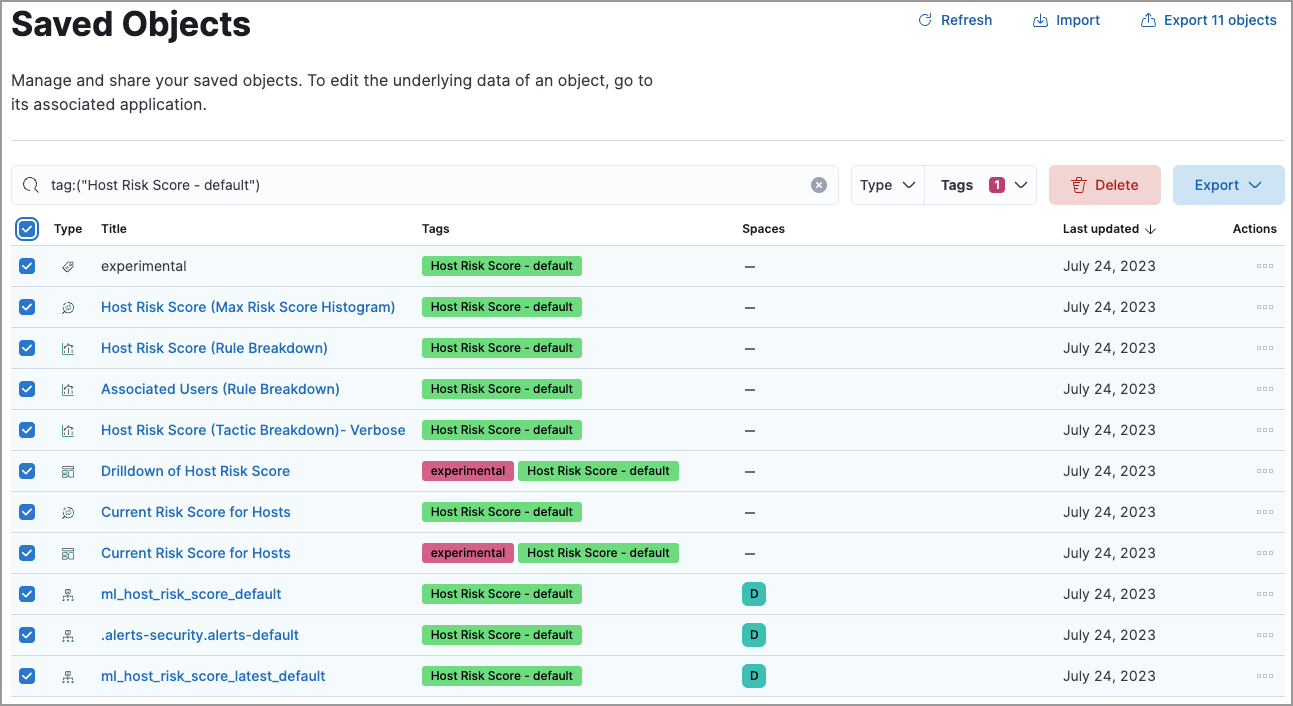
-
Delete the
Host Risk Score - <space-id>tag.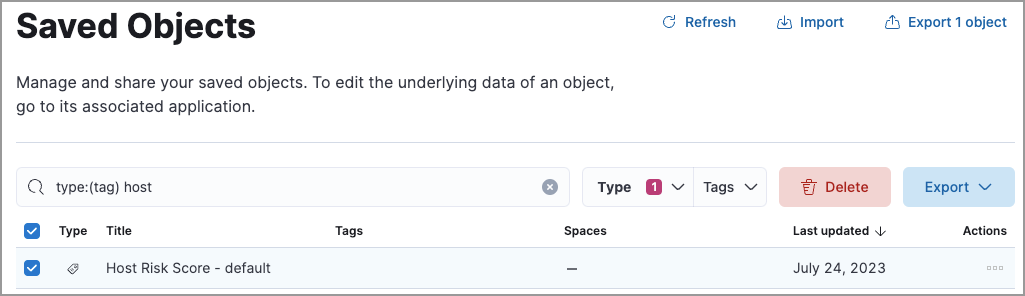
-
Stop and delete the host risk score transforms. You can do this using the Kibana UI or the Stop transform API and Delete transform API.
-
To delete the host risk score transforms using the Kibana UI:
- From the Kibana main menu, go to Stack Management → Data → Transforms.
-
Stop the following transforms, then delete them:
-
ml_hostriskscore_latest_transform_<space-id> -
ml_hostriskscore_pivot_transform_<space-id>
-
-
To delete the host risk score transforms using the API, run the following commands in Console:
-
Stop and delete the latest transform:
POST _transform/ml_hostriskscore_latest_transform_<space-id>/_stop
DELETE _transform/ml_hostriskscore_latest_transform_<space-id>
-
Stop and delete the pivot transform:
POST _transform/ml_hostriskscore_pivot_transform_<space-id>/_stop
DELETE _transform/ml_hostriskscore_pivot_transform_<space-id>
-
-
-
Delete the host risk score ingest pipeline. You can do this using the Kibana UI or the Delete pipeline API.
-
To delete the host risk score ingest pipeline using the Kibana UI:
- From the Kibana main menu, go to Stack Management → Ingest → Ingest Pipelines.
-
Delete the
ml_hostriskscore_ingest_pipeline_<space-id>ingest pipeline.
-
To delete the host risk score ingest pipeline using the Delete pipeline API, run the following command in Console:
DELETE /_ingest/pipeline/ml_hostriskscore_ingest_pipeline_<space-id>
-
-
Delete the stored host risk score scripts using the Delete stored script API. In Console, run the following commands:
DELETE _scripts/ml_hostriskscore_levels_script_<space-id>
DELETE _scripts/ml_hostriskscore_init_script_<space-id>
DELETE _scripts/ml_hostriskscore_map_script_<space-id>
DELETE _scripts/ml_hostriskscore_reduce_script_<space-id>
After manually deleting the host risk score saved objects, transforms, ingest pipeline, and stored scripts, follow the steps to re-enable the host risk score module.