Verify that user risk score data installed successfully (Optional)
editVerify that user risk score data installed successfully (Optional)edit
After you enable or upgrade user risk score, the following message may appear:
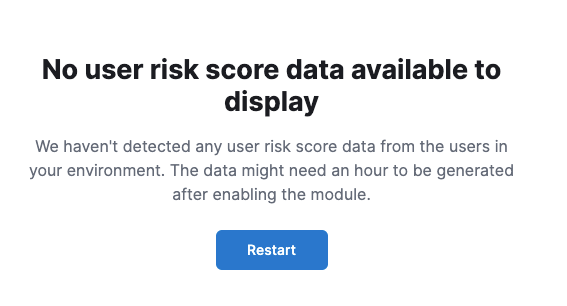
If so, click Restart and allow at least an hour for the data to be generated. If data still doesn’t appear, verify that user risk score data has been generated:
In Kibana, run the following commands in Console to query the ml_user_risk_score_<space-id> index:
GET ml_user_risk_score_<space-id>/_search
If no data returns, you’ll need to check if the alerts index (.alerts-security.alerts-<space-id>) had alert data when ml_userriskscore_pivot_transform_<space-id> was started.
Example:
GET transform/ml_userriskscore_pivot_transform_<space-id>/_stats?human=true
Here’s an example response:
{
  "count": 1,
  "transforms": [
    {
      "id": "ml_userriskscore_pivot_transform_<space-id>",
      "state": "started",
      "node": {
        "id": "H1tlwfTyRkWls-C0sarmHw",
        "name": "instance-0000000000",
        "ephemeral_id": "SBqlp5ywRuuop2gtcdCljA",
        "transport_address": "10.43.255.164:19635",
        "attributes": {}
      },
      "stats": {
        "pages_processed": 29,
        "documents_processed": 11805,
        "documents_indexed": 8,
        "documents_deleted": 0,
        "trigger_count": 9,
        "index_time_in_ms": 52,
        "index_total": 7,
        "index_failures": 0,
        "search_time_in_ms": 201,
        "search_total": 29,
        "search_failures": 0,
        "processing_time_in_ms": 14,
        "processing_total": 29,
        "delete_time_in_ms": 0,
        "exponential_avg_checkpoint_duration_ms": 59.02353261024906,
        "exponential_avg_documents_indexed": 0.8762710605864747,
        "exponential_avg_documents_processed": 1664.7724779548555
      },
      "checkpointing": {
        "last": {
          "checkpoint": 8,
          "timestamp": "2022-10-17T14:49:50.315Z",
          "timestamp_millis": 1666018190315,
          "time_upper_bound": "2022-10-17T14:47:50.315Z",
          "time_upper_bound_millis": 1666018070315
        },
        "operations_behind": 380,
        "changes_last_detected_at_string": "2022-10-17T14:49:50.113Z",
        "changes_last_detected_at": 1666018190113,
        "last_search_time_string": "2022-10-17T14:49:50.113Z",
        "last_search_time": 1666018190113
      }
    }
  ]
}
Take note of the value from time_upper_bound_millis and enter it as a range query for the alerts index.
Example:
GET .alerts-security.alerts-<space-id>/_search
{
  "query": {
    "range": {
      "@timestamp": {
        "lt": 1666018070315
      }
    }
  }
}
If there’s no response, verify that relevant rules are running and that alert data is being generated. If there is a response, click Restart and allow an hour for the user risk data to appear.