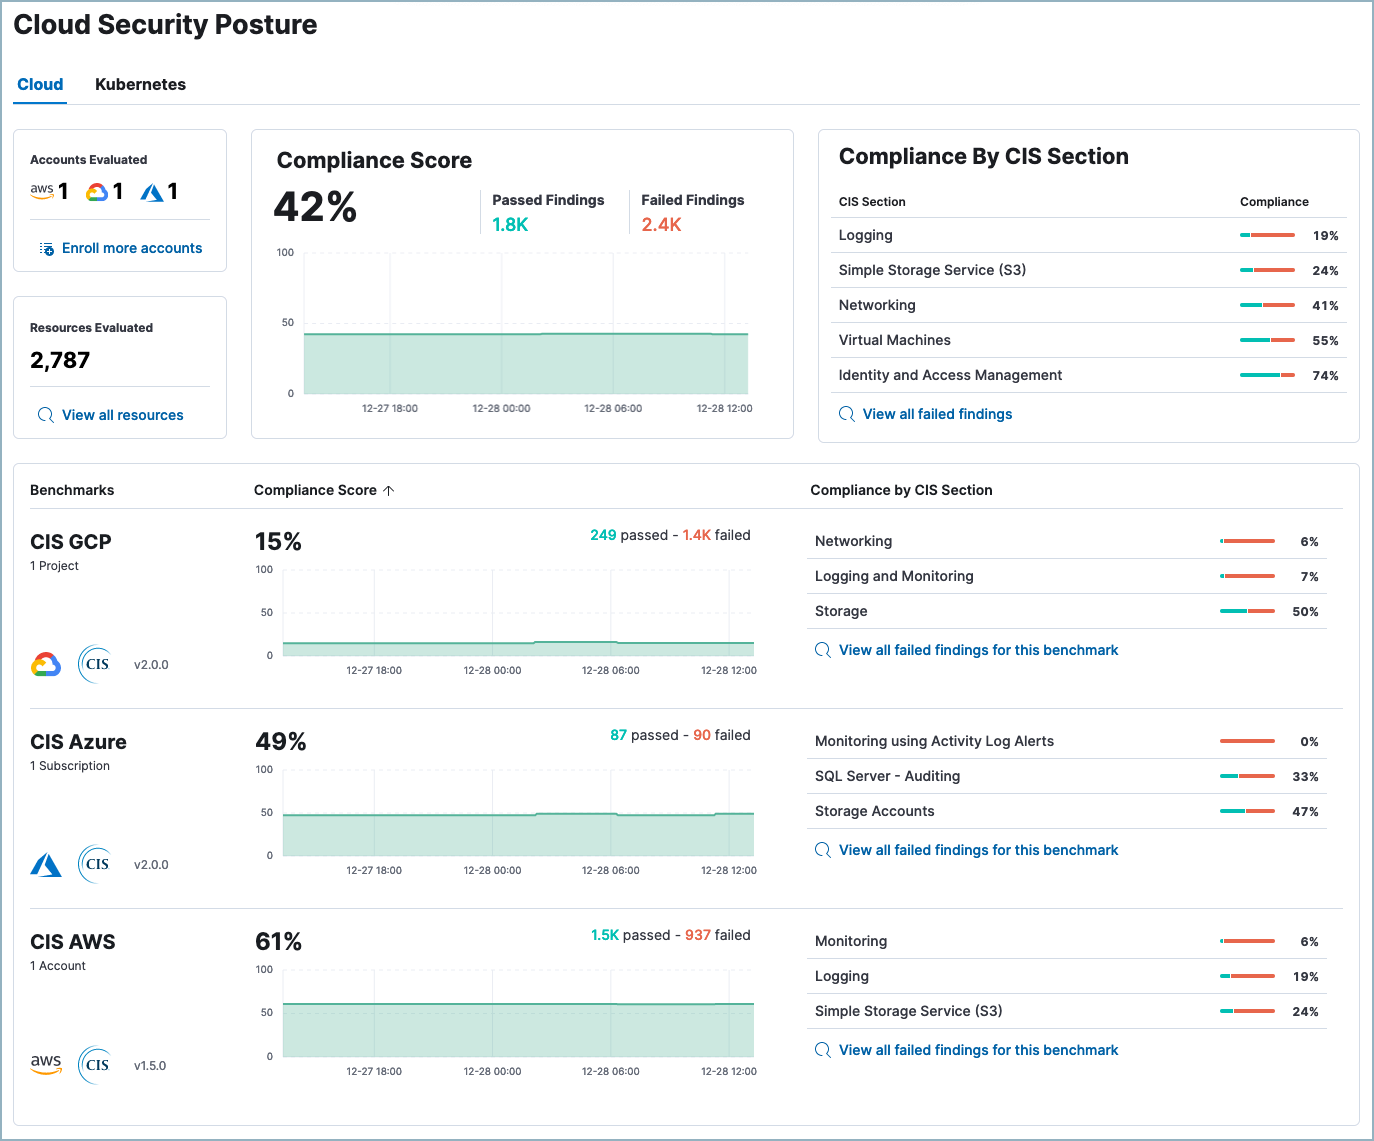
Cloud Security Posture dashboard
The Cloud Security Posture dashboard summarizes your cloud infrastructure’s overall performance against security guidelines defined by the Center for Internet Security (CIS). To start collecting this data, refer to Get started with Cloud Security Posture Management or Get started with Kubernetes Security Posture Management.

The Cloud Security Posture dashboard shows:
- Configuration risk metrics for all monitored cloud accounts and Kubernetes clusters
- Configuration risk metrics grouped by the applicable benchmark, for example, CIS GCP, CIS Azure, CIS Kubernetes, or CIS EKS
- Configuration risks grouped by CIS section (security guideline category)
- The Cloud Security Posture dashboard is available to all Elastic Cloud users. For on-prem deployments, it requires an appropriate subscription level.
At the top right of the dashboard, you can filter the data by which namespace of the findings index it's saved in. At the top left of the dashboard, you can switch between the cloud accounts and Kubernetes cluster views.
The summary section summarizes your overall cloud security posture (CSP) by aggregating data from all monitored resources. The summary cards on the left show the number of cloud accounts or clusters evaluated, and the number of resources evaluated. You can click Enroll more accounts or Enroll more clusters to deploy to additional cloud assets. Click View all resources to open the Findings page.
The remaining summary cards show your overall compliance score, and your compliance score for each CIS section. Click View all failed findings to view all failed findings, or click a CIS section name to view failed findings from only that section on the Findings page.
Below the summary section, each row shows the CSP for a benchmark that applies to your monitored cloud resources. For example, if you are monitoring GCP and Azure cloud accounts, a row appears for CIS GCP and another appears for CIS Azure. Each row shows the CIS benchmark, the number of cloud accounts it applies to, its overall compliance score, and its compliance score grouped by CIS section.

When do newly-enrolled clusters appear on the dashboard?
It can take up to 10 minutes for deployment, resource fetching, evaluation, and data processing before a newly-enrolled cluster appears on the dashboard.
When do unenrolled clusters disappear from the dashboard?
A cluster will disappear as soon as the KSPM integration fetches data while that cluster is not enrolled. The fetch process repeats every four hours, which means a newly unenrolled cluster can take a maximum of four hours to disappear from the dashboard.
How do I organize security posture data by namespace?
You can configure a CSPM or KSPM integration to send its data to a particular namespace by going to Configure integration -> Advanced options, then entering the desired namespace under Namespace.