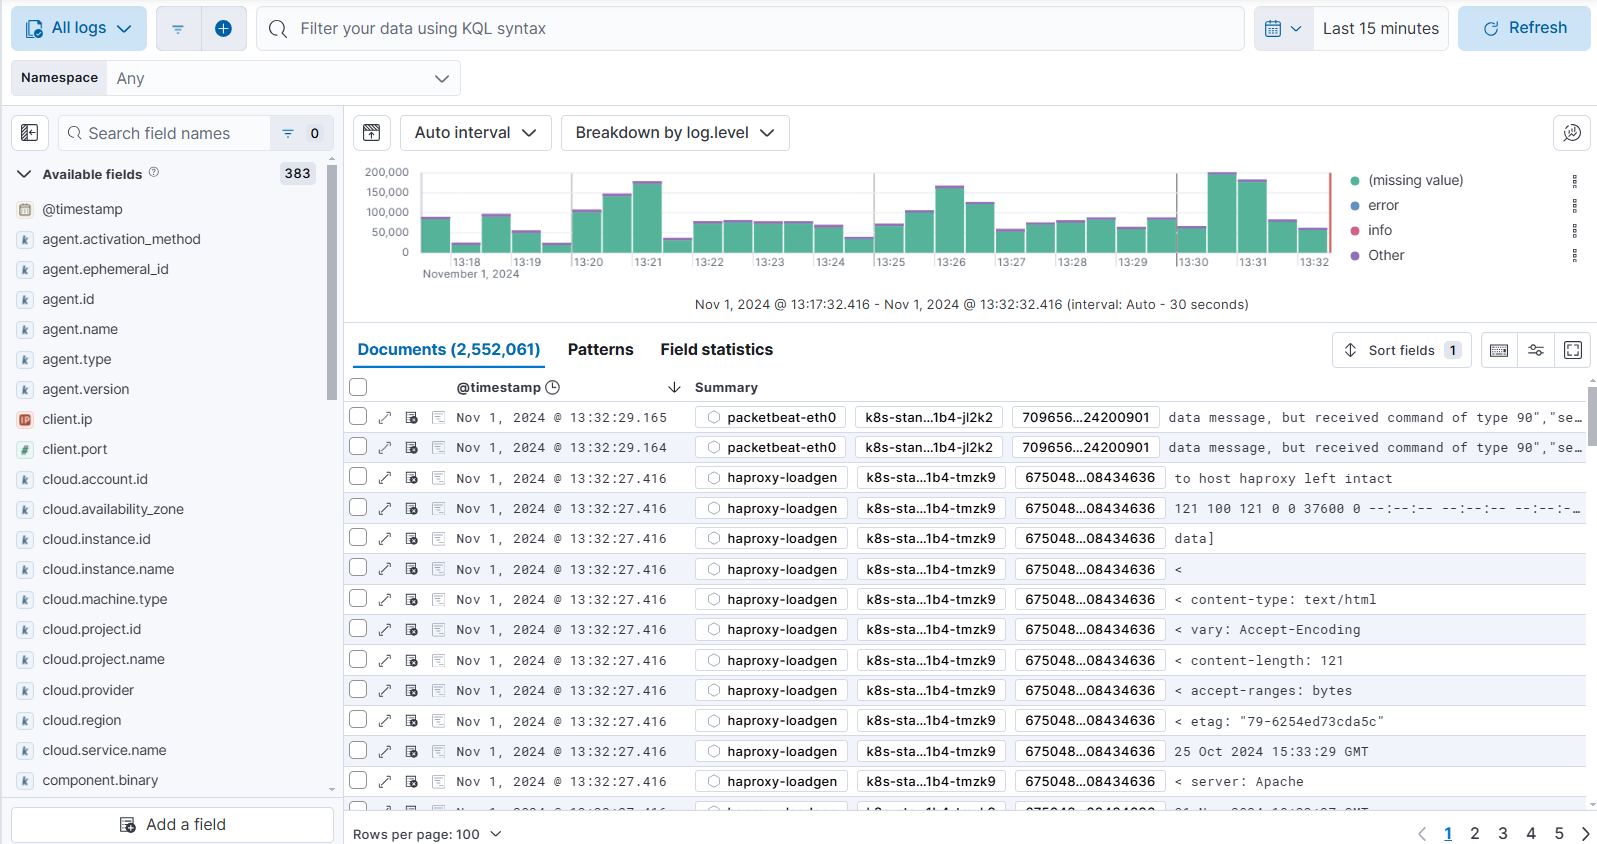
Explore logs in Discover
Discover offers a dedicated experience for exploring log data. When Discover recognizes data in logs-* indices, it enables specific features to help you investigate log events more effectively. Use this view to quickly search and filter your log data, explore field structure, and surface findings in visualizations or dashboards.
If you're just getting started with Discover and want to learn its main principles, you should get familiar with the default experience.
For a contextual logs experience, set the Solution view for your space to Observability. Refer to Managing spaces for more information.

Viewing data in Discover logs data views requires read privileges for Discover, Index, and Logs. For more on assigning Kibana privileges, refer to the Kibana privileges docs.
The logs experience is available in:
Data view mode: Select the
logs-*orAll logsdata view from the Discover main page. By default, All logs shows all of your logs according to the index patterns set in the logs sources advanced setting. You can navigate to the Advanced settings from the navigation menu or by using the global search field.To focus on logs from a specific source, create a data view using the index patterns for that source. For more information, refer to Create a data view.
ES|QL mode: Switch to ES|QL mode and use the
FROMcommand to query your log data:FROM logs-*-*,logs-*,filebeat-*You can also query a specific index:
FROM logs-myservice-default
Once you have the logs you want to focus on, you can drill down further. For more on filtering, refer to Filter logs in Discover.
The documents table lets you add fields, order table columns, sort fields, and update the row height in the same way you would in Discover.
Refer to the Discover documentation for more information on updating the table.
The actions column provides additional information about your logs.
Expand: ![]() Open the log details to get an in-depth look at an individual log file.
Open the log details to get an in-depth look at an individual log file.
Degraded document indicator: ![]() This indicator shows if any of the document’s fields were ignored when it was indexed. Ignored fields could indicate malformed fields or other issues with your document. Use this information to investigate and determine why fields are being ignored.
This indicator shows if any of the document’s fields were ignored when it was indexed. Ignored fields could indicate malformed fields or other issues with your document. Use this information to investigate and determine why fields are being ignored.
Stacktrace indicator: ![]() This indicator makes it easier to find documents that contain additional information in the form of stacktraces.
This indicator makes it easier to find documents that contain additional information in the form of stacktraces.
Select the expand icon ![]() to get an in-depth look at an individual log file.
to get an in-depth look at an individual log file.
These details provide immediate feedback and context for what’s happening and where it’s happening for each log. From here, you can quickly debug errors and investigate the services where errors have occurred.
The following actions help you filter and focus on specific fields in the log details:
- Filter for value (
 ): Show logs that contain the specific field value.
 - Filter out value (
 ): Show logs that do not contain the specific field value.
 - Filter for field present (
 ): Show logs that contain the specific field.
 - Toggle column in table (
 ): Add or remove a column for the field to the main Discover table.
The Content breakdown section gives you a view of the raw log text. For each message, the breakdown displays:
- Field name — the source field being parsed (for example,
message) - Timestamp — the time the log event occurred
- Message content — the full text of the log message
From the content breakdown, you can select Parse content in Streams to open the related stream and extract structured fields from the message. Use this when your logs contain unstructured data that you want to query or filter on.
The Similar errors section shows an occurrences chart for errors that share the same service.name, error.culprit, message, and error.grouping_name fields. Use this view to identify recurring errors and spot patterns across your services.
Select Open in Discover to open a filtered view of all similar errors.
The Stream section provides a link to the related stream for the selected log. From here, you can extract fields, set data retention, and route data from one place.
The Stacktrace section is available for logs from instrumented applications. It shows the full stack trace leading to the error, including the culprit, error message, and individual frames. Frames from your application code are shown alongside library frames, which you can expand to see the full call stack.
When a root cause is available, a Caused by section appears below the main stack trace with additional context about the underlying error.
The Trace summary section is available for logs from instrumented applications. It shows a condensed waterfall of the trace the selected document belongs to. Each row represents a span or transaction, positioned on a timeline to show when it started and how long it took.