Add symbols for native frames
editAdd symbols for native frames
editThis functionality is in beta and is subject to change. The design and code is less mature than official GA features and is being provided as-is with no warranties. Beta features are not subject to the support SLA of official GA features.
To see function names and line numbers in traces of applications written in programming languages that compile to native code (C, C++, Rust, Go, etc.), you need to push symbols to the cluster.
You can do this with the elastic-profiling CLI utility.
Download the elastic-profiling binary here.
As the elastic-profiling binary is currently only distributed for Linux x86_64, you need a Linux machine
to use it.
How to use the elastic-profiling binary
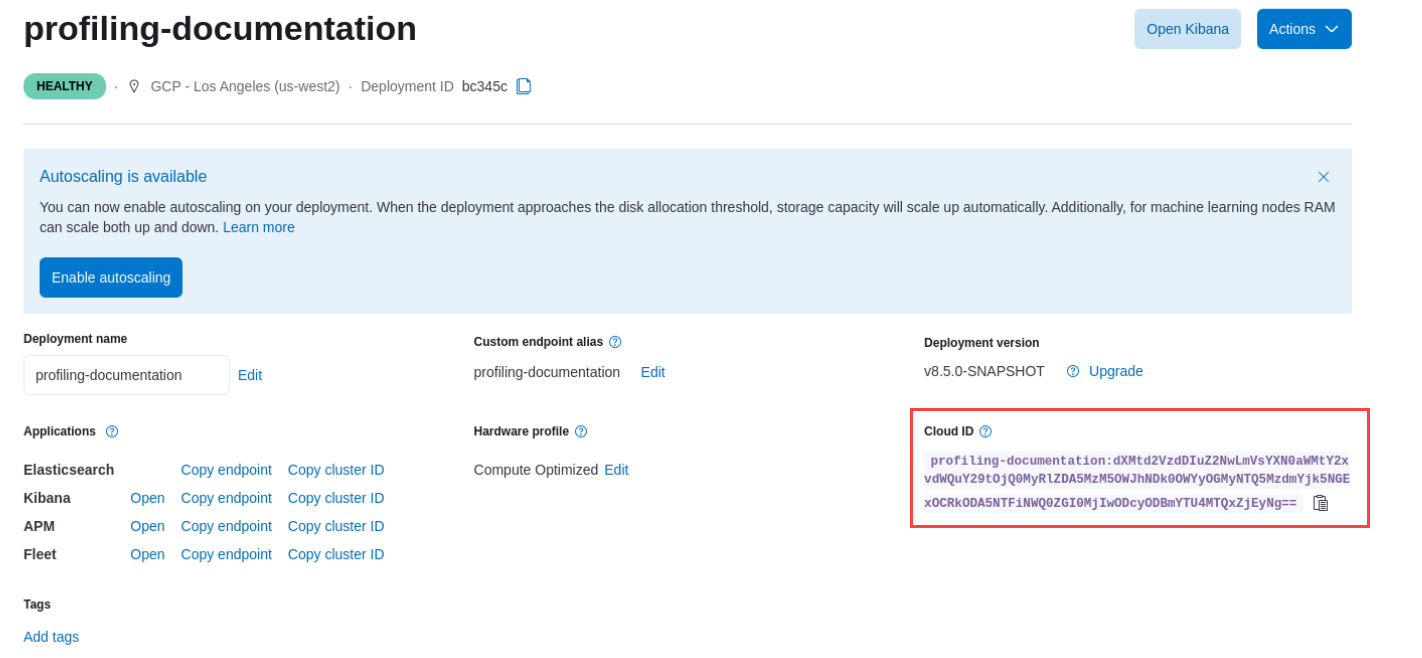
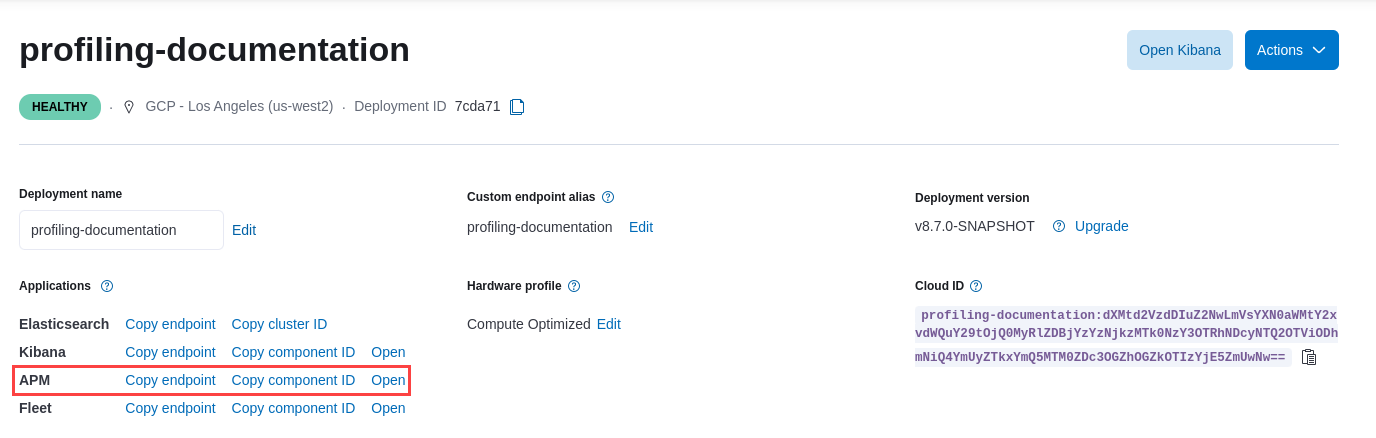
editBefore using the elastic-profiling binary, you need the following information for the deployment where you’re running Universal Profiling:
-
Credentials (either an API key or username and password) for the
superuserElasticsearch role (typically, theelasticuser). -
The deployment’s Cloud ID from the deployment overview page.
-
The deployment’s APM Component ID from the deployment overview page.
Prepare a configuration file called config.txt with the following command, using the values from your deployment instead of the placeholders. You’ll use this file to run commands in the following sections:
cat <<EOF > config.txt
export ES_USER=<ES_USER>
export ES_PASSWORD=<ES_PASSWORD>
export ES_CLOUD_ID=<CLOUD_ID>
export ES_APM_CLUSTER_ID=<APM_CLUSTER_ID>
EOF
Replace the placeholders in the config.txt with the following:
-
Replace
<ES_USERNAME>and<ES_PASSWORD>with thesuperuserElasticsearch credentials. Use real values instead of the placeholders. For example, replace<ES_USER>withelastic.Alternatively, you can use an API key with the same permissions by replacing
ES_USERandES_PASSWORDwithES_API_KEY. The value forES_API_KEYshould be the base64-encoded API key as seen in Kibana. -
Replace
<CLOUD_ID>with your deployment’s Cloud ID that you copied earlier. -
Replace
<APM_CLUSTER_ID>with your deployment’s APM Cluster ID that you copied earlier.
You can override the environment variables using command line arguments.
For details, run ./elastic-profiling push-symbols --help.
Go applications
editThe meta-information in Go binaries allows them to be symbolized even if they were stripped.
No additional parameters need to be passed during the build. To push symbols for a Go binary,
invoke the elastic-profiling tool:
source config.txt
./elastic-profiling push-symbols executable -e ./my-go-app
C, C++, and Rust applications
editC/C++ applications must be built with debug symbols (-g) for symbolization to work. Rust applications
must be built with [debug = 1][cargo-debug] (or higher). The debug info doesn’t have to be deployed to
production, but needs to be present temporarily to push them to the Elastic cluster.
cargo-debug
If you don’t mind deploying your applications with debug symbols, run:
source config.txt
./elastic-profiling push-symbols executable -e ./my-c-app
If you don’t want debug symbols in production, copy the executable and strip the copy.
You can then use the -d argument to instruct the tool to read the symbols from the original
unstripped binary while still calculating the file hash from the final stripped binary. After
the symbols have been pushed, you can remove the unstripped binary:
cp ./my-app ./my-stripped-app
strip ./my-stripped-app
source config.txt
./elastic-profiling push-symbols executable -e ./my-stripped-app -d ./my-app
rm ./my-app
Pushing debug information and then stripping the binary later does not work.
The executable passed using the -e argument is used to calculate the file hash that associates stack traces with their symbols and stripping the binary later changes that hash.
Linux distribution packages
editFor Debian, Ubuntu, Fedora, and Arch Linux, the elastic-profiling tool supports pushing symbols for an entire package at once.
The required debug symbols are automatically retrieved from the distribution’s debuginfod server.
For this to work, make sure that the debuginfod client is installed on your machine.
|
Distribution |
Install Command |
|
Debian |
|
|
Ubuntu |
|
|
Fedora |
|
|
Arch |
|
Then, invoke elastic-profiling as follows:
source config.txt
./elastic-profiling push-symbols package -p package-name
For example, to push symbols for libc on Debian:
source config.txt
./elastic-profiling push-symbols package -p libc6
debuginfod servers for many distributions can be unreliable and may result in the tool printing No debug info found for executable, skipping. for all executables. This is more common if you’re on a faster moving release-channel of your distribution (for example, Debian Testing).
Native symbolization limitations
editIn the current beta release of Elastic Universal Profiling, native symbolization is still limited in a few important ways:
- No virtual frames for inline functions
- No symbols for leaf frames (top-most frame in a trace)
- No automatic insertion of debug symbols for OS packages
We hope to improve these limitations and remove them in later versions.
If symbols are not displayed in Kibana after ingesting them, try restarting Kibana in your deployment (Cloud → Deployments → <Deployment Name> → Kibana → Force Restart). This is a known issue in 8.5 and will be fixed in later versions.