Get startededit
To use the Metrics app, you need Elasticsearch for storing and searching your data, and Kibana for visualizing and managing it.
To ingest data, you can use Metricbeat installed on each server you want to monitor, or third-party collectors that are configured to ship ECS-compliant data. The Metrics fields reference provides a list of all fields used in the Metrics app.
Before you beginedit
To get started quickly, spin up a deployment of our hosted Elasticsearch Service. The deployment includes Elasticsearch and Kibana, and is available on AWS, GCP, and Azure. Try Elasticsearch Service for free.
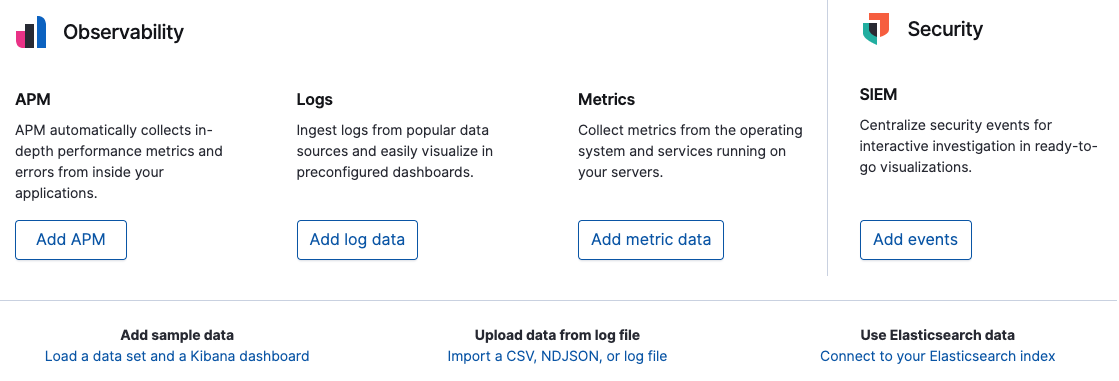
To install Metricbeat from Kibana, on the machine where you want to collect the data, open a Kibana browser window. In the Observability section displayed on the home page of Kibana, click Add metric data. Now follow the instructions for the type of data you want to collect. The instructions include how to install and configure Metricbeat, and enable the appropriate Metricbeat integration for your data.
Alternatively, you can install and self manage Elasticsearch and Kibana. First see the Elastic Support Matrix for information about supported operating systems and product compatibility.
Step 1: Download and install Metricbeatedit
Install Metricbeat as close as possible to the service you want to monitor. For example, if you have four servers with MySQL running, it’s recommended that you run Metricbeat on each server. This allows Metricbeat to access your service from localhost and does not cause any additional network traffic or prevent Metricbeat from collecting metrics when there are network problems. Metrics from multiple Metricbeat instances will be combined on the Elasticsearch server.
To download and install Metricbeat, see Installing Metricbeat and use the commands that work with your system.
Step 2: Configure Metricbeatedit
Now that you have completed the Metricbeat download and installation process, the next step is to configure Metricbeat.
-
Connect to Elasticsearch and Kibana.
Connections to Elasticsearch and Kibana are required to set up Metricbeat. Set the connection information in
metricbeat.yml. To locate this configuration file, see Directory layout.For information on how to connect to the Elasticsearch and Kibana, see Connecting to Elastic Stack.
-
Enable Metricbeat integrations.
Metricbeat uses integrations to collect metrics for populating the Metrics app with data. Each integration defines the basic logic for collecting data from a specific service, such as Redis or MySQL. An integration consists of metricsets that fetch and structure the data. Read How Metricbeat works to learn more.
See Enabling and configuring metrics collection modules for information on how to identify which integrations are available, how to enable them, and how to configure them.
If you’re monitoring Docker containers or Kubernetes pods, you can use autodiscovery to automatically change the configuration settings in response to changes in your containers. Autodiscovery ensures that even when your container configuration changes, data is still collected. To learn how to do this, see Metricbeat autodiscover configuration
-
Set up assets.
Metricbeat comes with predefined assets for parsing, indexing, and visualizing your data. For information on how to load these assets, see Setting up assets.
Step 3: Start Metricbeatedit
Before starting Metricbeat, modify the user credentials in metricbeat.yml and specify a user who is authorized to publish events.
To start Metricbeat, see Starting Metricbeat and use the commands that work with your system.
Step 4: Verify your data in Kibanaedit
Metricbeat comes with pre-built Kibana dashboards and UIs for visualizing log data. You loaded the dashboards earlier when you
ran the setup command as part of setting up assets. The dashboards are provided as examples. We recommend that you customize them
to meet your needs.
For more information, see Viewing your data in Kibana.
If your metrics have custom index patterns, or use non-default fields, you can override the default configuration settings. To modify configurations, use the Settings tab in the Metrics app. Alternatively, see metrics settings for a complete list of metrics configuration settings.