Explore and filter metrics dataedit
Use the Metrics app in Kibana to monitor your infrastructure metrics and identify problems in real time. You can explore metrics for hosts, containers, and services. You can also drill down to view more detailed metrics, or seamlessly switch to view the corresponding logs, application traces, and uptime information.
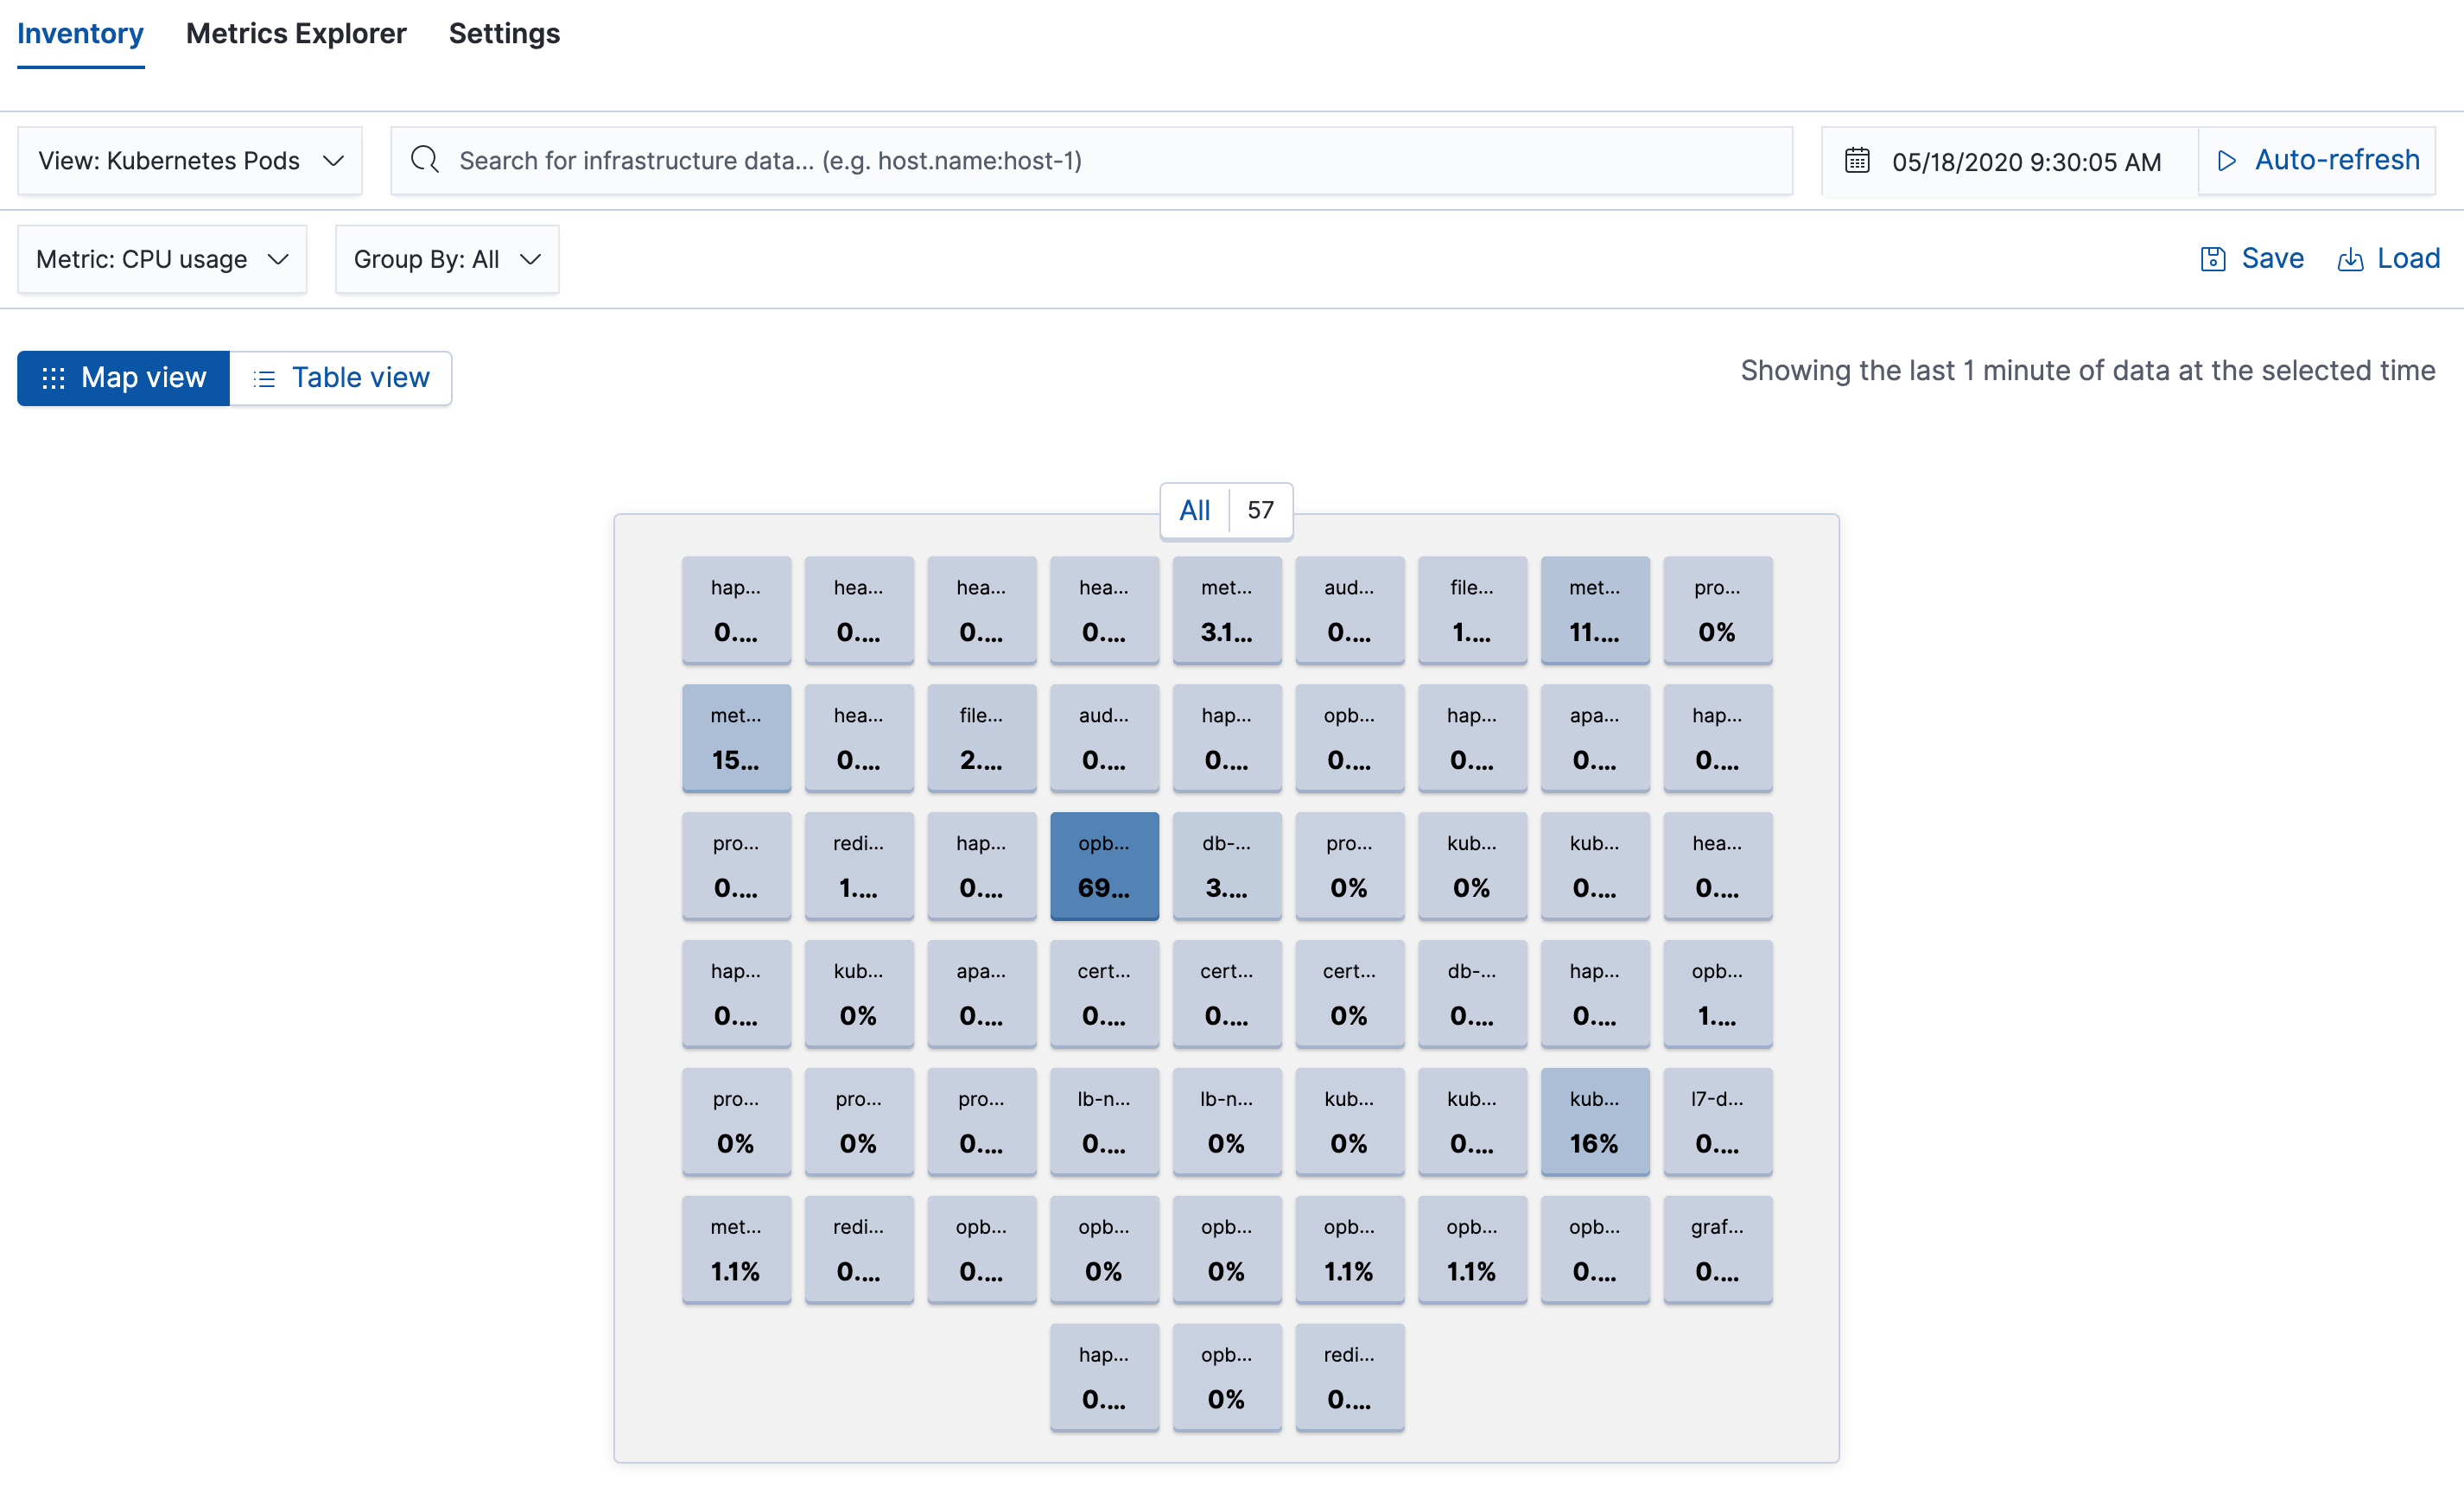
Initially, the Inventory tab shows an overview of the hosts in of your infrastructure and the current CPU usage for each host. From here, you can view other metrics or drill down into areas of interest.
Choose the high-level view of your infrastructureedit
Select the high-level view from Hosts, Kubernetes, or Docker. When you change views, you see the same data through the perspective of a different category.
The default representation is the Map view, which shows your components in a waffle map of one or more rectangular grids. If the view you select has a large number of components, you can hover over a component to see the details for that component. Alternatively, if you would prefer to see your infrastructure as a table, click Table view.
Select the metric to viewedit
Select the metric to view from the Metric dropdown list. The available metrics are those that are most relevant for the high-level view you selected.
Group componentsedit
Select the way you want to group the infrastructure components from the Group By dropdown list. The available options are specific to your physical, virtual, or container-based infrastructure. Examples of grouping options include Availability Zone, Machine Type, Project ID, and Cloud Provider for hosts, and Namespace and Node for Kubernetes.
Use the power of searchedit
Use the search bar to perform ad hoc searches for specific text.
You can also create structured searches using Kibana Query Language.
For example, enter host.hostname : "host1" to see only the information for host1.
Specify the time and dateedit
Click the time filter 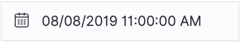 to choose the timeframe for the metrics.
The values shown are the values for the last minute at the specified time and date.
to choose the timeframe for the metrics.
The values shown are the values for the last minute at the specified time and date.
Auto-refresh metricsedit
Select Auto-refresh to keep up-to-date metrics information coming in, or Stop refreshing to focus on historical data without new distractions.
Visualize multiple metrics in Metrics Exploreredit
Metrics Explorer allows you to visualize and analyze metrics for multiple components in a powerful and configurable way. Click the Metrics Explorer tab to get started.