Setting up metrics monitoringedit
To set up metrics monitoring, you need:
- An Elasticsearch cluster and Kibana (version 6.5 or later) with a basic license
- Appropriate Beats shippers (version 6.5 or later) installed and enabled on each system you want to monitor
If your data uses nonstandard fields, you may need to modify some default configuration settings.
Get Elasticsearch and Kibanaedit
To get started, you can use our hosted Elasticsearch Service on Elastic Cloud (recommended for new users), or you can install Elasticsearch and Kibana locally.
Use our hosted serviceedit
The hosted Elasticsearch Service is available on both AWS and GCP. Try out the Elasticsearch Service for free.
Install Elasticsearch and Kibana locallyedit
Alternatively, you can install Elasticsearch and Kibana locally. Follow the instructions to install Elasticsearch, and to install and start Kibana.
Install Beats shippersedit
To start collecting metrics data, you need to install and configure the Metricbeat Beats shipper.
You can install and configure Beats shippers for most kinds of data directly from Kibana, or you can install Beats yourself.
Install Beats from Kibanaedit
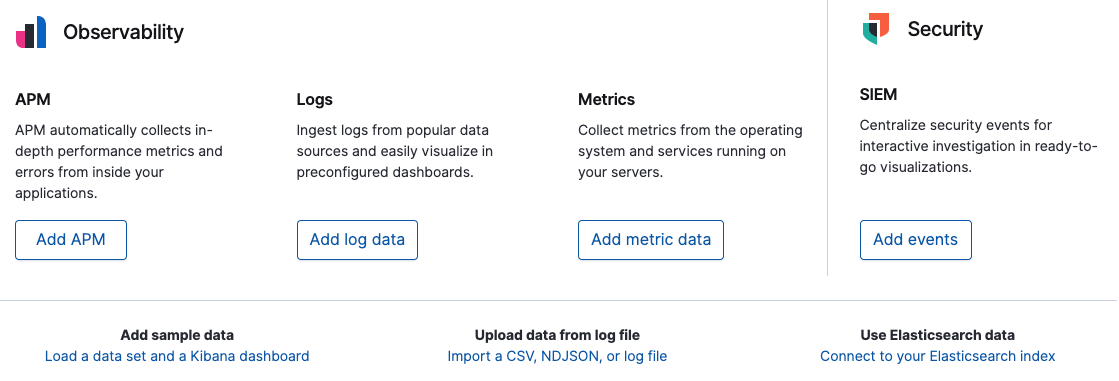
To install Beats from Kibana, on the machine where you want to collect the data, open a Kibana browser window. In the Observability section displayed on the home page of Kibana, click Add metric data. Now follow the instructions for the type of data you want to collect. The instructions include the steps required to download, install, and configure the appropriate Beats modules for your data.
Install Beats yourselfedit
If your data source doesn’t have a Beats module, or if you want to install Beats the old fashioned way, follow the instructions in Metricbeat getting started and enable modules for the metrics you want to collect.
Enable modulesedit
However you install Beats, you need to enable the appropriate modules in Metricbeat to start collecting metrics data.
To populate the Hosts view with metrics data, enable:
-
Metricbeat
systemmodule (enabled by default) -
Metricbeat
add_host_metadataprocessor (enabled by default) -
Metricbeat
add_cloud_metadataprocessor (enabled by default)
To populate the Docker view with metrics data, enable:
To populate the Kubernetes view with metrics data, enable:
Configure your data sourcesedit
If your metrics data has nonstandard fields, you may need to modify some configuration settings in Kibana, such as the index pattern used to query the data, and the timestamp field used for sorting. To modify configurations, use the Settings tab in the Metrics app. Alternatively, see metrics settings for a complete list of metrics configuration settings.
More about container monitoringedit
If you’re monitoring Docker containers or Kubernetes pods, you can use autodiscovery to automatically change the configuration settings in response to changes in your containers. Autodiscovery ensures that even when your container configuration changes, data is still collected. To learn how to do this, see Metricbeat autodiscover configuration