Logstash Processing Pipeline
editLogstash Processing Pipeline
editThe Logstash event processing pipeline has three stages: inputs → filters → outputs. Inputs generate events, filters modify them, and outputs ship them elsewhere. Inputs and outputs support codecs that enable you to encode or decode the data as it enters or exits the pipeline without having to use a separate filter.
Inputs
editYou use inputs to get data into Logstash. Some of the more commonly-used inputs are:
-
file: reads from a file on the filesystem, much like the UNIX command
tail -0F - syslog: listens on the well-known port 514 for syslog messages and parses according to the RFC3164 format
- redis: reads from a redis server, using both redis channels and redis lists. Redis is often used as a "broker" in a centralized Logstash installation, which queues Logstash events from remote Logstash "shippers".
- beats: processes events sent by Filebeat.
For more information about the available inputs, see Input Plugins.
Filters
editFilters are intermediary processing devices in the Logstash pipeline. You can combine filters with conditionals to perform an action on an event if it meets certain criteria. Some useful filters include:
- grok: parse and structure arbitrary text. Grok is currently the best way in Logstash to parse unstructured log data into something structured and queryable. With 120 patterns built-in to Logstash, it’s more than likely you’ll find one that meets your needs!
- mutate: perform general transformations on event fields. You can rename, remove, replace, and modify fields in your events.
- drop: drop an event completely, for example, debug events.
- clone: make a copy of an event, possibly adding or removing fields.
- geoip: add information about geographical location of IP addresses (also displays amazing charts in Kibana!)
For more information about the available filters, see Filter Plugins.
Outputs
editOutputs are the final phase of the Logstash pipeline. An event can pass through multiple outputs, but once all output processing is complete, the event has finished its execution. Some commonly used outputs include:
- elasticsearch: send event data to Elasticsearch. If you’re planning to save your data in an efficient, convenient, and easily queryable format… Elasticsearch is the way to go. Period. Yes, we’re biased :)
- file: write event data to a file on disk.
- graphite: send event data to graphite, a popular open source tool for storing and graphing metrics. http://graphite.readthedocs.io/en/latest/
- statsd: send event data to statsd, a service that "listens for statistics, like counters and timers, sent over UDP and sends aggregates to one or more pluggable backend services". If you’re already using statsd, this could be useful for you!
For more information about the available outputs, see Output Plugins.
Codecs
editCodecs are basically stream filters that can operate as part of an input or
output. Codecs enable you to easily separate the transport of your messages from
the serialization process. Popular codecs include json, msgpack, and plain
(text).
- json: encode or decode data in the JSON format.
- multiline: merge multiple-line text events such as java exception and stacktrace messages into a single event.
For more information about the available codecs, see Codec Plugins.
Fault Tolerance
editLogstash keeps all events in main memory during processing. Logstash responds to a SIGTERM by attempting to halt inputs and waiting for pending events to finish processing before shutting down. When the pipeline cannot be flushed due to a stuck output or filter, Logstash waits indefinitely. For example, when a pipeline sends output to a database that is unreachable by the Logstash instance, the instance waits indefinitely after receiving a SIGTERM.
To enable Logstash to detect these situations and terminate with a stalled pipeline, use the --allow-unsafe-shutdown flag.
Unsafe shutdowns, force-kills of the Logstash process, or crashes of the Logstash process for any other reason result in data loss. Shut down Logstash safely whenever possible.
Execution Model
editThe Logstash pipeline coordinates the execution of inputs, filters, and outputs. The following schematic sketches the data flow of a pipeline:
input threads | pipeline worker threads
Pipelines in the current release of Logstash process filtering and output in the same thread. Prior to the 2.2 release of Logstash, filtering and output were distinct stages handled by distinct threads. This change to the Logstash architecture improves performance and enables future persistence capabilities. The new pipeline substantially improves thread liveness, decreases resource usage, and increases throughput. The current Logstash pipeline is a micro-batching pipeline, which is inherently more efficient than a one-at-a-time approach. These efficiencies come in many places, two of the more prominent ones being a reduction in contention and a consequent improvement in thread liveness. These efficiencies are especially noticeable on many-core machines.
Each input {} statement in the Logstash configuration file runs in its own thread. Inputs write events to a common Java SynchronousQueue. This queue holds no events, instead transferring each pushed event to a free worker, blocking if all workers are busy. Each pipeline worker thread takes a batch of events off this queue, creating a buffer per worker, runs the batch of events through the configured filters, then runs the filtered events through any outputs. The size of the batch and number of pipeline worker threads are configurable. The following pseudocode illustrates the process flow:
synchronous_queue = SynchronousQueue.new
inputs.each do |input|
  Thread.new do
    input.run(synchronous_queue)
  end
end
num_pipeline_workers.times do
  Thread.new do
    while true
      batch = take_batch(synchronous_queue, batch_size, batch_delay)
      output_batch(filter_batch(batch))
    end
  end
end
wait_for_threads_to_terminate()
There are three configurable options in the pipeline, --pipeline-workers, --pipeline-batch-size, and --pipeline-batch-delay.
The --pipeline-workers or -w parameter determines how many threads to run for filter and output processing. If you find that events are backing up, or that the CPU is not saturated, consider increasing the value of this parameter to make better use of available processing power. Good results can even be found increasing this number past the number of available processors as these threads may spend significant time in an I/O wait state when writing to external systems. Legal values for this parameter are positive integers.
The --pipeline-batch-size or -b parameter defines the maximum number of events an individual worker thread collects before attempting to execute filters and outputs. Larger batch sizes are generally more efficient, but increase memory overhead. Some hardware configurations require you to increase JVM heap size by setting the LS_HEAP_SIZE variable to avoid performance degradation with this option. Values of this parameter in excess of the optimum range cause performance degradation due to frequent garbage collection or JVM crashes related to out-of-memory exceptions. Output plugins can process each batch as a logical unit. The Elasticsearch output, for example, issues bulk requests for each batch received. Tuning the -b parameter adjusts the size of bulk requests sent to Elasticsearch.
The --pipeline-batch-delay option rarely needs to be tuned. This option adjusts the latency of the Logstash pipeline. Pipeline batch delay is the maximum amount of time in milliseconds that Logstash waits for new messages after receiving an event in the current pipeline worker thread. After this time elapses, Logstash begins to execute filters and outputs.The maximum time that Logstash waits between receiving an event and processing that event in a filter is the product of the pipeline_batch_delay and pipeline_batch_size settings.
Notes on Pipeline Configuration and Performance
editThe total number of inflight events is determined by the product of the pipeline_workers and pipeline_batch_size parameters. This product is referred to as the inflight count. Keep the value of the inflight count in mind as you adjust the pipeline_workers and pipeline_batch_size parameters. Pipelines that intermittently receive large events at irregular intervals require sufficient memory to handle these spikes. Configure the LS_HEAP_SIZE option accordingly.
The Logstash defaults are chosen to provide fast, safe performance for most users. To increase performance, increase the number of pipeline workers or the batch size, taking into account the following suggestions:
Measure each change to make sure it increases, rather than decreases, performance. Ensure that you leave enough memory available to cope with a sudden increase in event size. For example, an application that generates exceptions that are represented as large blobs of text. The number of workers may be set higher than the number of CPU cores since outputs often spend idle time in I/O wait conditions.
Threads in Java have names and you can use the jstack, top, and the VisualVM graphical tools to figure out which resources a given thread uses.
On Linux platforms, Logstash labels all the threads it can with something descriptive. For example, inputs show up as [base]<inputname, filter/output workers show up as [base]>workerN, where N is an integer. Where possible, other threads are also labeled to help you identify their purpose.
Profiling the Heap
editWhen tuning Logstash you may have to adjust the heap size. You can use the VisualVM tool to profile the heap. The Monitor pane in particular is useful for checking whether your heap allocation is sufficient for the current workload. The screenshots below show sample Monitor panes. The first pane examines a Logstash instance configured with too many inflight events. The second pane examines a Logstash instance configured with an appropriate amount of inflight events. Note that the specific batch sizes used here are most likely not applicable to your specific workload, as the memory demands of Logstash vary in large part based on the type of messages you are sending.
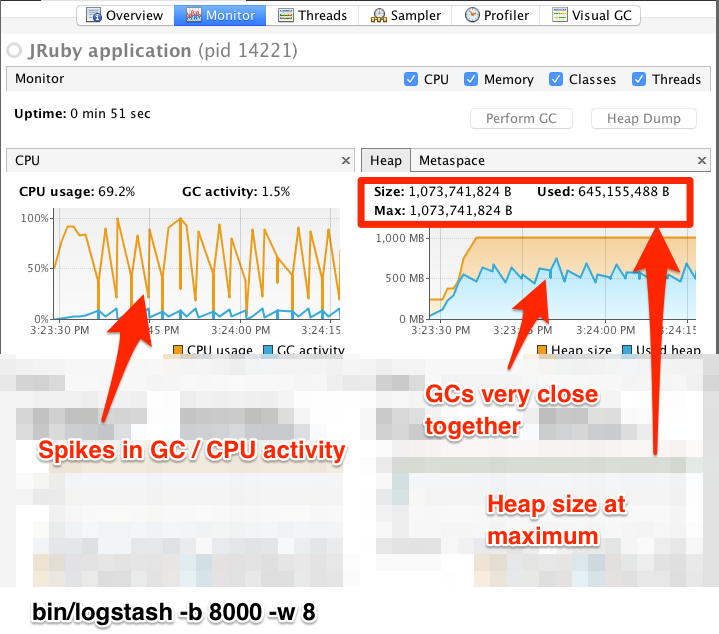
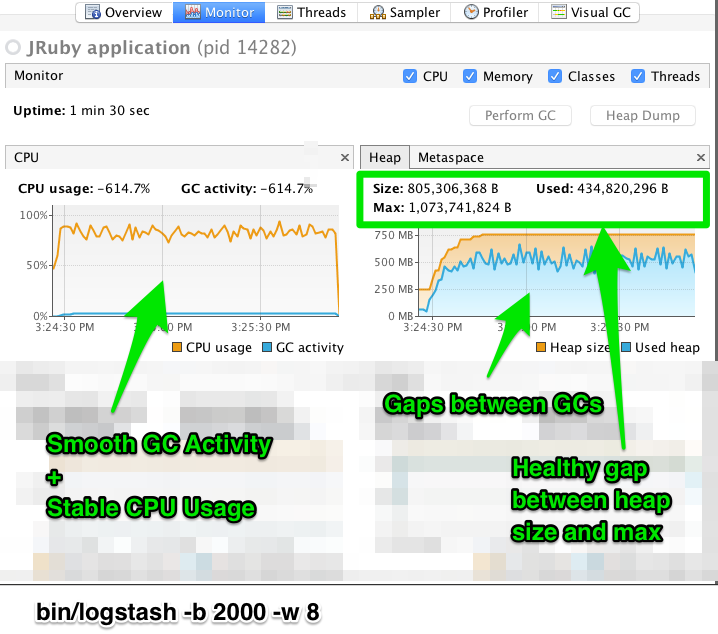
In the first example we see that the CPU isn’t being used very efficiently. In fact, the JVM is often times having to stop the VM for “full GCs”. Full garbage collections are a common symptom of excessive memory pressure. This is visible in the spiky pattern on the CPU chart. In the more efficiently configured example, the GC graph pattern is more smooth, and the CPU is used in a more uniform manner. You can also see that there is ample headroom between the allocated heap size, and the maximum allowed, giving the JVM GC a lot of room to work with.
Examining the in-depth GC statistics with a tool similar to the excellent VisualGC plugin shows that the over-allocated VM spends very little time in the efficient Eden GC, compared to the time spent in the more resource-intensive Old Gen “Full” GCs.
As long as the GC pattern is acceptable, heap sizes that occasionally increase to the maximum are acceptable. Such heap size spikes happen in response to a burst of large events passing through the pipeline. In general practice, maintain a gap between the used amount of heap memory and the maximum. This document is not a comprehensive guide to JVM GC tuning. Read the official Oracle guide for more information on the topic. We also recommend reading Debugging Java Performance.