What’s new in 8.4
editWhat’s new in 8.4
editHere are the highlights of what’s new and improved in 8.4. For detailed information about this release, check the release notes.
Previous versions: 8.3 | 8.2 | 8.1 | 8.0
Elastic release docs now in one place
editWith the new Check out the latest from Elastic page, you can easily find all the latest information about Elastic features and updates in a single location. This includes release highlights, breaking changes, bug fixes, and more.

Meaningful data view names
editYou can now change the name of your data views, unique from the pattern of indices they match. This allows you to give data views more meaningful names, making them easier to find and manage.
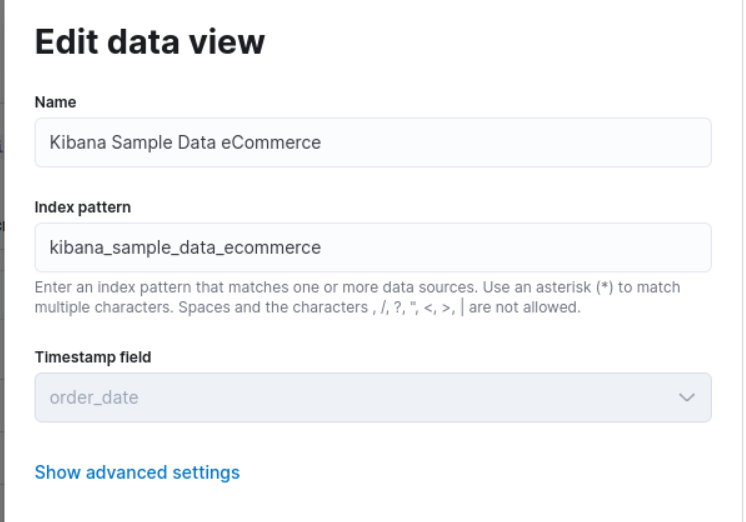
The pattern is still visible via a tooltip.

Visualization editors
editMetric visualization
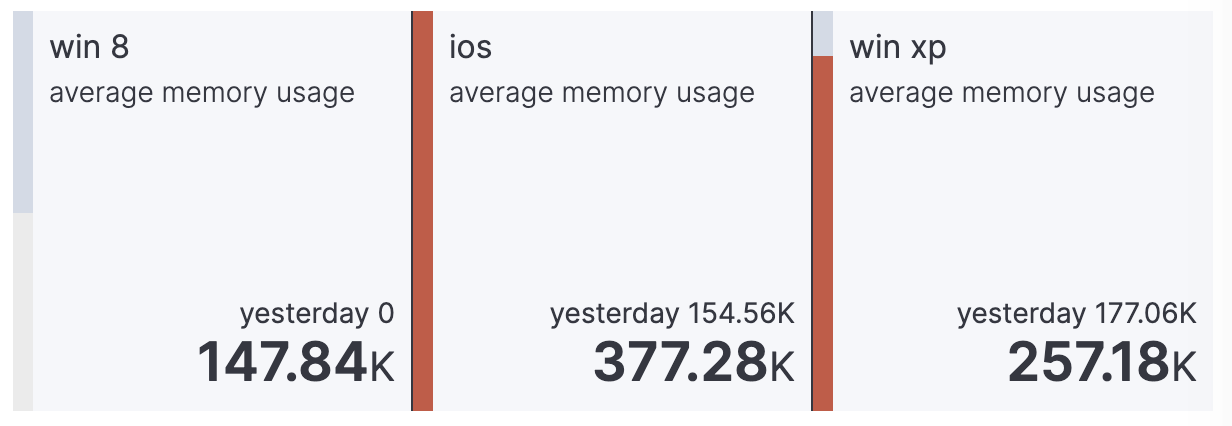
edit[preview] This functionality is in technical preview and may be changed or removed in a future release. Elastic will work to fix any issues, but features in technical preview are not subject to the support SLA of official GA features. The new Metric visualization in Lens supports a consistent font sizing, allowing you to create more beautiful, multi-metric dashboards. For additional context, you can add a Secondary metric, which is useful for time shifts. Need to get multiple metrics arranged in a grid? Add the Break down by field. To boost your customization options, you can also include a range of values defined by a known static domain, dynamic quick function, or a custom formula.
Rank by custom metrics
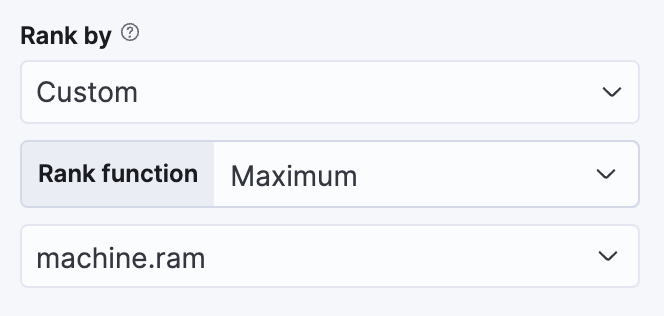
editThe new Rank by option in Lens allows you to rank your top values by an additional custom metric.
Standard deviation quick function
editThis simple, but powerful, statistical summary helps you understand more about how your metrics behave in Lens.
Drag and drop between layers
editIt’s now easier to work with multiple layers in Lens. Drag and drop fields between your layers when they are coming from the same data view.
Custom bounds for number histograms
editIn Lens, set extended data bounds for your number histogram axis, so you can display a known domain regardless of what data is showing.
Filter top values for specific terms
editYou can customize the Lens Top values function to include or exclude specific terms. To filter for fields with multiple values, you can choose to use this functionality over the global search. This can help prevent you from accidentally filtering out too much data.
Maps
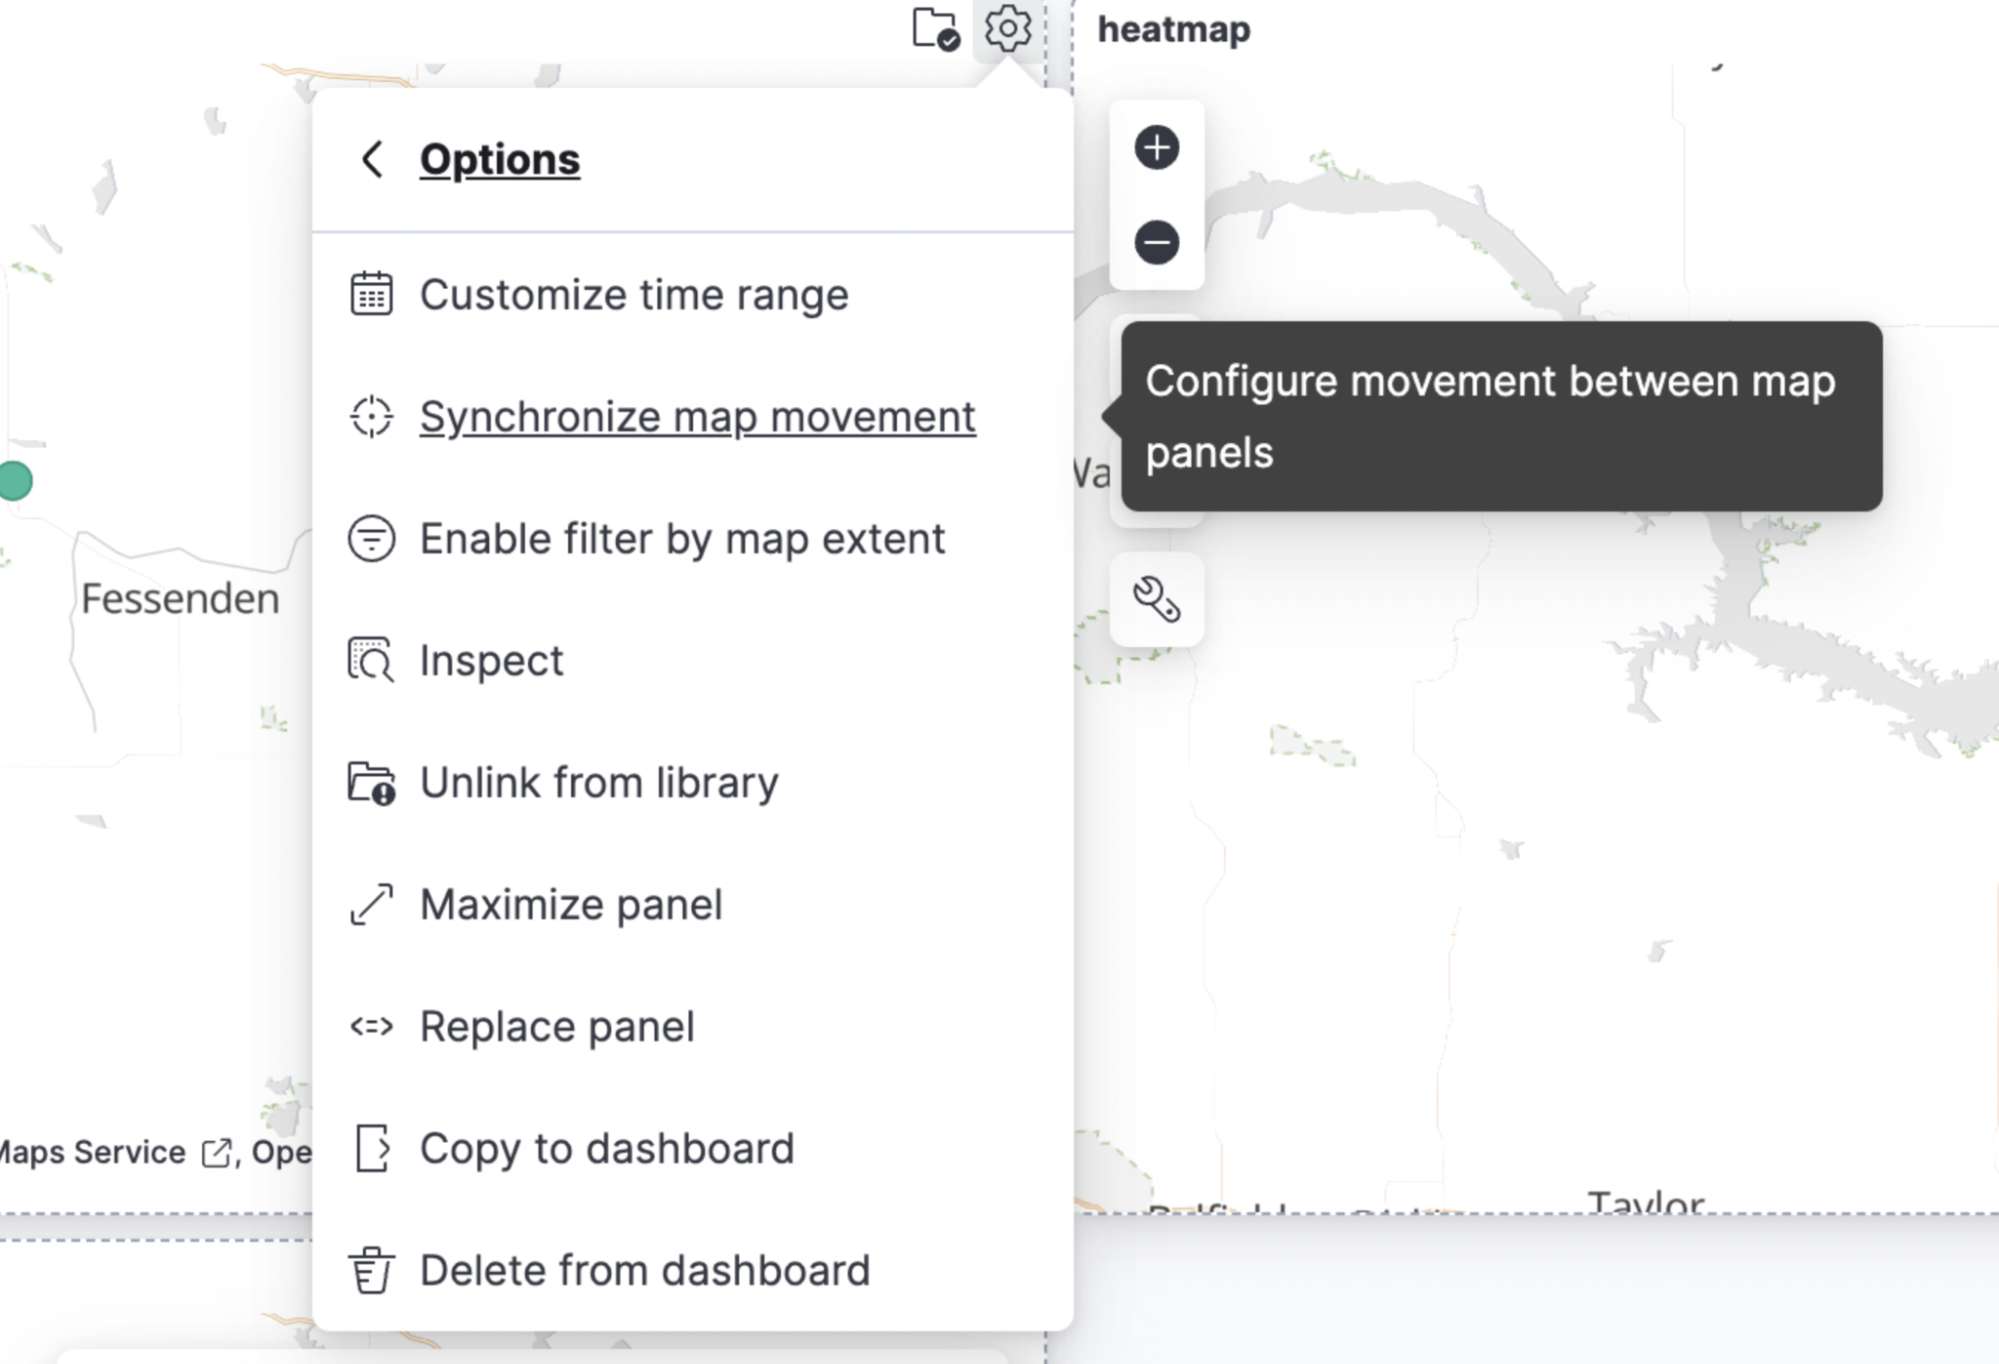
editSynchronize maps in dashboards
editYou can synchronize the maps on a dashboard, so when you zoom or move in one map, all maps move together. This enables you to see the same geo location for different data, accelerating time-to-insights.
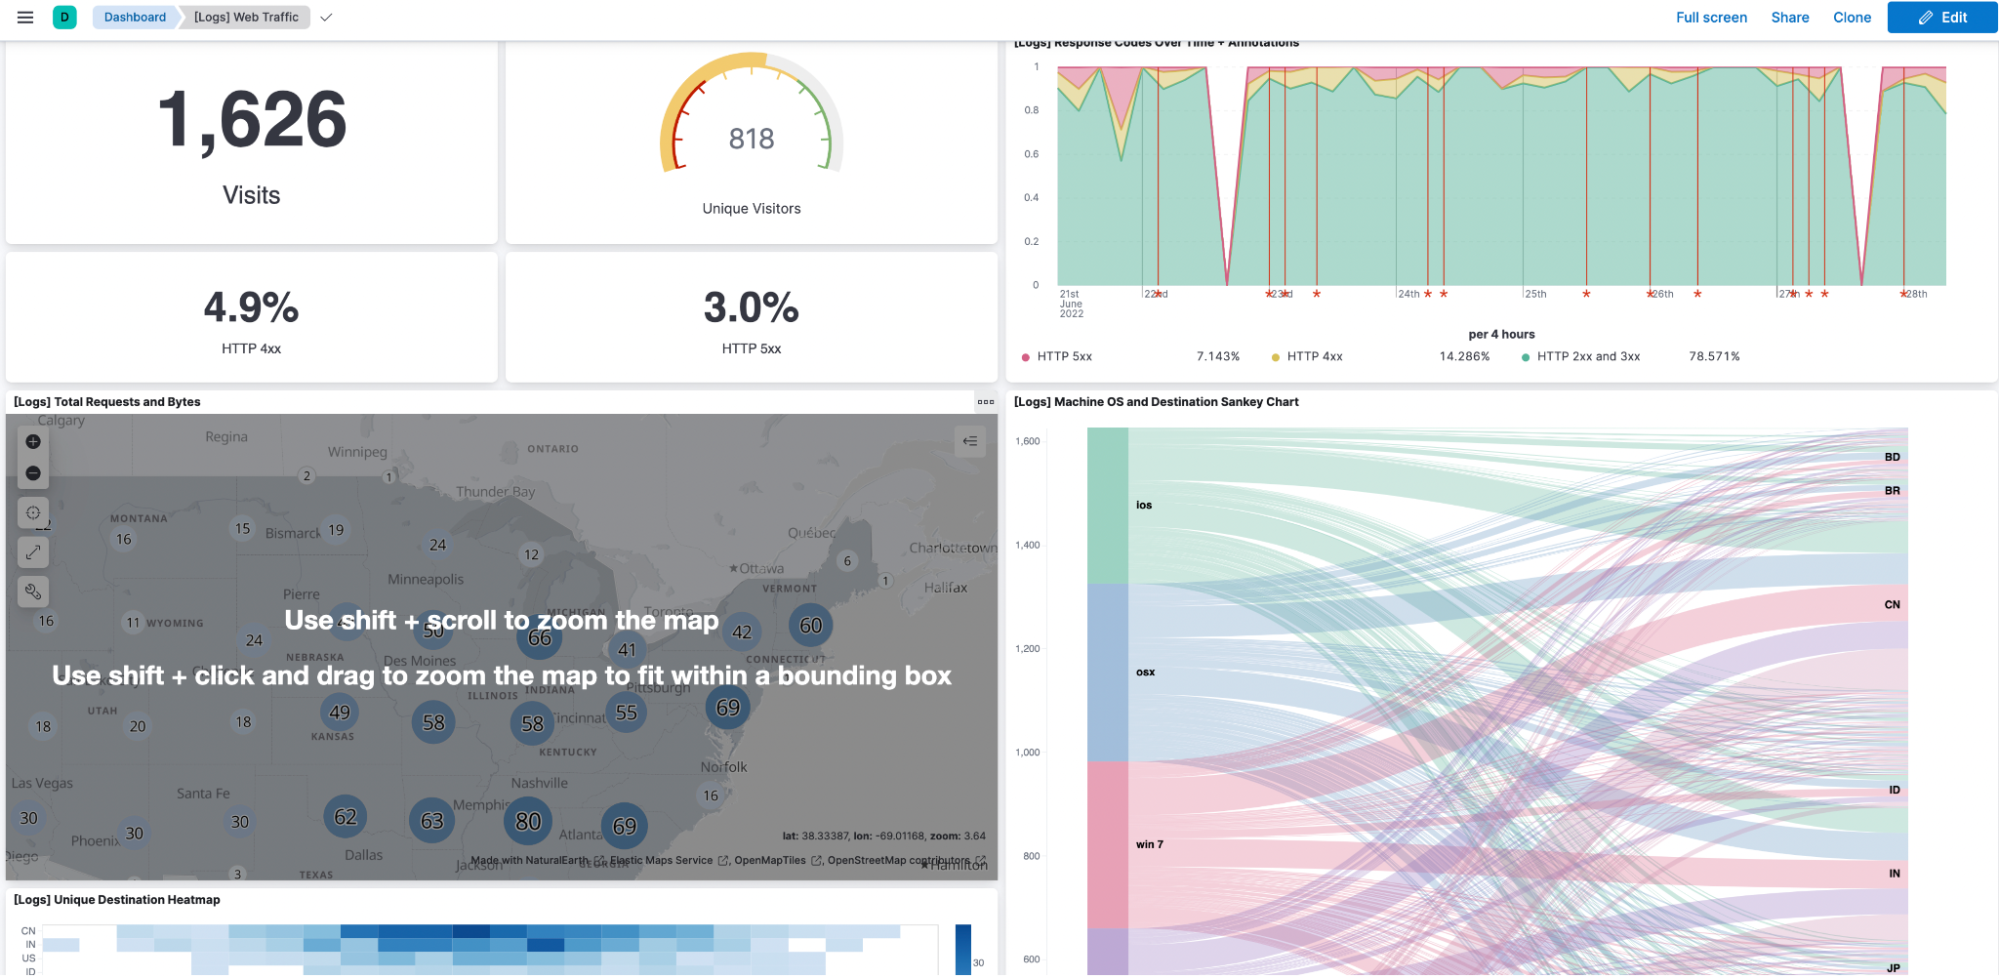
Keyboard controls for zoom
editZoom in and out of maps using Shift+scroll instead of clicking the map options. This makes maps more usable in dashboards, while also saving you time.
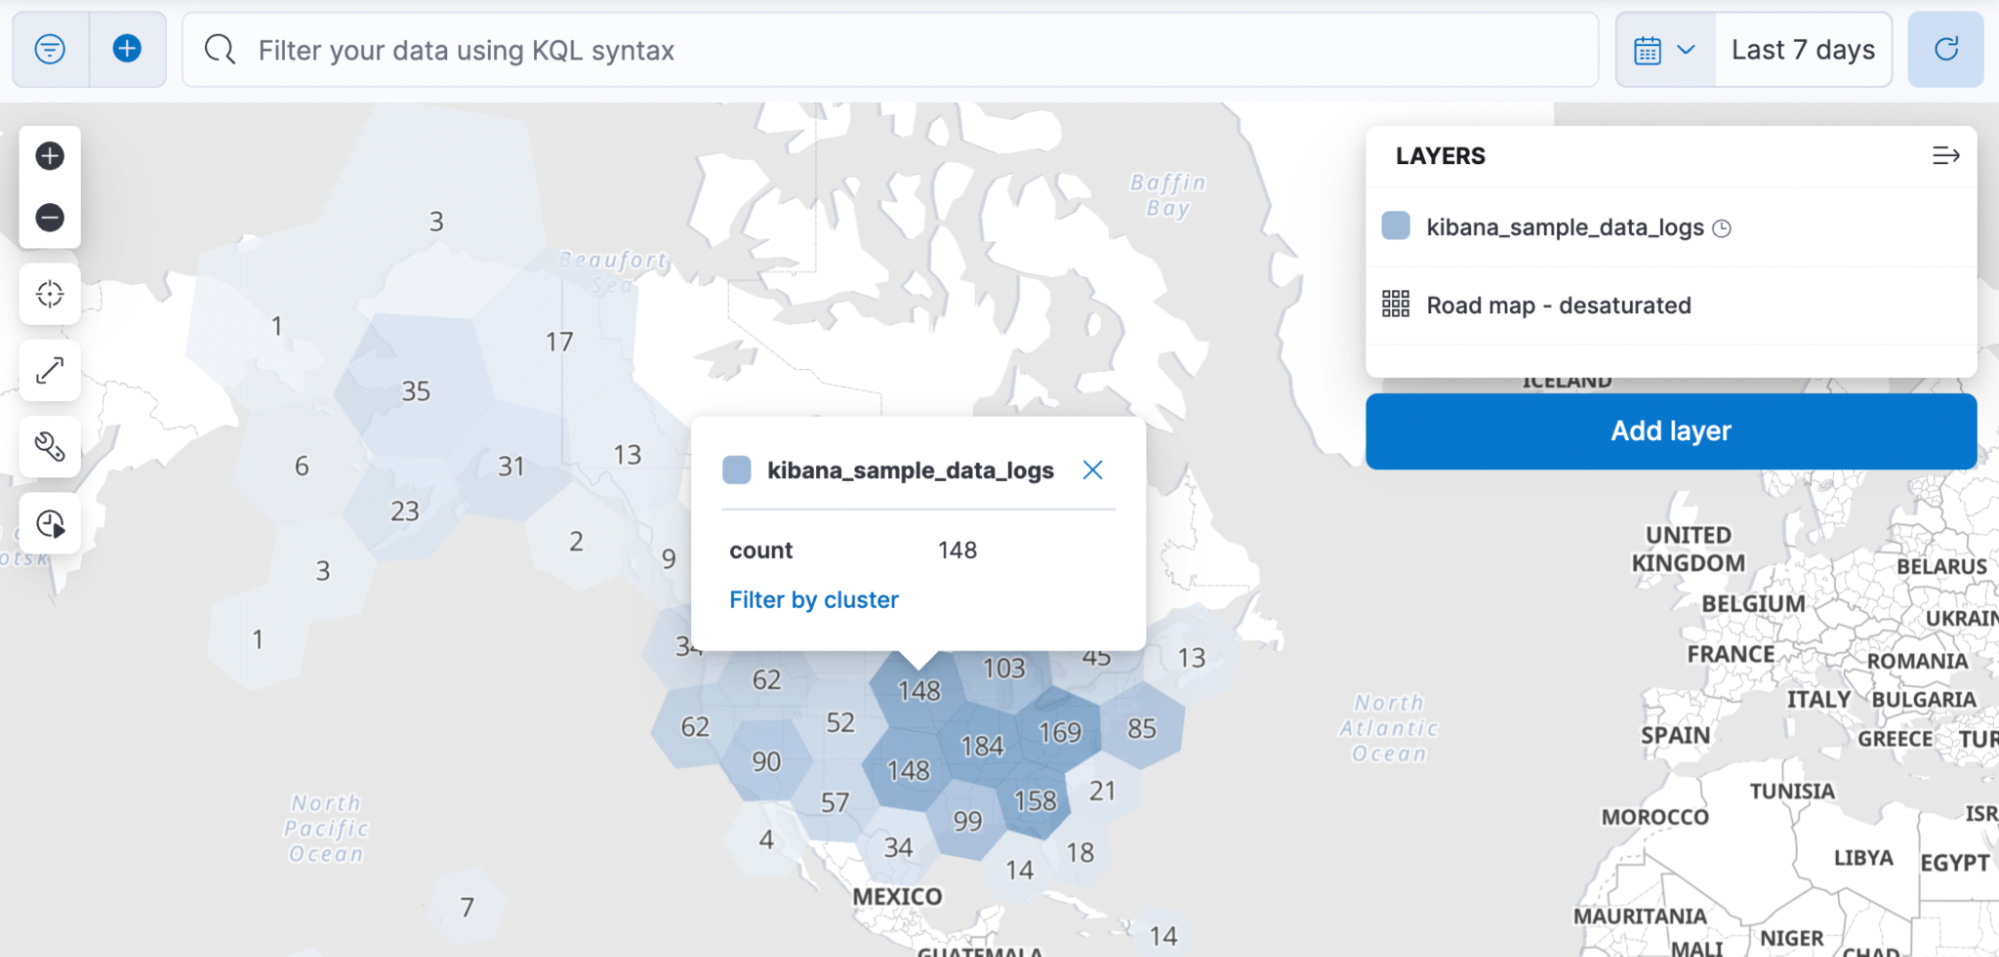
Filter by cluster
editFilter your map by cluster with one click. Before 8.4, filtering was only possible for individual documents.
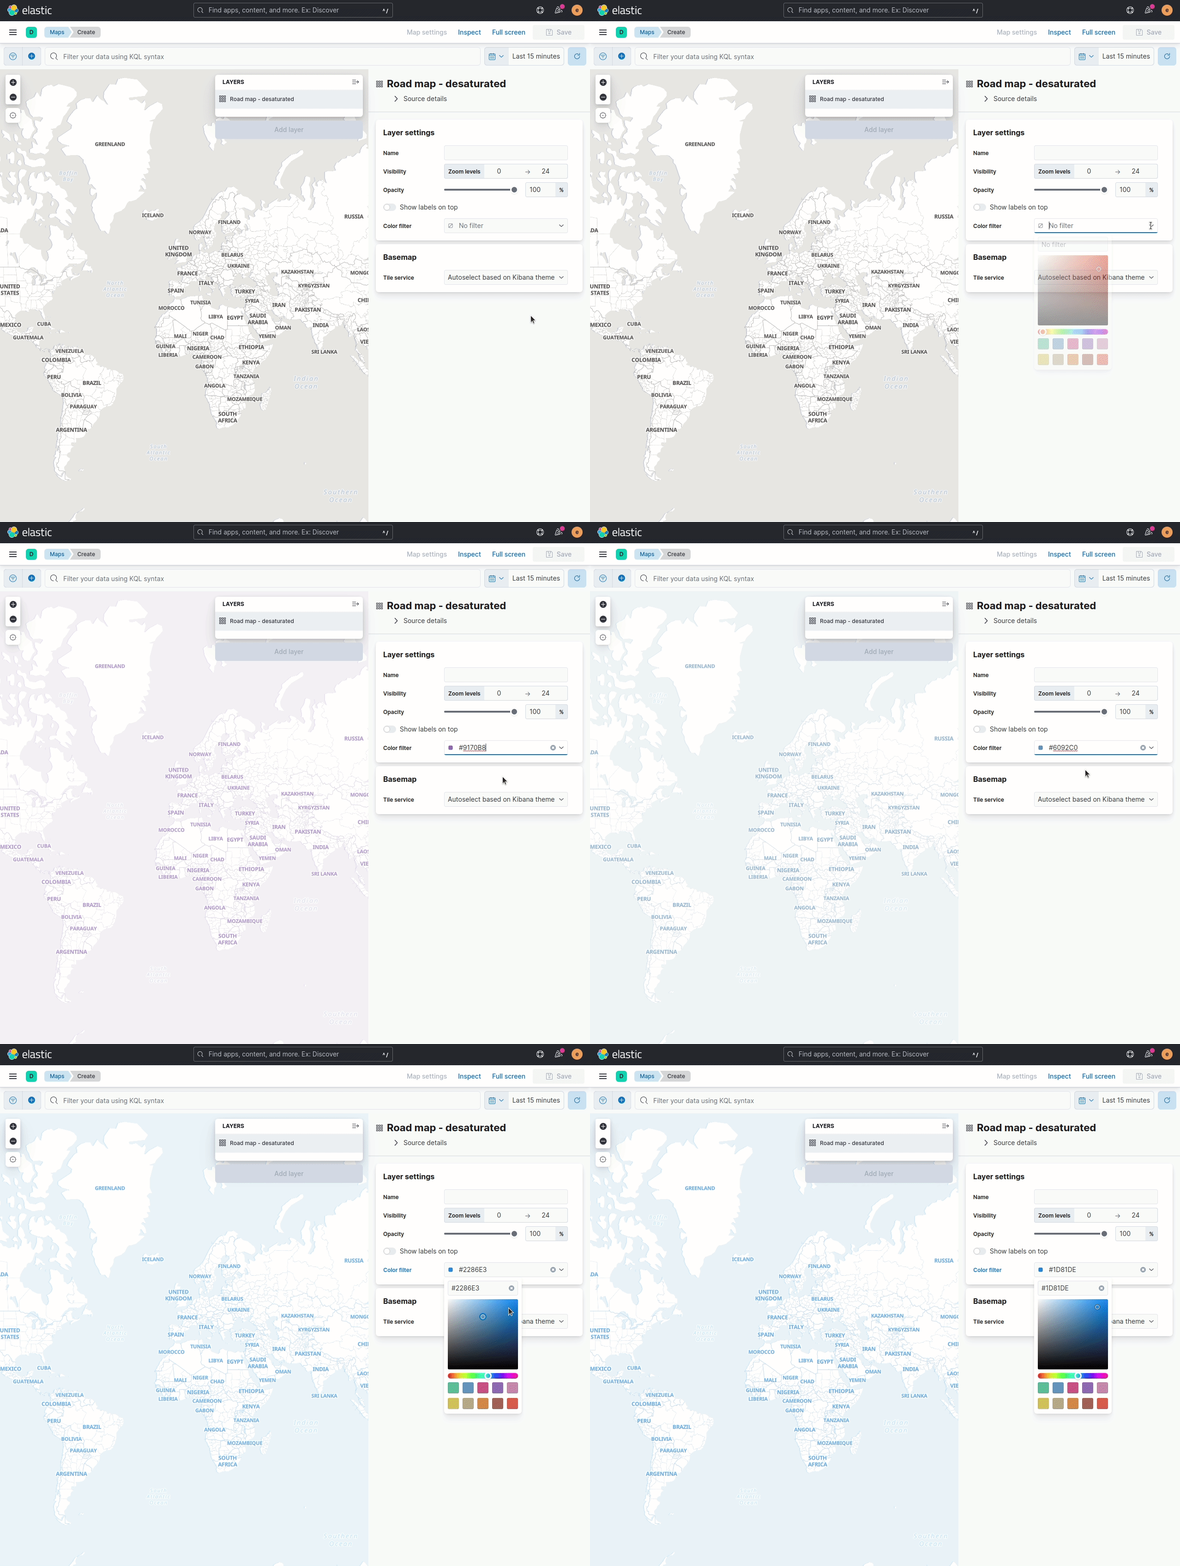
Customize basemap color
editCustomize the color of your Elastic Basemaps to adapt to your brand colors, or just to make it more beautiful and readable.
Machine Learning
editInference threading parameters
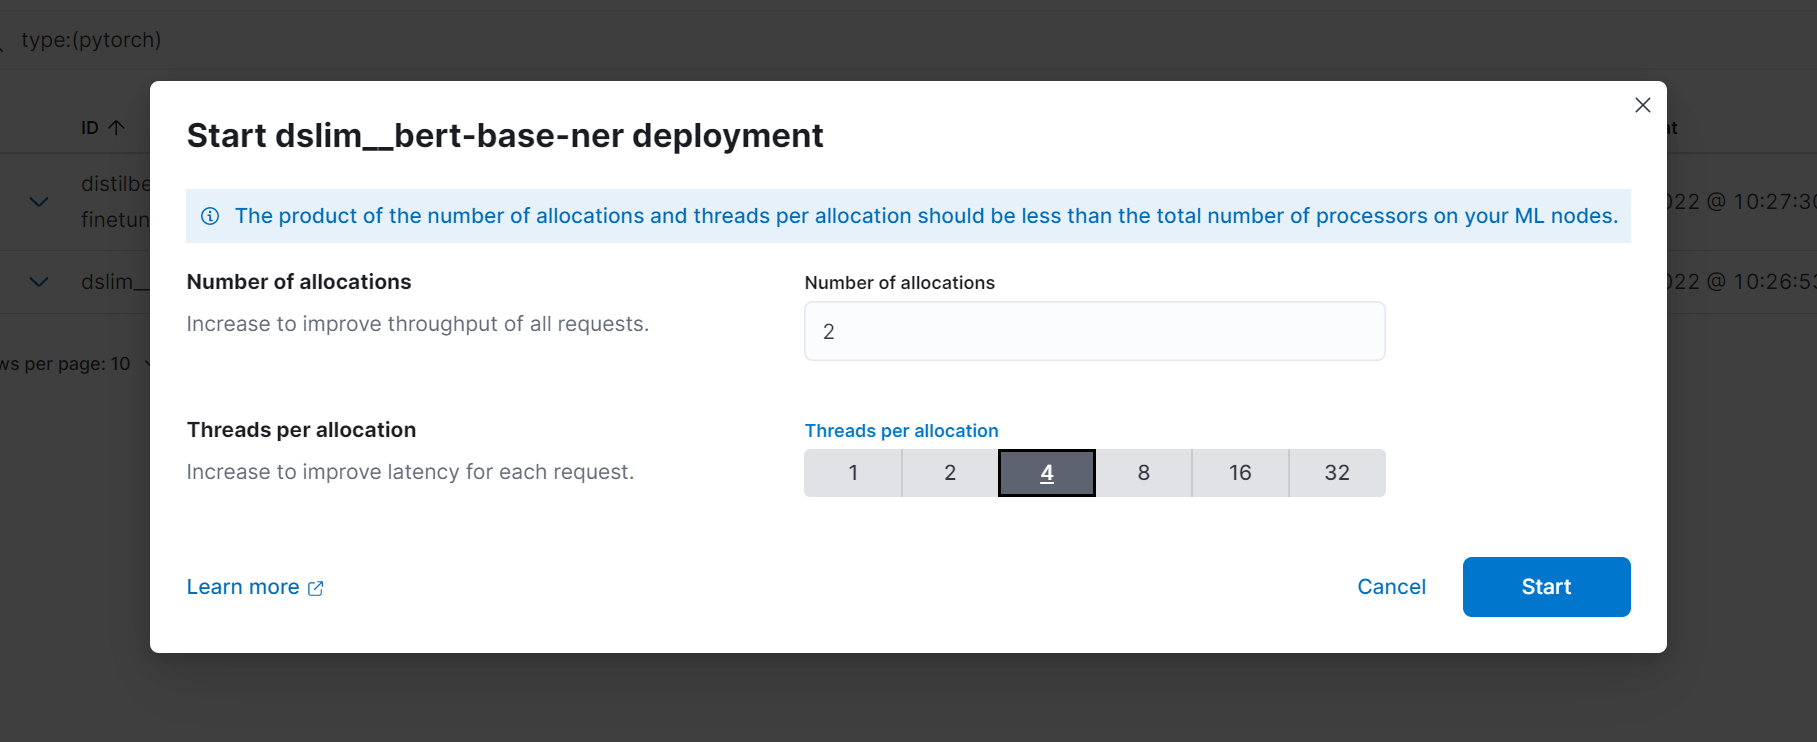
editWhen starting a trained model deployment, performance can be improved by
the threading parameters of number of allocations and threads per allocation.
Each allocation means the model gets another CPU thread for executing parallel inference requests, so increasing the number of allocations increases the throughput of all requests. In turn, threads per allocation sets the number of threads used by each model allocation during inference, so increasing this parameter improves the latency for each request.
From 8.4, you can set these two parameters in the UI when starting a trained model deployment.
Log rate spikes in AIOps
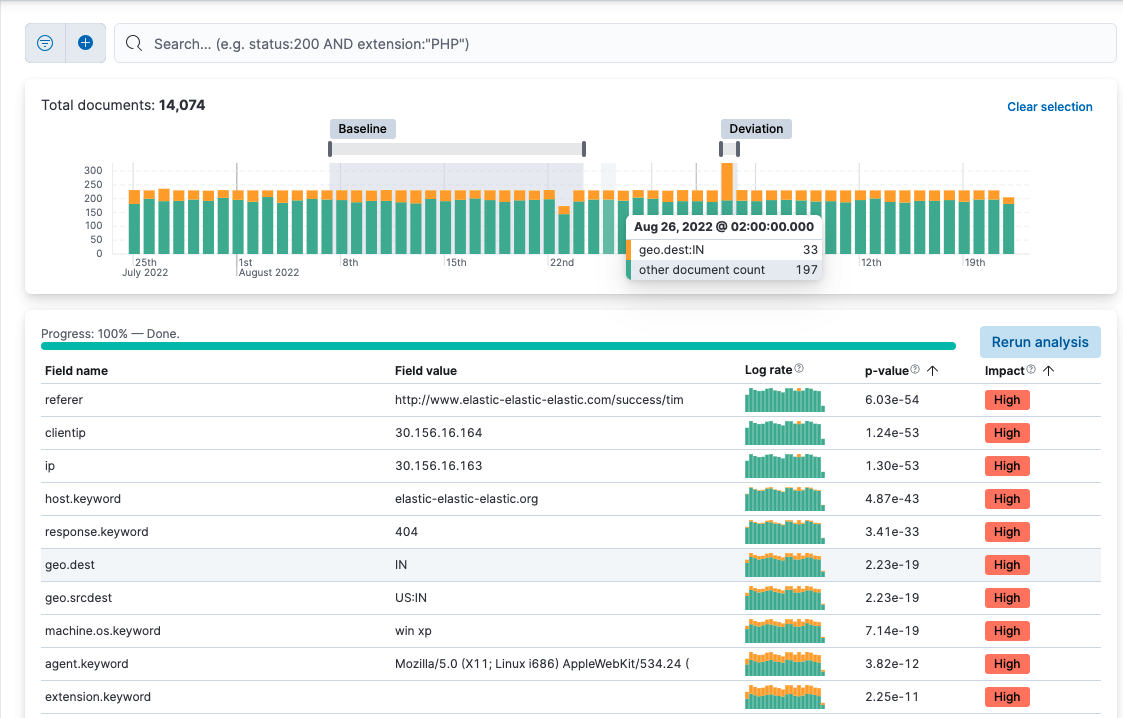
editLog spike analysis provides an on-demand option to quickly discover possible root cause of a log rate increase. This option compares the data across the other fields and values in the index and identifies which ones most likely correlate to the spike in a recent baseline.
Data Visualizer chart optimized
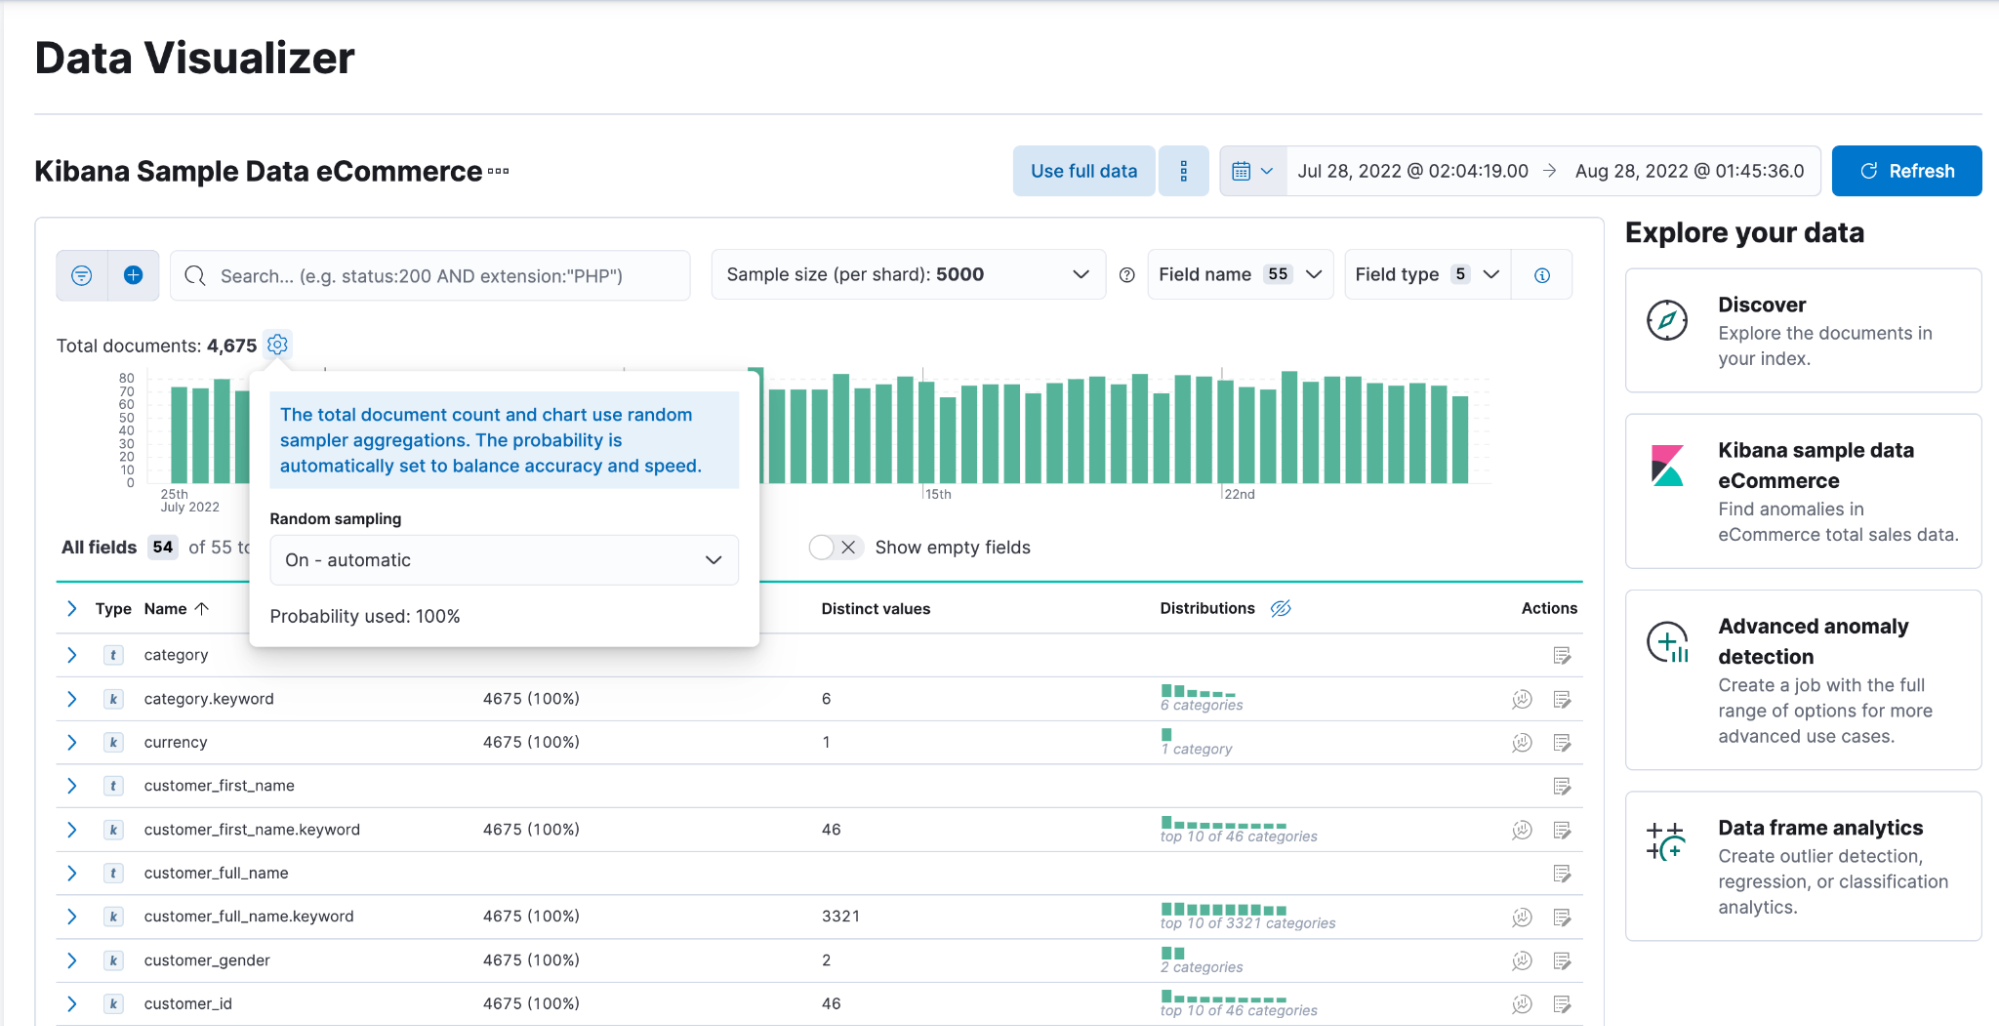
editThe Data Visualizer now uses the random sampler aggregation when creating the document count histogram chart. The new sampling method ensures that a sufficient sample size is used to draw the chart and calculate the document count. Random sampling is on by default and automatically calculates the optimal possibility. You can also set this manually or turn it off.
Alerting
editSet query type for Elasticsearch query
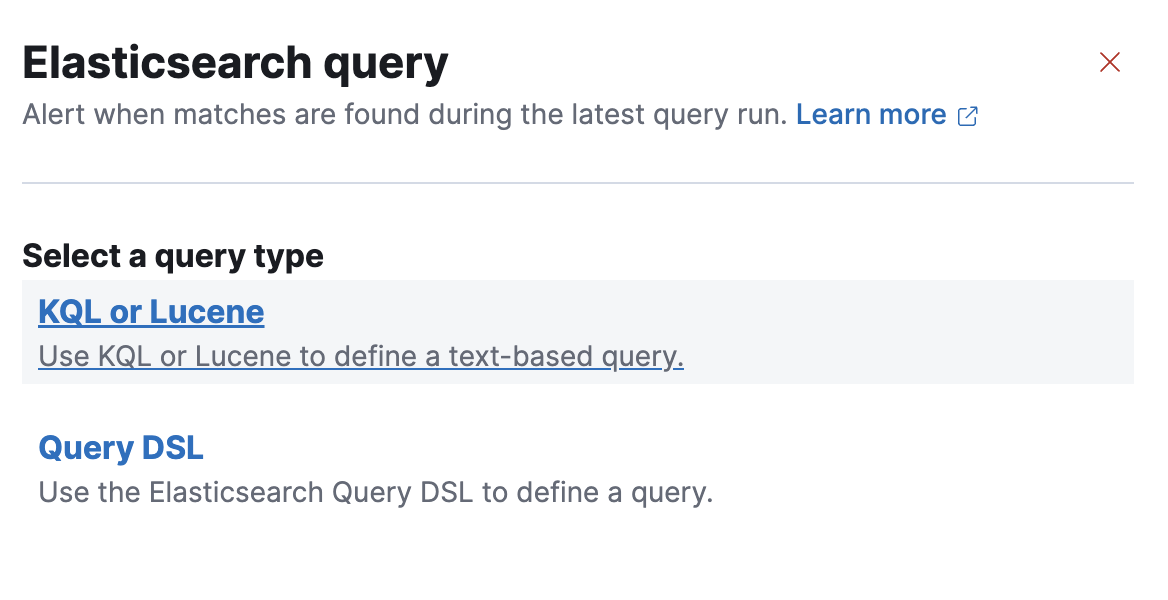
editYou can now specify a KQL or Lucene query when building Elasticsearch query rules in Stack Management.
Webhook - Case Management connector
editThe new Webhook - Case Management connector and action enable you to send POST, PUT, and GET requests to a case management RESTful API web service. You can use this connector with cases in Observability, Stack Management, and Elastic Security.
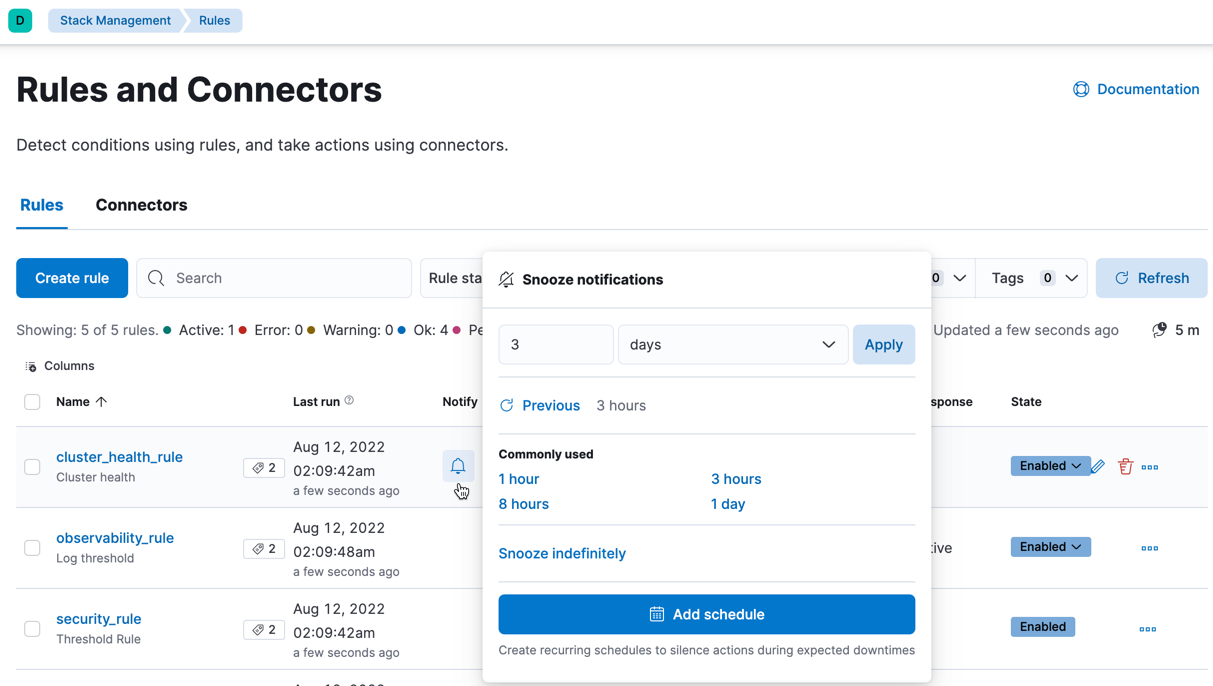
Schedules for snoozing notifications
editStarting in 8.2, you could suppress the notifications and actions for your rules for a specific duration. In 8.4, you can also schedule these single or recurring downtimes to start and end at specific dates and times.
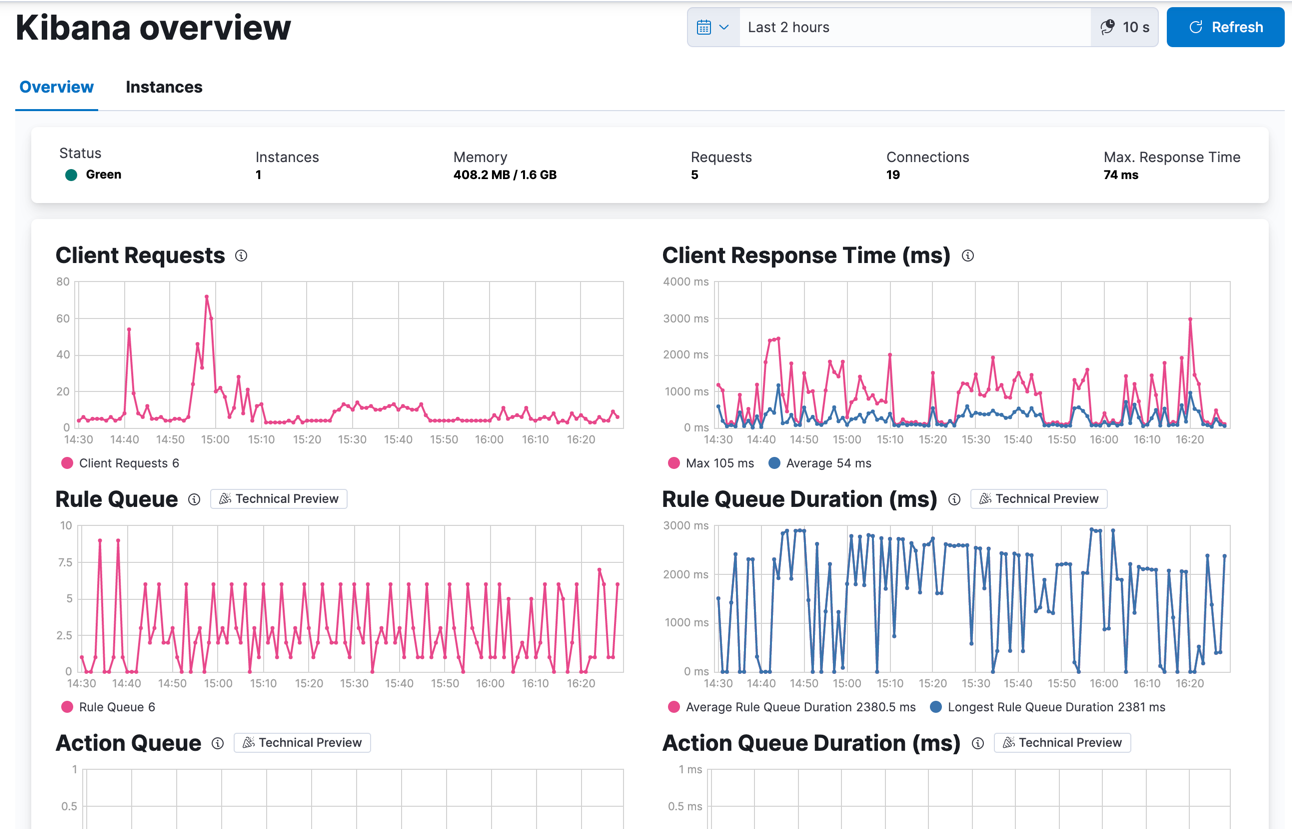
New metrics for rules and actions
editYou can now ship metrics related to alerting features to your monitoring cluster by using Elastic Agent or Metricbeat. Click Overview and Instances in the Kibana section of Stack Monitoring to see visualizations about the rules and actions that are queued, running, or failing.
Console
editComments in request body
editEver look at a massive request body and struggle to recall why you configured it that way? In 8.4, you can write comments inside the request body and leave yourself notes about its configuration. You can even comment out specific lines to temporarily disable them and try out other variations of the request.
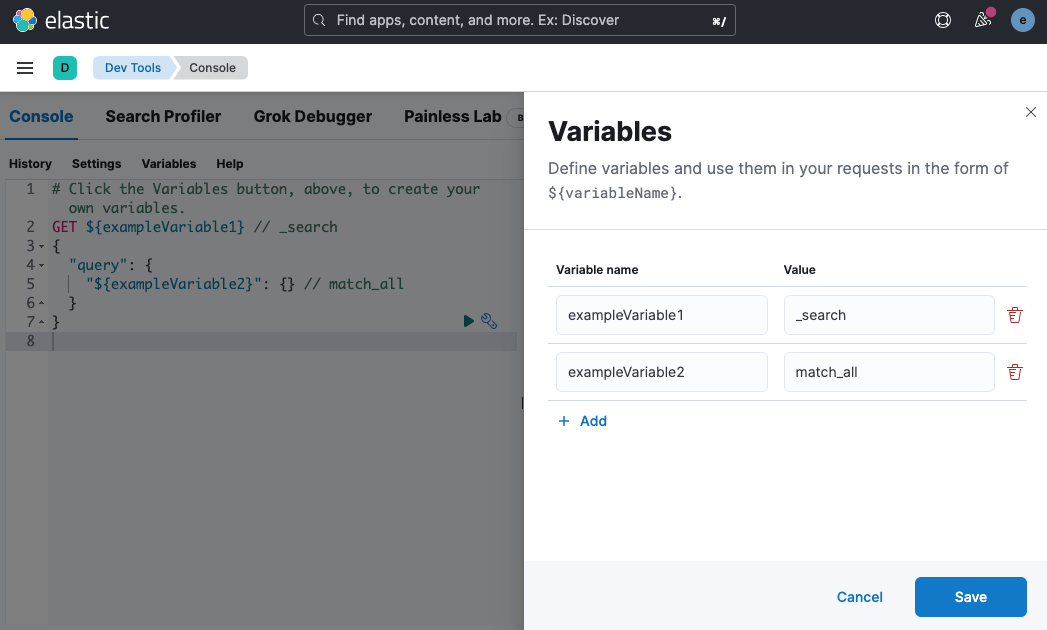
Variable definitions
editYou can now define variables in Console and reuse them in your requests. You can refer to variables in the paths and bodies of your requests, as many times as you like.
HTTP status badges
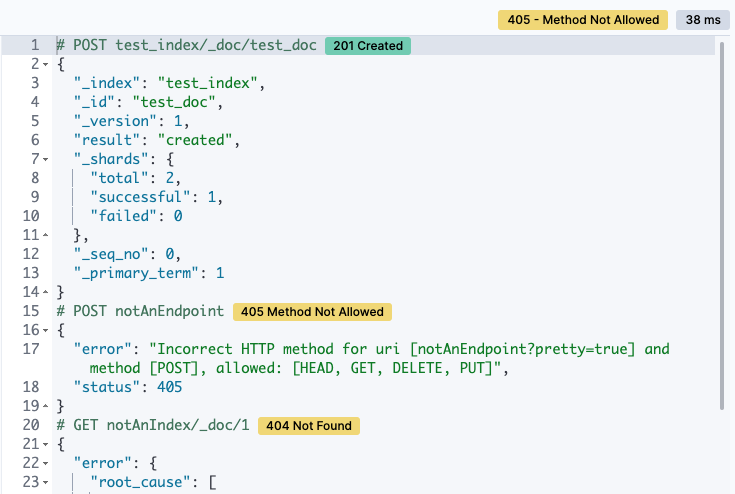
editEach response now includes an HTTP status badge. This makes it easier to tell which request failed and which succeeded. The most severe status is at the top of the UI, so you can quickly get a sense of whether any of your requests had trouble.
