Get up and runningedit
This functionality is in beta and is subject to change. The design and code is less mature than official GA features and is being provided as-is with no warranties. Beta features are not subject to the support SLA of official GA features.
To get up and running with infrastructure monitoring, you need:
-
An Elasticsearch cluster and Kibana (version 6.5 or later) with a basic license. To learn how to get up and running quickly, see Getting started with the Elastic Stack.
You can skip having to install Elasticsearch and Kibana by using our hosted Elasticsearch Service on Elastic Cloud. The Elasticsearch Service is available on both AWS and GCP. Try out the Elasticsearch Service for free.
- Beats shippers installed on each system you want to monitor
Install Beats shippersedit
To populate the Infrastructure UI with metrics and log data, you need to install and configure the following shippers:
- Metricbeat for metrics
- Filebeat for log data
To learn how to install and configure the shippers, do one of the following:
-
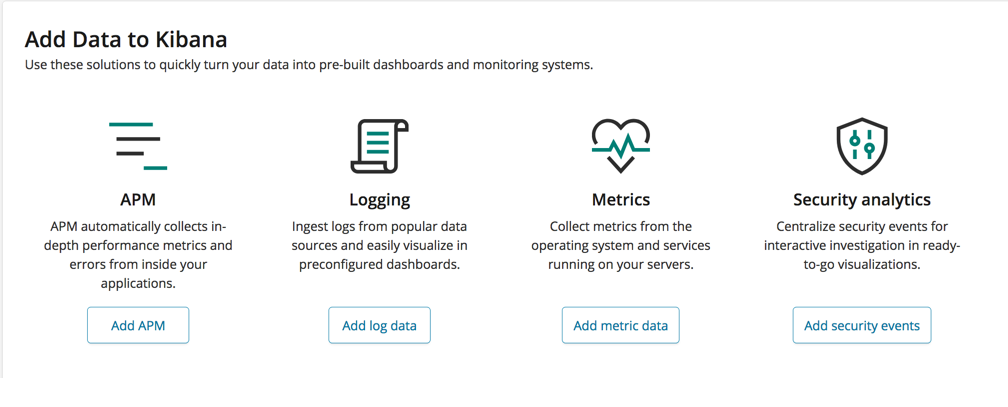
Follow the instructions in the Add Data section of the Kibana home page. Click Add log data or Add metrics, and follow the links for the types of data you want to collect.
-
If your data source isn’t in the list, or you want to install Beats the old fashioned way:
- Follow the Metricbeat getting started and enable modules for the metrics you want to collect.
- Follow the Filebeat modules quick start and enable modules for the logs you want to collect. If there is no module for the logs you want to collect, see the Filebeat getting started to learn how to configure inputs.
For either approach, you need to enable modules in Filebeat and Metricbeat to populate the Infrastructure UI with data.
Which modules and configuration options do I enable?edit
To populate the Hosts view and add logs, enable:
-
Metricbeat
systemmodule (enabled by default) -
Filebeat
systemmodule -
Other Filebeat modules needed for
your environment, such as
apache2,redis, and so on -
Metricbeat
add_host_metadataprocessor (enabled by default) -
Metricbeat
add_cloud_metadataprocessor (enabled by default)
To populate the Docker view and add logs, enable:
To populate the Kubernetes view and add logs, enable:
More about monitoring containersedit
If you’re monitoring containers, you can use autodiscover to automatically apply configuration changes in response to changes in your containers. To learn how, see: