Infrastructure UIedit
This functionality is in beta and is subject to change. The design and code is less mature than official GA features and is being provided as-is with no warranties. Beta features are not subject to the support SLA of official GA features.
After you have infrastructure monitoring up and running and data is streaming to Elasticsearch, use the Infrastructure UI in Kibana to monitor your infrastructure and identify problems in real time.
Monitor your hosts and containersedit
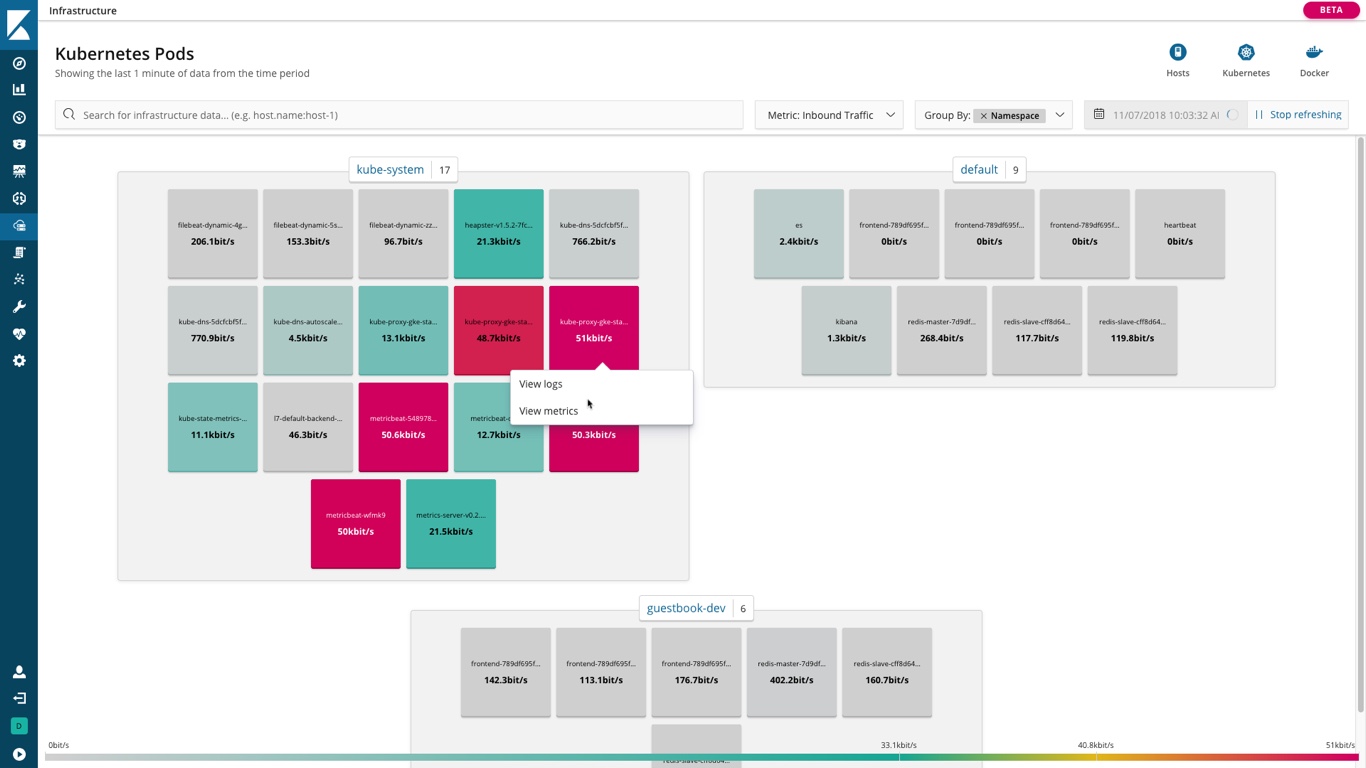
You start with an overview of the hosts and containers running in your infrastructure. The overview provides a summary of high-level metrics, like CPU usage, system load, memory usage, and network traffic, to help you assess the overall health of your systems and services.
You can search for specific hosts to filter the overview, or enter Kibana Query Language for more sophisticated searches. To see data about related hosts or containers, you can group by important characteristics, such as availability zones for cloud infrastructure, or namespaces for containers.
When you see a potential problem, you can drill down into individual nodes to view related metrics and logs.
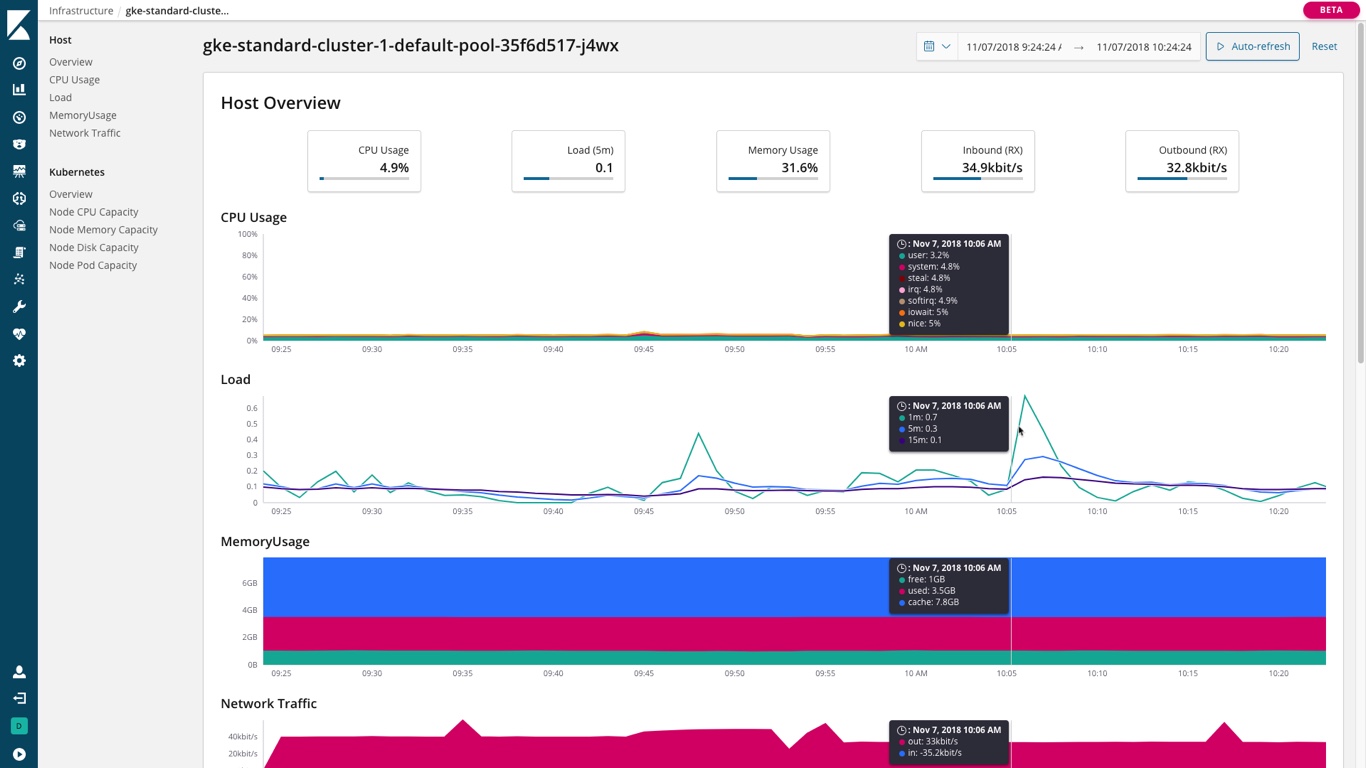
View detailed metricsedit
After drilling down into the metrics for a specific node, you see details like CPU usage, system load, memory usage, and network traffic over time. You can place your cursor over a point in the timeline to see detailed metrics captured at that moment in the timeline.
View related logsedit
You can drill down into the logs for a specific node and explore the log data in the Logs UI.