Use ES|QL in the Kibana UI
The ES|QL editor lets you write, run, and manage ES|QL queries across Kibana. Use it to query and aggregate your data, create visualizations, and set up alerts.
The ES|QL editor is available in the following areas of Kibana:
- Discover: Explore and analyze your data using ES|QL queries, visualize results, and save your findings to dashboards.
- Dashboards: Create ES|QL-powered visualization panels and interactive controls.
- Alerting: Create alerting rules based on ES|QL queries.
- Elastic Security solution: Use ES|QL for threat hunting, detection rules, and investigation workflows.
Find the complete list of supported commands, functions, and operators in the ES|QL reference.
A skill is available to help AI agents with this topic.
Every ES|QL query starts with a source command that retrieves data:
FROMallows you to define the data sources to query by specifying data streams, ES|QL views, indices, or aliases.TSis optimized for querying time series data streams.-
PROMQLqueries time series data through the ES|QL editor using Prometheus Query Language (PromQL) syntax.
You can then chain one or more processing commands using pipe (|) characters. For example, WHERE filters rows and STATS aggregates data:
FROM kibana_sample_data_logs
| WHERE response.keyword == "200"
| STATS total_bytes = SUM(bytes) BY geo.dest
When querying many indices at once without filters, the response might be too large. If you encounter a content length error, use DROP or KEEP to limit the number of fields returned.
ES|QL keywords are case-insensitive. FROM, from, and From are all equivalent.
The ES|QL editor includes several built-in tools to help you write queries efficiently.
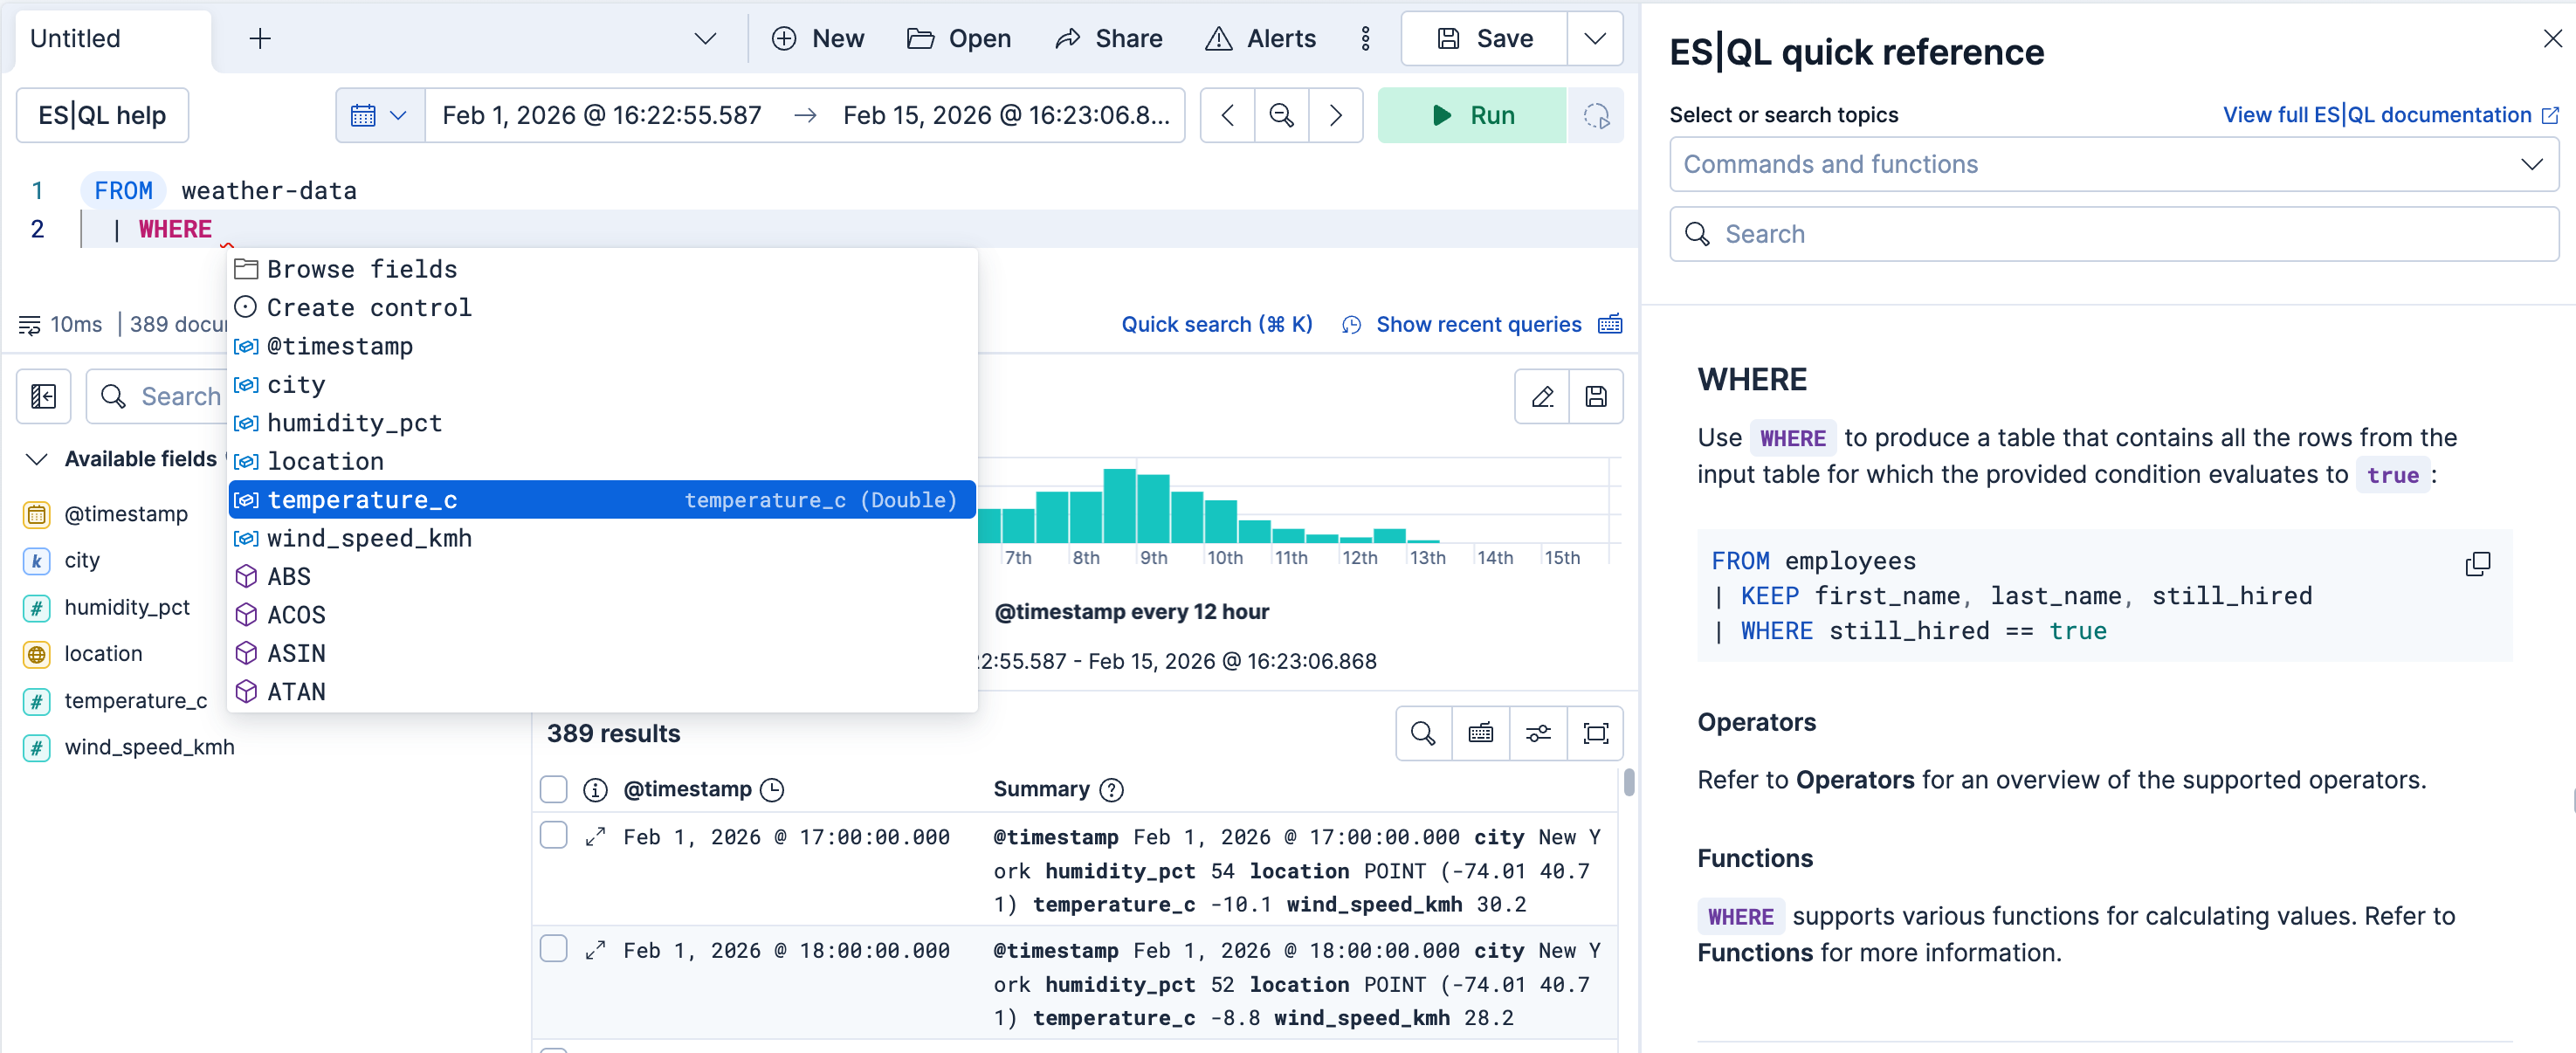
ES|QL features in-app help, inline suggestions, and an autocomplete menu so you can get started faster and don't have to leave the application to check syntax.

For readability, you can put each processing command on a new line and add indentation. Use the Prettify query button from the query editor's footer to format your query automatically. You can also adjust the editor's height by dragging its bottom border.

A query might result in warnings, for example when querying an unsupported field type. When that happens, the query bar displays a warning symbol. To see the detailed warning, expand the query bar, and select warnings.
After running a query, the editor's footer displays statistics about the last run, including the number of documents processed. These statistics are available in Discover and in ES|QL visualizations in dashboards.
| Mac | Windows/Linux | Description |
|---|---|---|
| Cmd + Enter | Ctrl + Enter | Run a query |
| Cmd + / | Ctrl + / | Comment or uncomment the current line or selected lines |
| Cmd + i | Ctrl + i | Prettify query
|
| Cmd + k | Ctrl + k | Open Quick search |
You can find the list of shortcuts directly from the editor. Look for the 
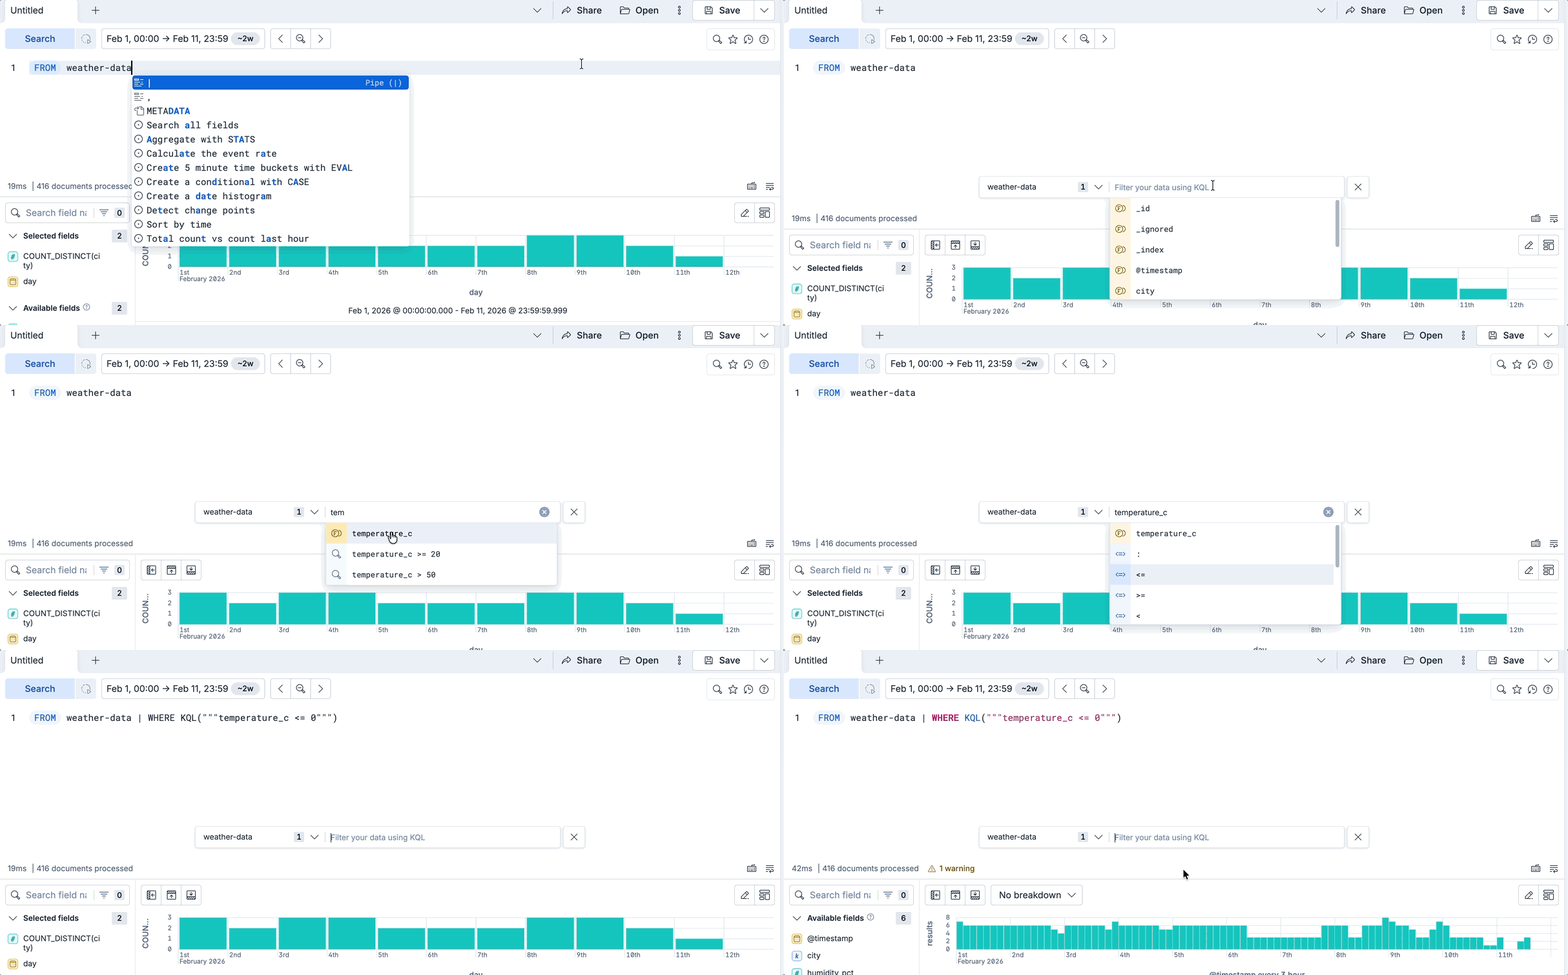
You can use the Quick search functionality of the ES|QL editor to translate a free-text or KQL search into a functioning ES|QL query with a WHERE KQL() clause. This can be useful if you're getting started with ES|QL or are familiar with KQL.
Select Quick search in the editor's footer, or press Cmd + k (Mac) or Ctrl + k (Windows/Linux) to open the Quick search bar.
Select the data sources to search.
Type the text you want to search for as free text or using KQL syntax.
Submit your search by pressing Enter. The editor generates a new ES|QL query that overwrites the current query and runs it. It includes a
FROMcommand based on the data sources you selected (orTSif the data source is a time series data stream), and aWHERE KQL()command that contains the text you typed in the search bar. The editor saves previously run queries in the query history if you need to restore them.The Quick search bar closes automatically when you press Enter, start typing in the editor or click outside of it.
Refine your query with any other ES|QL command or function that you need.

Some ES|QL commands have dedicated editor features beyond autocomplete, such as in-editor index or policy creation.
The ES|QL editor supports LOOKUP JOIN commands and suggests lookup mode indices and join condition fields.
In Discover, LOOKUP JOIN commands let you create or edit lookup indices directly from the editor. Find more information in Using ES|QL > Create and edit lookup indices from queries.
The ES|QL ENRICH command enables you to enrich your query dataset with fields from another dataset. Before you can use ENRICH, you need to create and execute an enrich policy. If a policy exists, autocomplete suggests it. If not, select Click to create to create one.

For detailed steps to create an enrich policy from the editor, refer to Enrich your data.
To display data within a specified time range, you can use the standard time filter, custom time parameters, or a WHERE command.
Kibana enables the standard time filter when the indices you're querying have a field named @timestamp.
If your indices do not have a field named @timestamp, you can use the ?_tstart and ?_tend parameters to specify a time range. These parameters work with any timestamp field and automatically sync with the time filter.
FROM my_index
| WHERE custom_timestamp >= ?_tstart AND custom_timestamp < ?_tend
You can also use the ?_tstart and ?_tend parameters with the BUCKET function to create auto-incrementing time buckets in ES|QL visualizations. For example:
FROM kibana_sample_data_logs
| STATS average_bytes = AVG(bytes) BY BUCKET(@timestamp, 50, ?_tstart, ?_tend)
You can also limit the time range using the WHERE command and the NOW function. For example, if the timestamp field is called timestamp, to query the last 15 minutes of data:
FROM kibana_sample_data_logs
| WHERE timestamp > NOW() - 15minutes
ES|QL queries use a timezone for date and time functions and time-based filtering. When you run ES|QL queries in Discover, dashboards, alerting, or Maps, Kibana automatically uses the timezone from the Time zone (dateFormat:tz) advanced setting. To change it:
- Go to Stack Management → Advanced Settings (or Management → Advanced Settings in Serverless).
- Search for Time zone (
dateFormat:tz). - Set it to Browser to use your browser's timezone, or choose a specific timezone such as UTC or America/New_York.
Avoid using the ES|QL SET time_zone directive in Kibana apps. SET time_zone changes how dates are computed by Elasticsearch, but Kibana still displays timestamps following the timezone defined in its dateFormat:tz advanced setting, which can produce confusing results.
ES|QL variables help you add interactive controls to your queries and make them more dynamic.
They're available for:
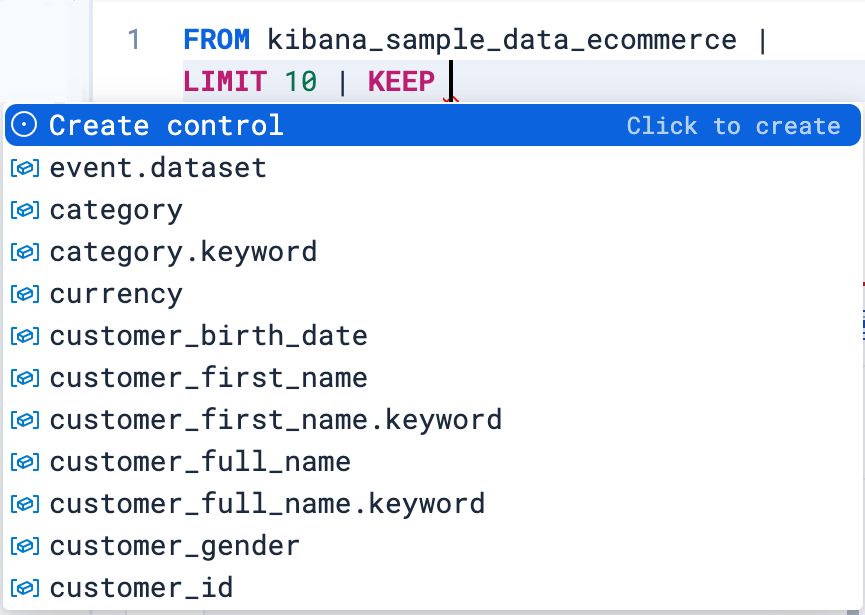
While you edit your ES|QL query, the autocomplete menu suggests adding a control when relevant or when you type
?in the query. Select Create control.
A menu opens to let you configure the control. This is where you can specify:
- The type of the control.
- For controls with Static values, enter available controls manually or select them from the dropdown list.
- For controls with Values from a query, write an ES|QL query to populate the list of options. This option is useful for dynamically retrieving control values or perform advanced actions such as defining chaining controls.
Tip - Only display values available for the selected time range
By linking the control to the global time range, the control only shows values that exist within the time range selected in the dashboard or Discover session. You can do that by specifying
WHERE @timestamp <= ?_tend AND @timestamp > ?_tstartin the control's query, or custom time parameters if your indices don't have a@timestampfield.
- The name of the control. You use this name to reference the control in ES|QL queries.
- Start the name with
?if you want the options to be simple static values. -
Start the name with ??if you want the options to be fields or functions.
- Start the name with
- The values users can select for this control. You can add multiple values from suggested fields, or type in custom values. If you selected Values from a query, you must instead write an ES|QL query at this step.
- The label of the control. This is the label displayed in Discover or in the dashboard.
-
Whether the control should allow selecting a single value or multiple values. This requires using the functions MV_CONTAINSorMV_INTERSECTSin your query.
- The type of the control.
Save the control.
The variable is inserted into your query, and the control appears.
Examples
Integrate filtering into your ES|QL experience
| WHERE field == ?valueFields in controls for dynamic group by
| STATS count=COUNT(*) BY ??fieldVariable time ranges? Bind function configuration settings to a control
| BUCKET(@timestamp, ?interval),Make the function itself dynamic
| STATS metric = ??function
You can create controls that let users select multiple values. To do that:
Add the
MV_CONTAINSfunction to your query, with the field as the first parameter (superset) and a variable as the second parameter (subset). For example:FROM logs-* | WHERE MV_CONTAINS(field, ?values)NoteMulti-selection is only available for
?valuesvariables. It is not available for??fieldsand??functionsvariables.NoteMV_CONTAINSchecks that all subset values are present. UseMV_INTERSECTSinstead if matching any subset value is enough.When defining the control, select the Allow multiple selections option.
Save the control.
The newly configured control becomes available and allows users to select multiple values.
The ES|QL editor keeps track of your queries so you can reuse and organize them.

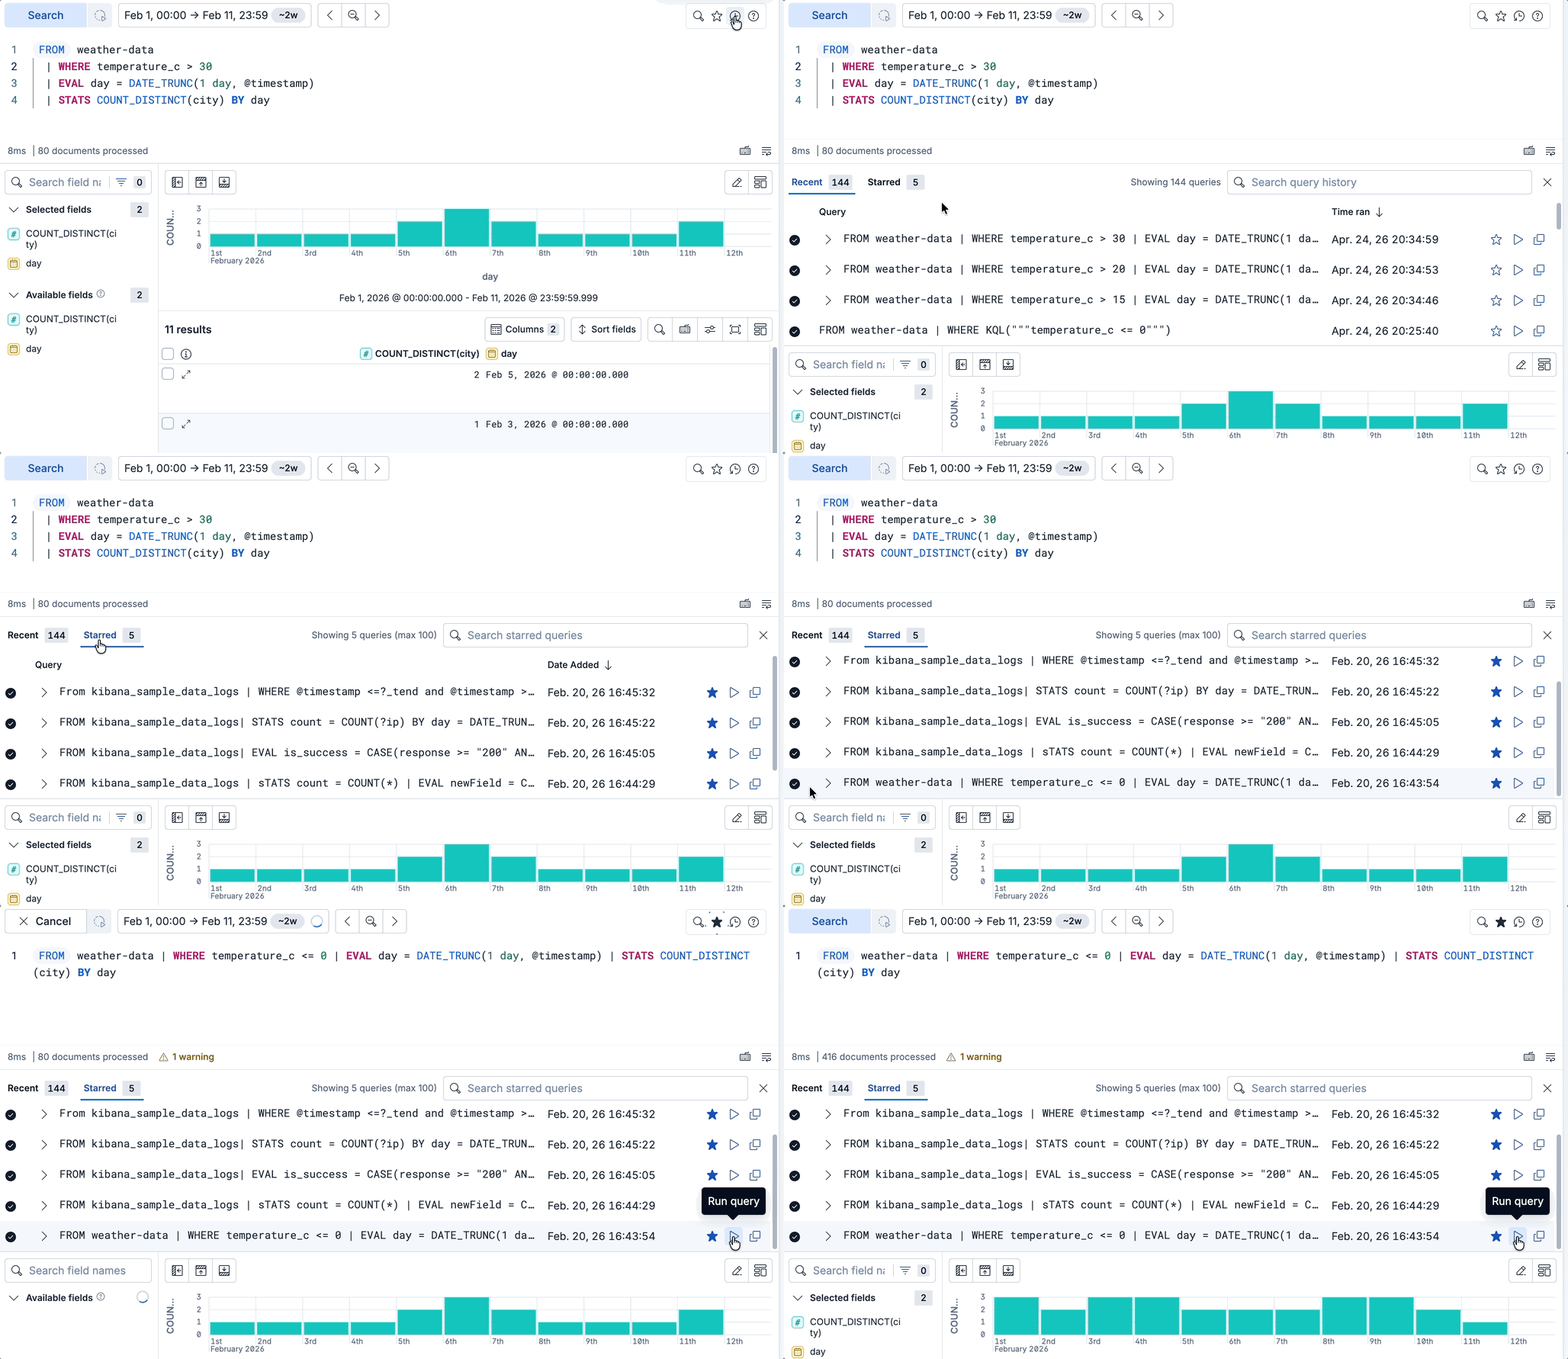
You can reuse your recent ES|QL queries in the query bar. In the query bar, select Show recent queries.
You can then:
- scroll through your most recent queries
-
search for specific queries of your history
The maximum number of queries in the history depends on the version you're using:
-
The query history can keep up to 50 KB of queries, which represents about 200 large queries, or about 300 short queries. -
The query history keeps your 20 most recent queries.
From the query history, you can mark some queries as favorite to find and access them faster later.
In the query bar, select Show recent queries.
From the Recent tab, you can star any queries you want.
In the Starred tab, find all the queries you have previously starred.
The SET directive lets you configure how Elasticsearch runs your ES|QL query. Place one or more SET statements at the start of your query, separated by semicolons:
SET setting_name = setting_value[, ..., settingN = valueN];
<query>
The ES|QL editor autocompletes supported settings and validates their values. Settings particularly useful from Kibana include:
approximation: Trade exact results for speed on largeSTATSqueries using random sampling.project_routing: Limit a cross-project search to specific projects.unmapped_fields: Choose how to handle fields that are not present in the index mapping.
The SET directive also supports a time_zone setting. However, to change the timezone used by your ES|QL queries in Kibana, update the dateFormat:tz advanced setting rather than using SET time_zone. Refer to Timezone handling for more information.
For the full list of supported settings and their parameters, refer to the SET directive reference.
When exact results are not strictly necessary, you can enable approximate results for STATS queries. Elasticsearch rewrites the query to use random sampling and returns estimates together with confidence intervals. The performance benefit grows with the size of the source data.
To approximate a STATS query with default settings, prepend SET approximation=true; to your query:
SET approximation=true;
FROM kibana_sample_data_logs
| WHERE @timestamp >= NOW()-30d
| STATS total_hits = COUNT(),
        avg_bytes = AVG(bytes)
  BY geo.dest
| SORT total_hits DESC
| LIMIT 5
To tune the sample size or disable confidence intervals, pass a map. For example:
SET approximation={"rows":5000000};increases the sample size from the default.SET approximation={"confidence_level":null};skips confidence interval computation for additional speedup.
The editor autocompletes these map parameters as you type.
For supported aggregation functions, output columns, tuning options, and limitations, refer to Approximate STATS queries.
When cross-project search is enabled and you have linked projects, you can add SET project_routing at the beginning of your ES|QL query to override the cross-project search scope and target specific projects:
SET project_routing = "_alias:my_other_project";
FROM logs-*
| WHERE log.level == "error"
| STATS count = COUNT(*) BY service.name
The editor autocompletes two built-in values when you type SET project_routing:
_alias:_origin: Search only the current (origin) project._alias:*: Search all linked projects.
You can use any valid project routing expression, including tag-based and named expressions. For more details on query-level overrides, refer to Managing cross-project search scope.
By default, an ES|QL query fails if it references a field that is not present in the mapping of any searched index. Use SET unmapped_fields at the start of your query to instead treat unmapped fields as null (NULLIFY) or load them from _source as keyword (LOAD). For example:
SET unmapped_fields="NULLIFY";
FROM partial_mapping_sample_data
| KEEP event_duration, unmapped_message
| SORT event_duration
| LIMIT 1
The ES|QL editor autocompletes the setting name and its accepted values. Once NULLIFY or LOAD is set, unmapped fields referenced in the query are added to autocomplete and treated like other columns. They stop being suggested if you drop or rename them.
The first time a query references an unmapped field, the editor shows a warning so you can confirm the reference is intentional and not a typo. After a KEEP or STATS command that limits the available columns, references to unmapped fields downstream are flagged as errors.
- ES|QL reference: Complete list of commands, functions, and operators.
- Using ES|QL in Discover: Hands-on tutorial and Discover-specific features like result tables, visualizations, and lookup indices.
- ES|QL for Elastic Security: Use cases and examples for threat hunting and detection rules.
- ES|QL visualizations: Create and edit ES|QL-based visualizations in dashboards.
- Dashboard controls: Add ES|QL-powered controls to dashboards.
-
Custom Vega visualizations: Use ES|QL queries as a data source in Vega and Vega-Lite visualizations.