Random sampler aggregation
editRandom sampler aggregation
editThis functionality is in technical preview and may be changed or removed in a future release. Elastic will work to fix any issues, but features in technical preview are not subject to the support SLA of official GA features.
The random_sampler aggregation is a single bucket aggregation that randomly
includes documents in the aggregated results. Sampling provides significant
speed improvement at the cost of accuracy.
The sampling is accomplished by providing a random subset of the entire set of documents in a shard. If a filter query is provided in the search request, that filter is applied over the sampled subset. Consequently, if a filter is restrictive, very few documents might match; therefore, the statistics might not be as accurate.
This aggregation is not to be confused with the
sampler aggregation. The
sampler aggregation is not over all documents; rather, it samples the first n
documents matched by the query.
GET kibana_sample_data_ecommerce/_search?size=0&track_total_hits=false
{
  "aggregations": {
    "sampling": {
      "random_sampler": {
        "probability": 0.1
      },
      "aggs": {
        "price_percentiles": {
          "percentiles": {
            "field": "taxful_total_price"
          }
        }
      }
    }
  }
}
Top-level parameters for random_sampler
edit-
probability -
(Required, float) The probability that a document will be included in the
aggregated data. Must be greater than 0, less than
0.5, or exactly1. The lower the probability, the fewer documents are matched. -
seed - (Optional, integer) The seed to generate the random sampling of documents. When a seed is provided, the random subset of documents is the same between calls.
How does the sampling work?
editThe aggregation is a random sample of all the documents in the index. In other words, the sampling is over the background set of documents. If a query is provided, a document is returned if it is matched by the query and if the document is in the random sampling. The sampling is not done over the matched documents.
Consider the set of documents [1, 2, 3, 4, 5]. Your query matches [1, 3, 5]
and the randomly sampled set is [2, 4, 5]. In this case, the document returned
would be [5].
This type of sampling provides almost linear improvement in query latency in relation to the amount by which sampling reduces the document set size:
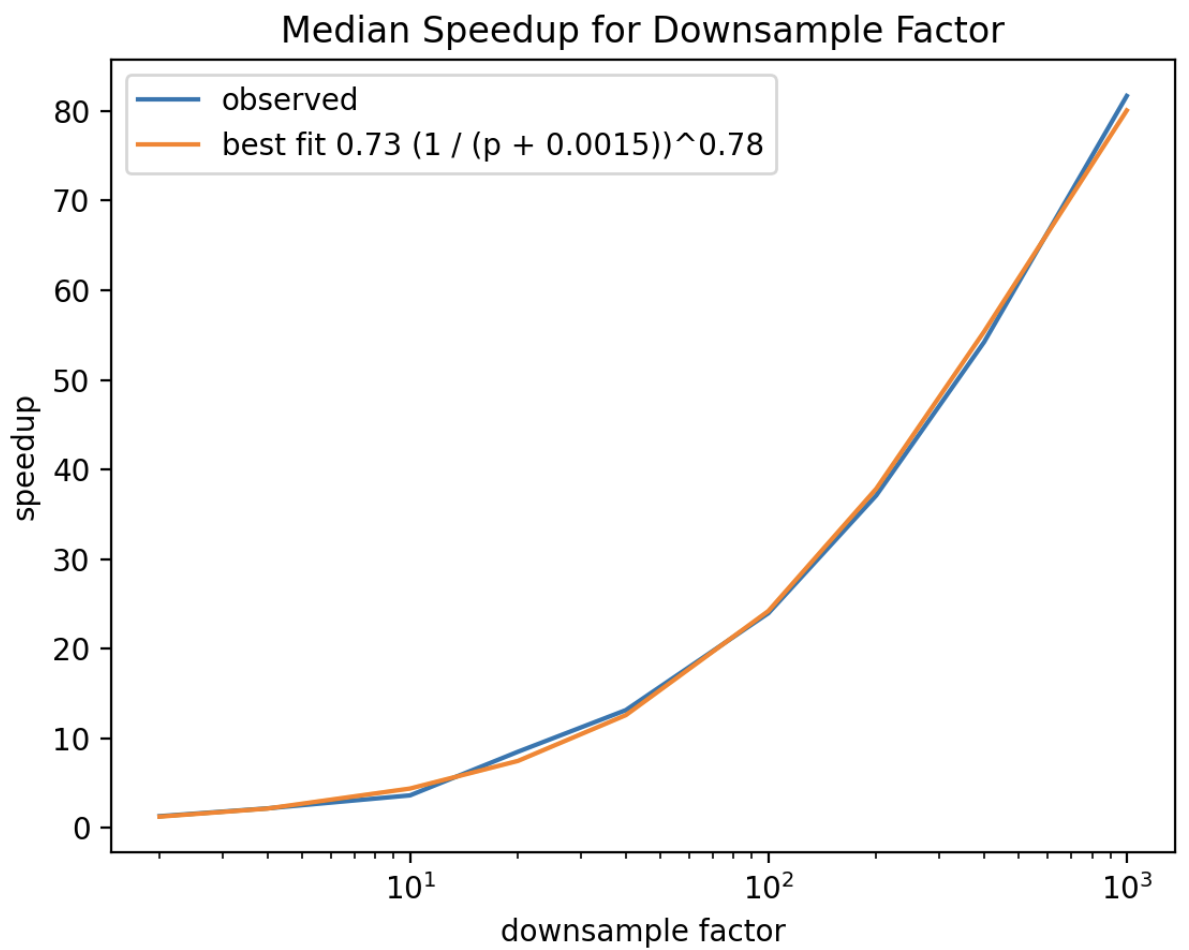
This graph is typical of the speed up for the majority of aggregations for a test data set of 63 million documents. The exact constants will depend on the data set size and the number of shards, but the form of the relationship between speed up and probability holds widely. For certain aggregations, the speed up may not be as dramatic. These aggregations have some constant overhead unrelated to the number of documents seen. Even for those aggregations, the speed improvements can be significant.
The sample set is generated by skipping documents using a geometric distribution
((1-p)^(k-1)*p) with success probability being the provided probability (p in the distribution equation).
The values returned from the distribution indicate how many documents to skip in
the background. This is equivalent to selecting documents uniformly at random. It follows that the expected number of failures before a success is
(1-p)/p. For example, with the "probability": 0.01, the expected number of failures (or
average number of documents skipped) would be 99 with a variance of 9900.
Consequently, if you had only 80 documents in your index or matched by your
filter, you would most likely receive no results.

In the above image p is the probability provided to the aggregation, and n is the number of documents matched by whatever
query is provided. You can see the impact of outliers on sum and mean, but when many documents are still matched at
higher sampling rates, the relative error is still low.
This represents the result of aggregations against a typical positively skewed APM data set which also has outliers in the upper tail. The linear dependence of the relative error on the sample size is found to hold widely, but the slope depends on the variation in the quantity being aggregated. As such, the variance in your own data may cause relative error rates to increase or decrease at a different rate.