WARNING: The 1.x versions of Elasticsearch have passed their EOL dates. If you are running a 1.x version, we strongly advise you to upgrade.
This documentation is no longer maintained and may be removed. For the latest information, see the current Elasticsearch documentation.
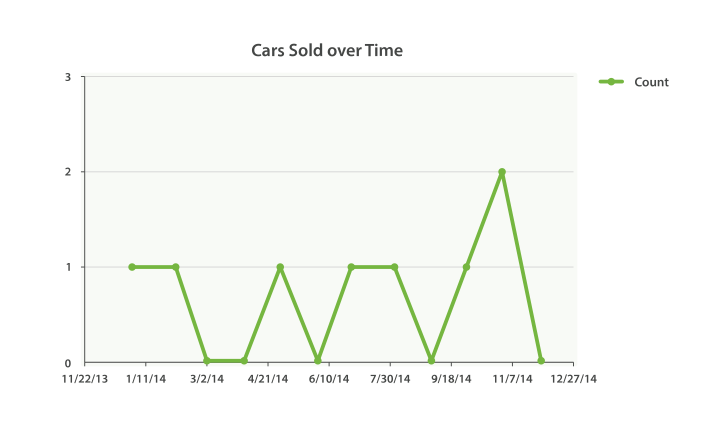
Returning Empty Bucketsedit
Notice something odd about that last response?
Yep, that’s right. We are missing a few months! By default, the date_histogram
(and histogram too) returns only buckets that have a nonzero
document count.
This means your histogram will be a minimal response. Often, this is not the behavior you want. For many applications, you would like to dump the response directly into a graphing library without doing any post-processing.
Essentially, we want buckets even if they have a count of zero. We can set two additional parameters that will provide this behavior:
GET /cars/transactions/_search?search_type=count
{
   "aggs": {
      "sales": {
         "date_histogram": {
            "field": "sold",
            "interval": "month",
            "format": "yyyy-MM-dd",
            "min_doc_count" : 0,
            "extended_bounds" : {
                "min" : "2014-01-01",
                "max" : "2014-12-31"
            }
         }
      }
   }
}
|
This parameter forces empty buckets to be returned. |
|
|
This parameter forces the entire year to be returned. |
The two additional parameters will force the response to return all months in the
year, regardless of their doc count. The min_doc_count is very understandable:
it forces buckets to be returned even if they are empty.
The extended_bounds parameter requires a little explanation. The min_doc_count
parameter forces empty buckets to be returned, but by default Elasticsearch will return only buckets that are between the minimum and maximum value in your data.
So if your data falls between April and July, you’ll have buckets representing only those months (empty or otherwise). To get the full year, we need to tell Elasticsearch that we want buckets even if they fall before the minimum value or after the maximum value.
The extended_bounds parameter does just that. Once you add those two settings,
you’ll get a response that is easy to plug straight into your graphing libraries
and give you a graph like Figure 37, “Cars sold over time”.