Overviewedit
Elastic APM is an application performance monitoring system built on the Elastic Stack. It allows you to monitor software services and applications in real time, collecting detailed performance information on response time for incoming requests, database queries, calls to caches, external HTTP requests, etc. This makes it easier to pinpoint and fix performance problems quickly.
Elastic APM also automatically collects unhandled errors and exceptions. Errors are grouped based primarily on the stacktrace, so you can identify new errors as they appear and keep an eye on how many times specific errors happen.
This guide will indiscriminately use the word "service" for both services and applications.
APM Componentsedit
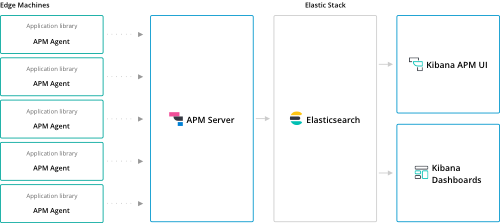
Elastic APM consists of four components:
APM agents are open source libraries written in the same language as your service. You install them into your service as you would install any other library. They instrument your code and collect performance data and errors at runtime. This data is buffered for a short period and sent on to APM Server.
APM Server is an open source application written in Go which typically runs on dedicated servers. It listens on port 8200 by default and receives data from agents through a JSON HTTP API. Then it creates documents from that data and stores them in Elasticsearch.
Elasticsearch is a highly scalable open-source full-text search and analytics engine. It allows you to store, search, and analyze big volumes of data quickly and in near real time. Elasticsearch is used to store APM performance metrics and make use of its aggregations.
Kibana is an open source analytics and visualization platform designed to work with Elasticsearch. You use Kibana to search, view, and interact with data stored in Elasticsearch. You can use Kibana to visualize APM data by utilizing the dedicated APM UI bundled in Basic license, or the pre-built, open source, Kibana dashboards that can be loaded directly via the APM Kibana UI.
APM Conceptsedit
Eventsedit
APM agents capture different types of information from within their instrumented applications, known as events.
Events can be Errors, Spans, or Transactions.
These events are then streamed to the APM Server which validates and processes the events.
View the APM data model for more information on events.
Component communicationedit
The APM Server is a separate component by design - it helps keep the agents light, prevents certain security risks, and improves compatibility across the Elastic and APM Stack.
The Intake API is what we call the internal protocol that APM agents use to talk to the APM Server. After the APM Server has validated and processed events from the APM agents (via the intake API), the server transforms the data into Elasticsearch documents and stores them in corresponding Elasticsearch indices. In a matter of seconds you can start viewing your application performance data in Kibana.
Real User Monitoring (RUM)edit
Real User Monitoring captures user interaction with clients such as web browsers. The JavaScript Agent is Elastic’s RUM Agent. To use it you need to enable RUM support in the APM Server.
Unlike Elastic APM backend agents which monitor requests and responses, the RUM JavaScript agent monitors the real user experience and interaction within your client-side application. The RUM JavaScript agent is also framework-agnostic, which means it can be used with any frontend JavaScript application.
You will be able to measure metrics such as "Time to First Byte", domInteractive,
and domComplete which helps you discover performance issues within your client-side application as well as issues that relate to the latency of your server-side application.
Distributed Tracingedit
Together, transactions and spans form a Trace.
Traces are not events, but group together events that have a common root.
All of our APM agents support distributed tracing out of the box. Distributed tracing enables you to analyze performance throughout your microservices architecture all in one view.