Monitoring AWS Lambda Node.js Functions
editMonitoring AWS Lambda Node.js Functions
editThe Node.js APM Agent can be used with AWS Lambda to monitor the execution of your AWS Lambda functions.
Quick Start
editTo get started with APM for your Node.js AWS Lambda functions follow the steps below.
Prerequisites
editYou need an APM Server to send APM data to. Follow the APM Quick start if you have not set one up yet. For the best-possible performance, we recommend setting up APM on Elastic Cloud in the same AWS region as your AWS Lambda functions.
Step 1: Select the AWS Region and Architecture
editPick the right ARN from this release table for the APM Lambda Extension Layer.
In addition, pick the right ARN from this release table for the APM Agent Layer.
The selected AWS region and the architecture must match the AWS region and architecture of your AWS Lambda function!
Step 2: Add the APM Layers to your Lambda function
editBoth the Elastic APM AWS Lambda extension and the Node.js APM Agent are added to your Lambda function as AWS Lambda Layers. Therefore, you need to add the corresponding Layer ARNs (identifiers) to your Lambda function.
To add the layers to your Lambda function through the AWS Management Console:
- Navigate to your function in the AWS Management Console
-
Scroll to the Layers section and click the Add a layer button
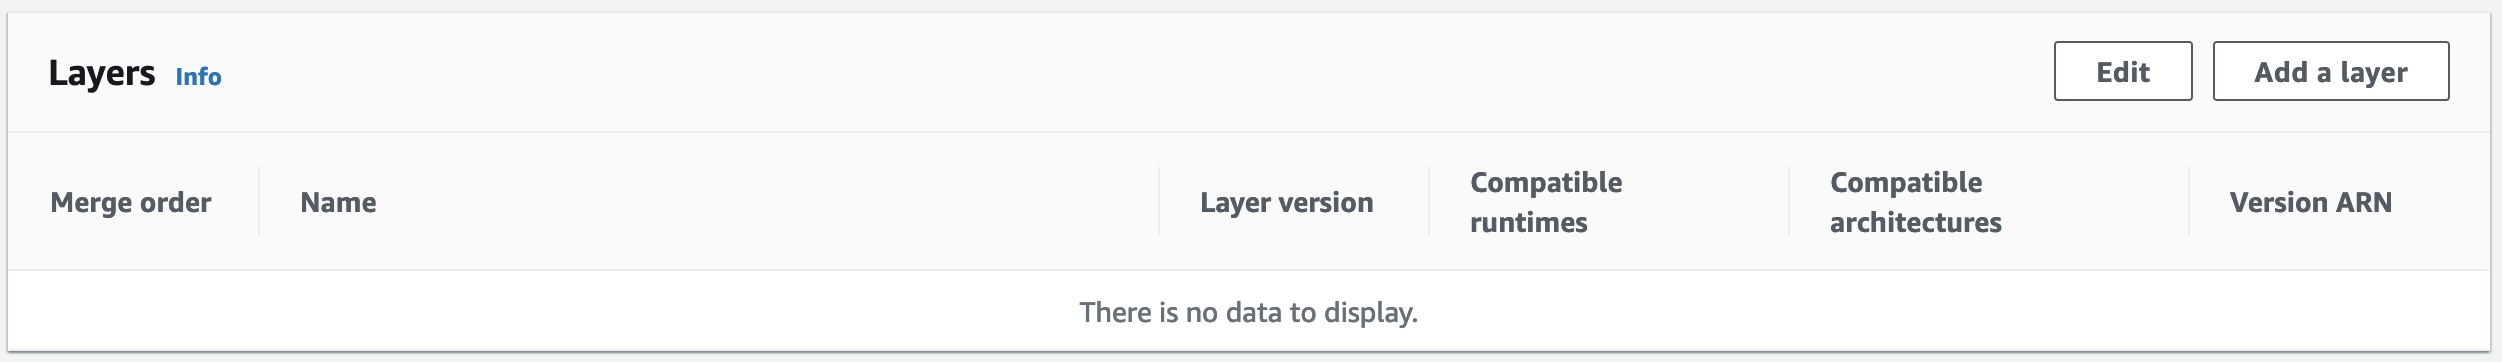
- Choose the Specify an ARN radio button
-
Copy and paste the following ARNs of the Elastic APM AWS Lambda extension layer and the APM agent layer in the Specify an ARN text input:
APM Extension layer:
EXTENSION_ARN
APM agent layer:
AGENT_ARN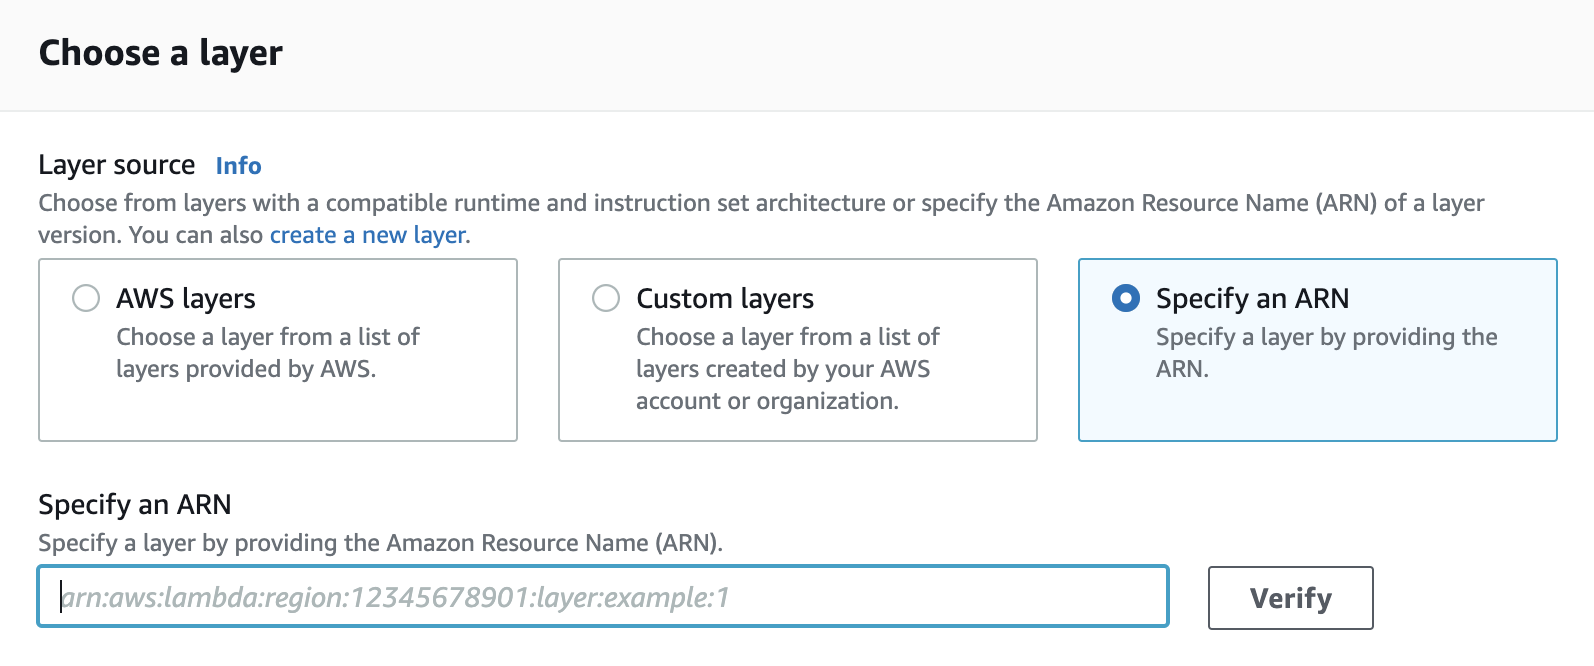
- Click the Add button
To add the Layer ARNs of the Elastic APM AWS Lambda extension and the APM agent through the AWS command line interface execute the following command:
aws lambda update-function-configuration --function-name yourLambdaFunctionName \
--layers EXTENSION_ARN \
AGENT_ARN
In your SAM template.yml file add the Layer ARNs of the Elastic APM AWS Lambda extension and the APM agent as follows:
...
Resources:
  yourLambdaFunction:
    Type: AWS::Serverless::Function
    Properties:
      ...
      Layers:
          - EXTENSION_ARN
          - AGENT_ARN
...
In your serverless.yml file add the Layer ARNs of the Elastic APM AWS Lambda extension and the APM agent to your function as follows:
...
functions:
  yourLambdaFunction:
    handler: ...
    layers:
      - EXTENSION_ARN
      - AGENT_ARN
...
To add theElastic APM AWS Lambda extension and the APM agent to your function add the ARNs to the layers property in your Terraform file:
...
resource "aws_lambda_function" "your_lambda_function" {
  ...
  layers = ["EXTENSION_ARN", "AGENT_ARN"]
}
...
To add the Elastic APM AWS Lambda extension and the APM agent to your container-based function extend the Dockerfile of your function image as follows:
FROM docker.elastic.co/observability/apm-lambda-extension-IMAGE_ARCH:latest AS lambda-extension
AGENT_IMPORT

# FROM ...  <-- this is the base image of your Lambda function

COPY --from=lambda-extension /opt/elastic-apm-extension /opt/extensions/elastic-apm-extension
AGENT_COPY

# ...
Step 3: Configure APM on AWS Lambda
editThe Elastic APM AWS Lambda extension and the APM Node.js agent are configured through environment variables on the AWS Lambda function.
For the minimal configuration, you will need the APM Server URL to set the destination for APM data and an APM Secret Token.
If you prefer to use an APM API key instead of the APM secret token, use the ELASTIC_APM_API_KEY environment variable instead of ELASTIC_APM_SECRET_TOKEN in the following configuration.
For production environments, we recommend using the AWS Secrets Manager to store your APM authentication key instead of providing the secret value as plaintext in the environment variables.
To configure APM through the AWS Management Console:
- Navigate to your function in the AWS Management Console
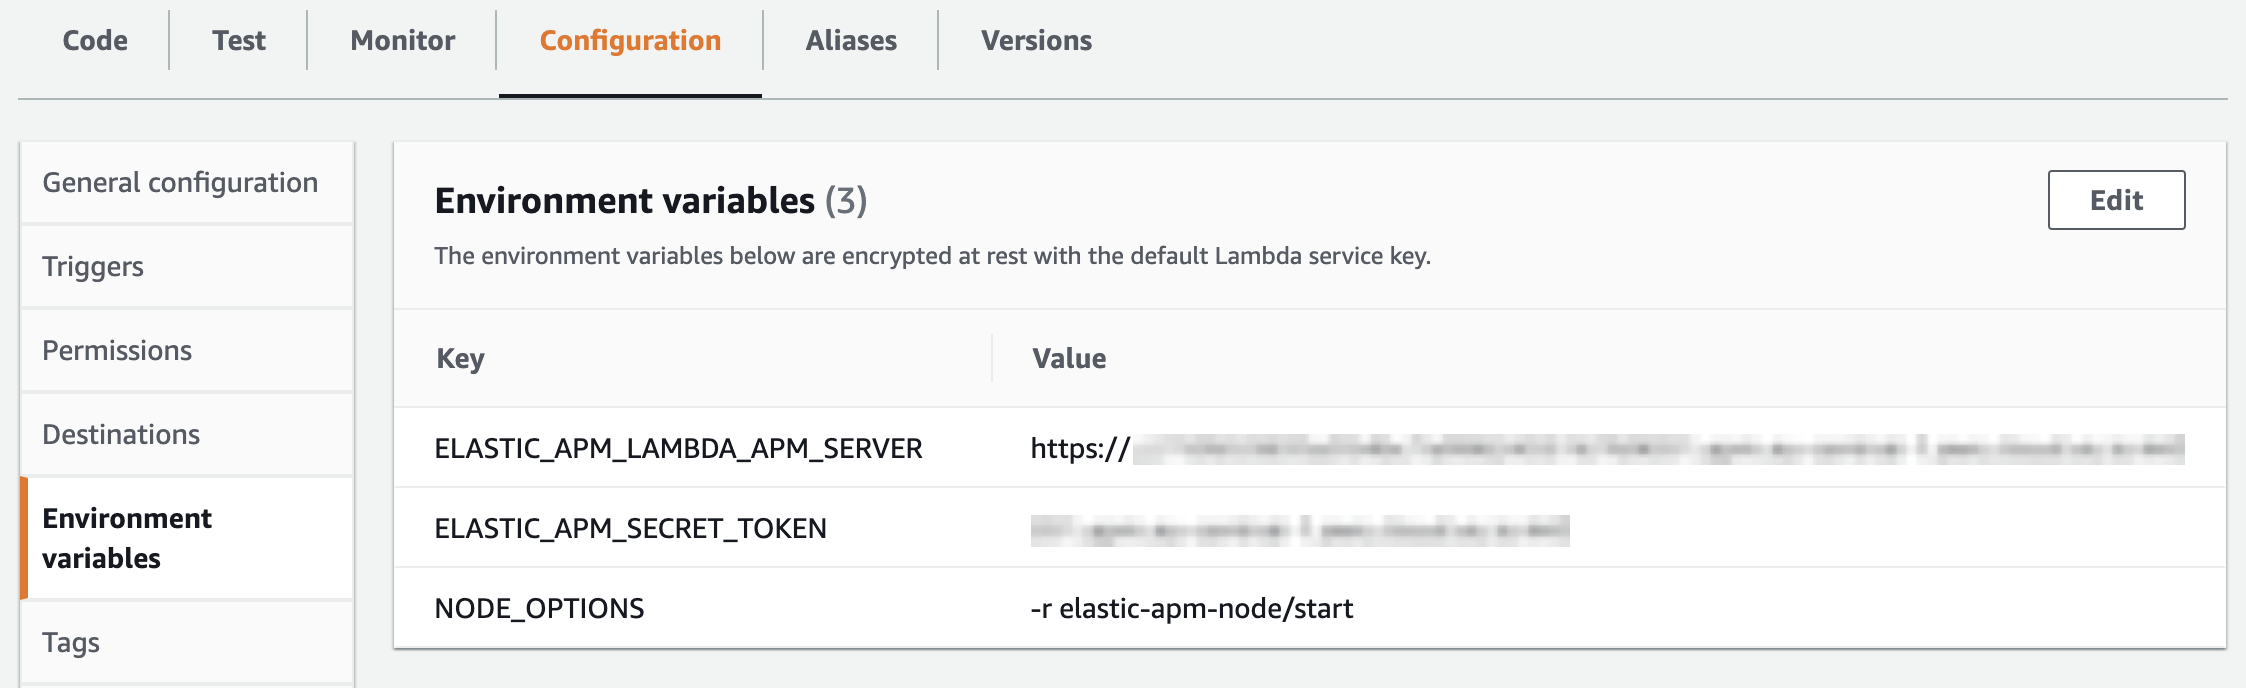
- Click on the Configuration tab
- Click on Environment variables
- Add the following required variables:
NODE_OPTIONS                  = -r elastic-apm-node/start # use this exact fixed value
ELASTIC_APM_LAMBDA_APM_SERVER = <YOUR-APM-SERVER-URL>     # this is your APM Server URL
ELASTIC_APM_SECRET_TOKEN      = <YOUR-APM-SECRET-TOKEN>   # this is your APM secret token
ELASTIC_APM_SEND_STRATEGY     = background
To configure APM through the AWS command line interface execute the following command:
In your SAM template.yml file configure the following environment variables:
In your serverless.yml file configure the following environment variables:
In your Terraform file configure the following environment variables:
Environment variables configured for an AWS Lambda function are passed to the container running the lambda function. You can use one of the other options (through AWS Web Console, AWS CLI, etc.) to configure the following environment variables:
|
The |
You can optionally fine-tune the Node.js agent or the configuration of the Elastic APM AWS Lambda extension.
That’s it. After following the steps above, you’re ready to go! Your Lambda function invocations should be traced from now on.
Features
editThe AWS Lambda instrumentation will report a transaction for all function invocations and trace any supported modules. In addition, the created transactions will capture additional data for a number of Lambda trigger types — API Gateway, SNS, SQS, S3 (when the trigger is a single event), and ELB.
A transaction will be reported for Lambda invocations that fail due to a
timeout, crash, uncaughtException, or unhandledRejection. (This requires
APM agent v3.45.0 or later and
Elastic’s APM Lambda extension
version 1.4.0 or later.)
Caveats and Troubleshooting
edit- System and custom metrics are not collected for Lambda functions. This is both because most of those are irrelevant and because the interval-based event sending model is not suitable for FaaS environments.
-
Lambda instrumentation does not currently work when the (deprecated)
contextManager: 'patch'configuration setting is used. -
The APM agent does not yet support a Lambda handler module that uses ECMAScript modules (ESM). That means your handler file name should end with ".js" (and not have
"type": "module"in package.json if you have one) or end with ".cjs". A handler file that uses the ".mjs" suffix will not be instrumented by the APM agent.