


Brewing in Beats: New Dashboards for Auditbeat
Welcome to Brewing in Beats! With this weekly series, we're keeping you up to date with what's new in Beats, including the latest commits and releases.
New Auditbeat dashboards
With this PR, Auditbeat gets new configuration samples in the default configuration file and three new dashboards:
- Overview - A general dashboard showing a summary of all events.
- Executions - A dashboard showing process executions (execve and execveat) syscalls.
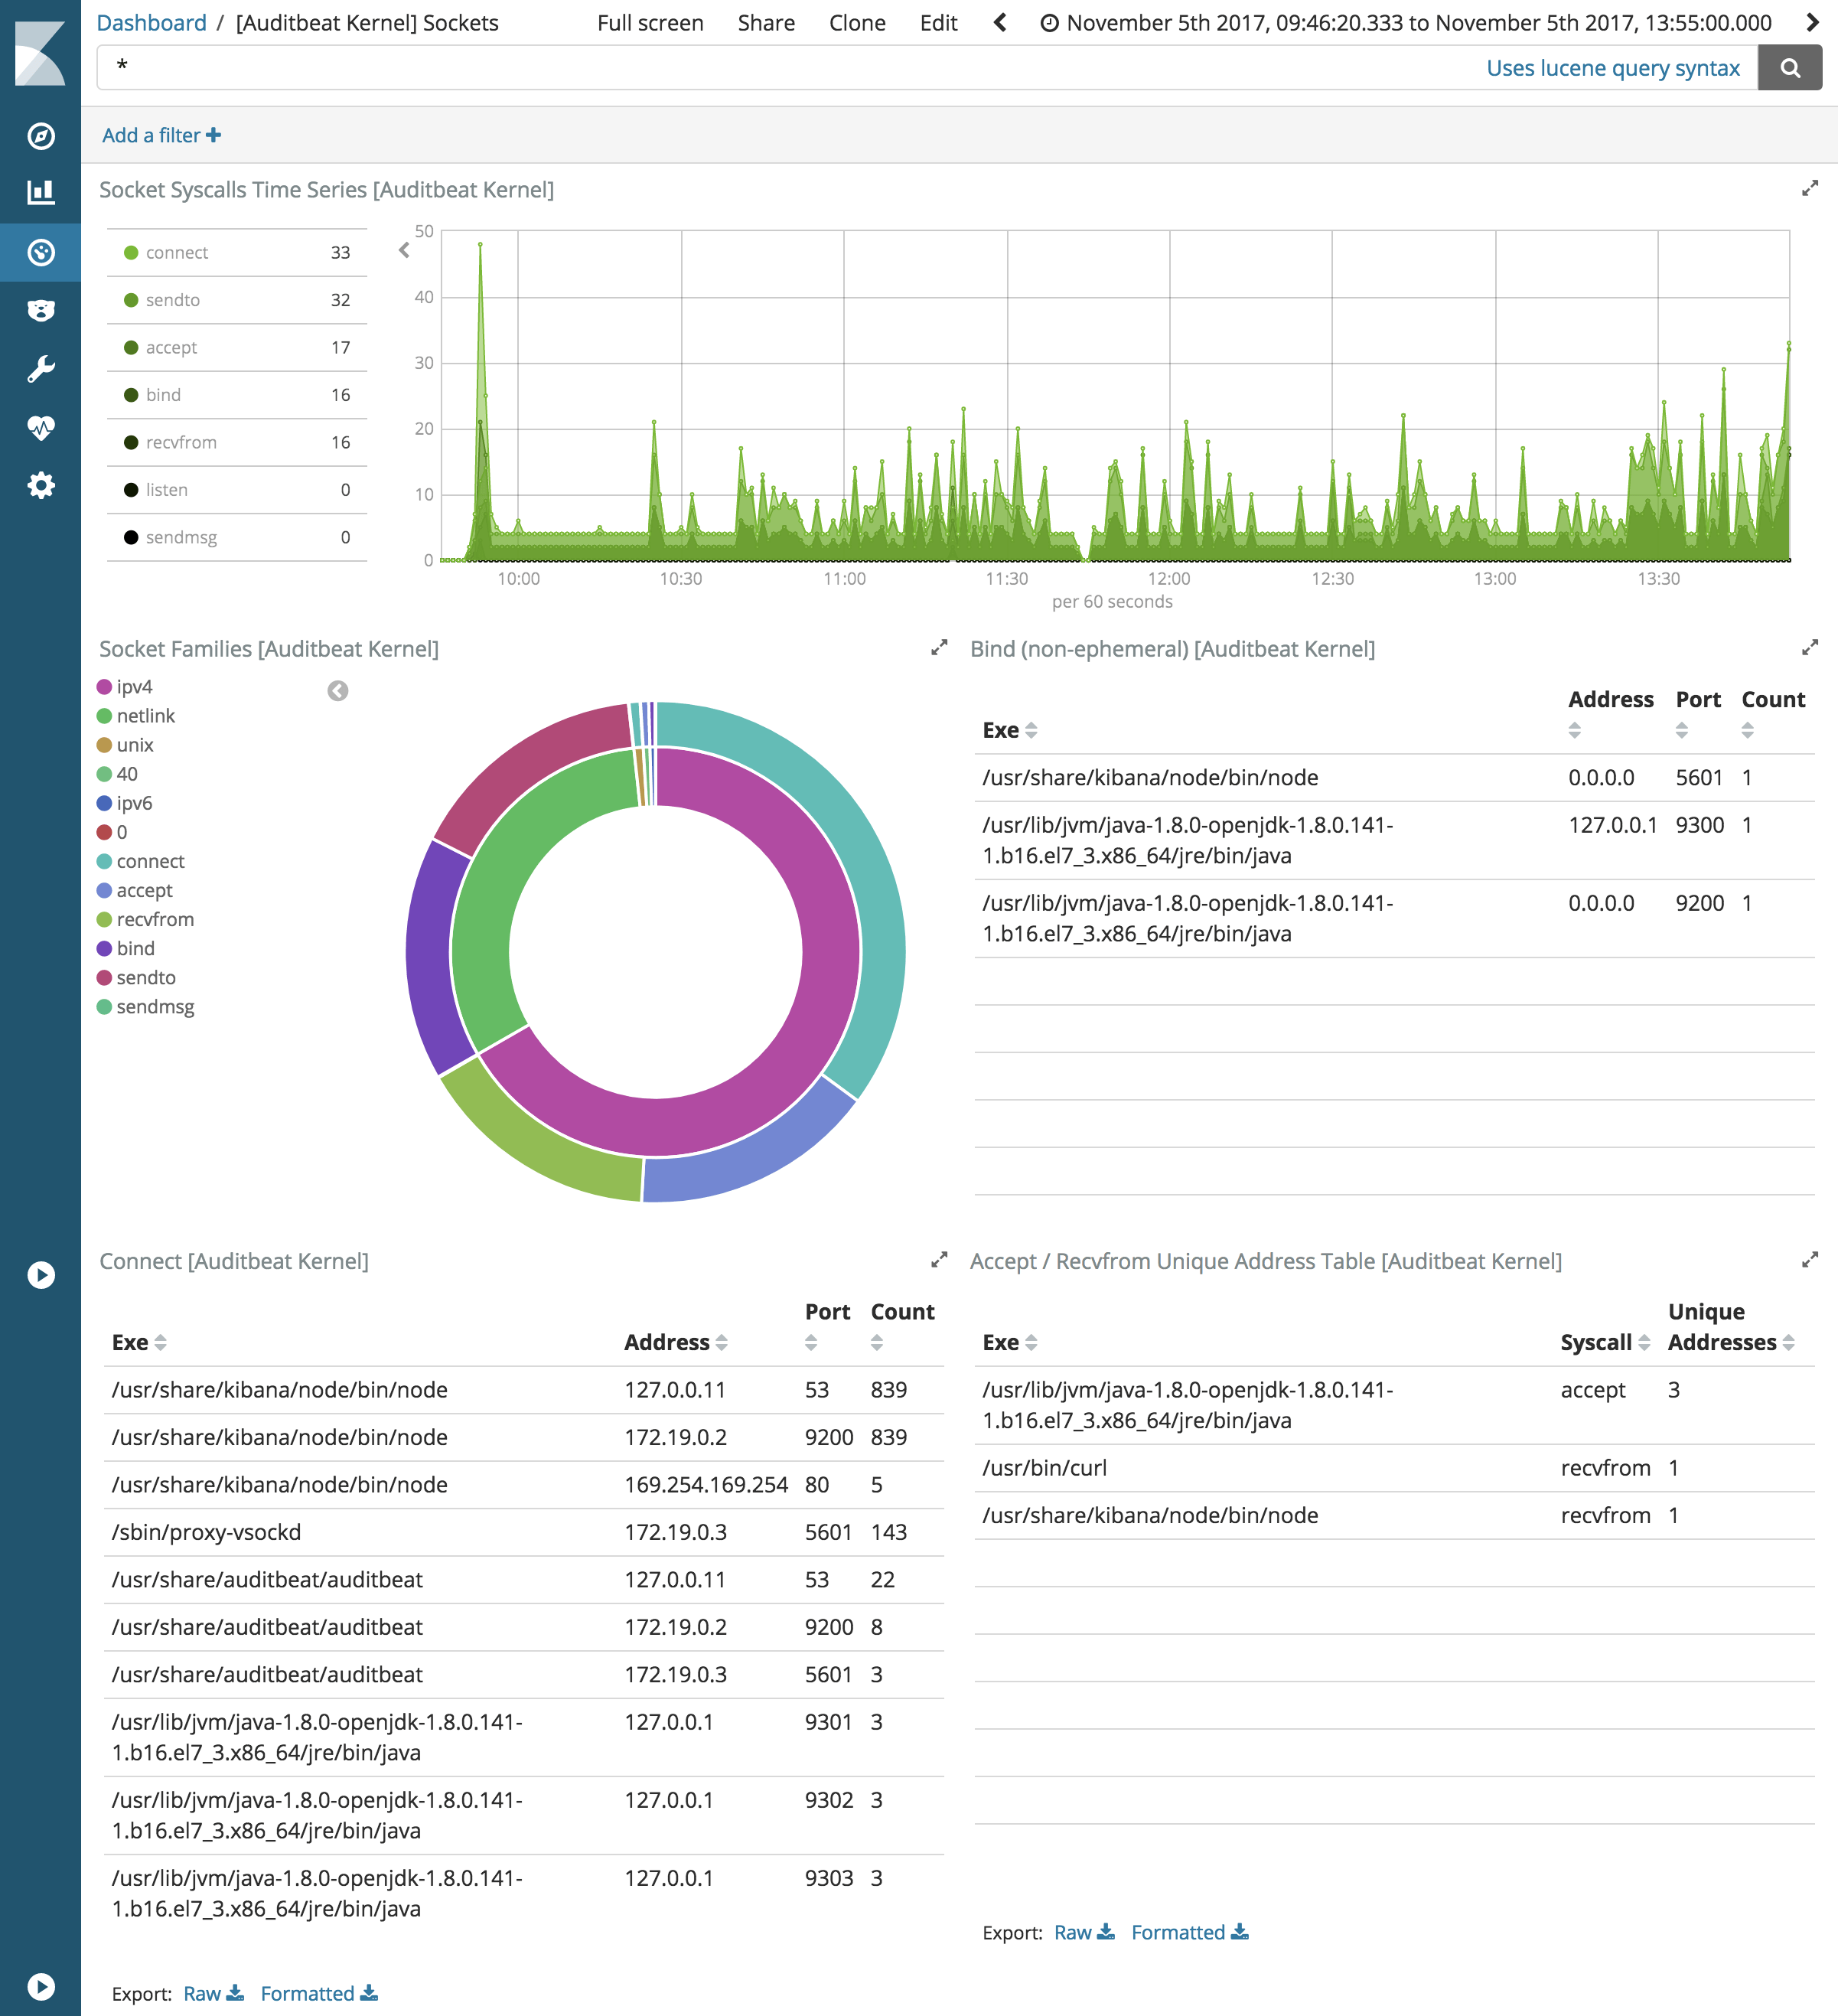
- Sockets - A dashboard showing information related sockets and remote connectivity (e.g. bind, connect, accept, recvfrom).
These new dashboards will be present in Auditbeat 6.1
Windows services metricset
Thanks to our regular contributor @maddin2016, Metricbeat gets a new service metricset in the windows module that collects information about which services are running and data about each of them. Fields are things like “name”, “display_name”, “uptime”, “state”, “start_type”.
This new metricset is scheduled to be released in Metricbeat 6.1.
Other changes
Repository: elastic/beats
Affecting all Beats
Changes in master:
- Fix folder for the 5.x version of the dashboards #5499
- Remove hard-coded namespace from k8s config #5482
Changes in 6.0:
- Log absolute values for gauges internal metrics #5505
Packetbeat
Changes in 6.0:
- Fix missing length check in PgSQL #5457
Filebeat
Changes in master:
Packaging
Changes in master:
- Remove kubernetes manifests from packer #5485
Changes in 6.0:
- Remove kubernetes manifests from packer #5485
Documentation
Changes in master:
- Updated Redis dashboard screenshot for 6.0 #5496
- Add `cloud.id` support to Kubernetes manifests #5487
- Fix getting started #5326
Repository: elastic/kibana
Time series visualizations
Changes in master: