


Using the Elastic APM Java Agent on Kubernetes
Elasticsearch and the rest of the Elastic Stack are commonly used for log and metric aggregation in various environments, including Kubernetes. In addition, the Elastic Stack is frequently being used for uptime tracking, with Heartbeat, as well as Application Performance Monitoring (APM), with agents supporting common programming languages, including Java.
There are multiple ways to set up the Elastic APM Java agent, each is suitable for a different use case. When moving to Kubernetes, the combination of these with the broad range of deployment options can become overwhelming. This post will review some of the possible approaches, explaining where and when each may be appropriate and, of course, offer a concrete setup that separates tracing from the application code.
Hands-on examples
In order to provide a real feel of what that's like, this post runs through a few easy to follow examples. I used Spring’s PetClinic sample app for all examples. In order for you to be able to try out everything discussed here, I published all related code and images. By the end of this post, you should be able to get the PetClinic application deployed on Kubernetes and traced with Elastic APM:
Elastic APM prerequisites
First things first. In order to trace your application with Elastic APM, you need to have the Elastic Stack set up. Aside from being a component of the stack, Elastic APM uses Elasticsearch for storing data and Kibana for visualizing it.
Sounds complicated? It’s not! This can be easily achieved within a few button clicks through the Elasticsearch Service on Elastic Cloud. If you don’t have an account already, start a free, 14-day trial to follow through with the examples below.
Otherwise, if you want to self manage your Elastic Stack, this has recently become incredibly easy to accomplish in Kubernetes thanks to Elastic Cloud on Kubernetes (ECK) and the release of the Elastic Stack operator. You can go through the quickstart guide, or just deploy ECK and reuse my all-in-one deployment sample, which creates a three-node Elasticsearch cluster, Kibana and Elastic APM server. The benefit of using the all-in-one configuration is that it is consistent with the rest of the examples throughout this post.
Notes for configuring Elastic Cloud on Kubernetes
Elasticsearch cluster creation may take a few minutes. Make sure your k8s cluster has enough resources and be patient before proceeding. See Monitor cluster health and creation progress for more on monitoring Elasticsearch cluster health and creation progress.
Follow through step 3 of the Kibana deployment instructions in order to expose and access Kibana in your browser.
If you used the all-in-one deployment, the Kibana service is called kibana-kb-http and the elastic user’s password is stored in the elasticsearch-es-elastic-user secret. You can verify both through kubectl get services and kubectl get secrets.
By default the operator manages a private CA and generates a self-signed certificate used to secure the communication between APM agents and the APM server. You can either use your own certificate or obtain the default in order to enable communication from the agents. See more on that in our documentation. For simplicity, I disabled TLS at the APM server by adding:
tls:
  selfSignedCertificate:
    disabled: true
Reference application deployment
Now that the Elastic Stack is configured, we can start deploying our application. I created a simple PetClinic image, with mostly default configs, based on this Dockerfile and deployed it for sanity check on my k8s cluster using this deployment configuration:
apiVersion: apps/v1
kind: Deployment
metadata:
  name: petclinic
  namespace: default
  labels:
    app: petclinic
    service: petclinic
spec:
  replicas: 1
  selector:
    matchLabels:
      app: petclinic
  template:
    metadata:
      labels:
        app: petclinic
        service: petclinic
    spec:
      dnsPolicy: ClusterFirstWithHostNet
      containers:
      - name: petclinic
        image: eyalkoren/pet-clinic:without-agent
And exposed it through this service configuration:
apiVersion: v1
kind: Service
metadata:
  name: petclinic
  namespace: default
  labels:
    app: petclinic
spec:
  type: NodePort
  ports:
  - protocol: TCP
    port: 8080
    targetPort: 8080
    nodePort: 30001
  selector:
    service: petclinic
The eyalkoren/pet-clinic:without-agent image referred above is publicly available in my dockerhub repository, so you can just apply it as is and try it out. Just don’t forget to forward port 8080 for the petclinic service.
Now let’s go over a couple of options for instrumenting the application.
Self-attaching the agent
In some cases, you may want to install the agent by programmatically attaching it during application startup. For example, when modifying the Java command line options or changing the build process of the docker image are not valid options. In such cases, you can add the apm-agent-attach artifact as a regular maven/gradle dependency to your application, call ElasticApmAttacher.attach() in your application startup code, rebuild the application, rebuild the image and redeploy. However, keep on reading, as there is an alternative approach suggested below that you may find superior.
Installing through the JVM command line
This is currently the most common installation method. It requires having the agent available in the file system on startup and adding the -javaagent argument to the command line.
Modifying the application image
The most obvious way to get it done is to adjust your application image, as demonstrated in this Dockerfile. The deployment configuration would be the same, apart from the environment variables required for the agent setup:
apiVersion: apps/v1
kind: Deployment
metadata:
  name: petclinic
  namespace: default
  labels:
    app: petclinic
    service: petclinic
spec:
  replicas: 1
  selector:
    matchLabels:
      app: petclinic
  template:
    metadata:
      labels:
        app: petclinic
        service: petclinic
    spec:
      dnsPolicy: ClusterFirstWithHostNet
      containers:
      - name: petclinic
    ############### Image with agent and agent config ##################
        image: eyalkoren/pet-clinic:with-agent
        env:
        - name: ELASTIC_APM_SERVER_URL
          value: "http://apm-server-apm-http:8200"
        - name: ELASTIC_APM_SERVICE_NAME
          value: "petclinic"
        - name: ELASTIC_APM_APPLICATION_PACKAGES
          value: "org.springframework.samples.petclinic"
        - name: ELASTIC_APM_ENVIRONMENT
          value: test
        - name: ELASTIC_APM_LOG_LEVEL
          value: DEBUG
        - name: ELASTIC_APM_SECRET_TOKEN
          valueFrom:
            secretKeyRef:
              name: apm-server-apm-token
              key: secret-token
    ####################################################################
Note: The value for the ELASTIC_APM_SECRET_TOKEN environment variable is automatically extracted from the apm-server-apm-token secret, which was created during the APM server setup, so there is no concern for a breach.
As with the example above, the eyalkoren/pet-clinic:with-agent image is publicly available, so all you need to do is apply this configuration, play with the PetClinic app a bit and see your traced data in the APM tab in your Kibana instance.
Install without modifying the application image
Although the method suggested above does the trick, we prefer finding ways that do not require changing our application images or code. Conceptually, separating the application from its monitoring is always a good idea, if possible.
This can be achieved through the usage of an init container, as long as we have a way to make the Java command line pick up our -javaagent configuration. In this example, I used the standard JVMTI JAVA_TOOL_OPTIONS environment variable, which does not have to be explicitly specified, but rather is picked up automatically by the JVM, if set, when it starts. If your JVM does not support this option, use any other environment variable to do the same — either one already defined in your startup script (like JAVA_OPTS in some servlet container scripts) or add a dedicated empty one that will have no effect, unless being set.
Our init container relies on an official Elastic APM Java Agent Docker image containing the latest agent version: docker.elastic.co/observability/apm-agent-java:1.12.0. This is the first version we made publicly available, and we intend to keep publishing them on future agent releases. In case you want to build your own Docker image, see this Dockerfile for reference, where v=LATEST can be replaced with any other version.
Lastly, we need to make sure to configure a shared volume for the pod and copy the agent into it from the init container before our application gets started, and we are ready to go:
apiVersion: apps/v1
kind: Deployment
metadata:
  name: petclinic
  namespace: default
  labels:
    app: petclinic
    service: petclinic
spec:
  replicas: 1
  selector:
    matchLabels:
      app: petclinic
  template:
    metadata:
      labels:
        app: petclinic
        service: petclinic
    spec:
      dnsPolicy: ClusterFirstWithHostNet
      ###################### Shared volume and init container ##########################
      volumes:
      - name: elastic-apm-agent
        emptyDir: {}
      initContainers:
      - name: elastic-java-agent
        image: docker.elastic.co/observability/apm-agent-java:1.12.0
        volumeMounts:
        - mountPath: /elastic/apm/agent
          name: elastic-apm-agent
        command: ['cp', '-v', '/usr/agent/elastic-apm-agent.jar', '/elastic/apm/agent']
      ##################################################################################
      containers:
      - name: petclinic
        image: eyalkoren/pet-clinic:without-agent
      ######################### Volume path and agent config ###########################
        volumeMounts:
        - mountPath: /elastic/apm/agent
          name: elastic-apm-agent
        env:
        - name: ELASTIC_APM_SERVER_URL
          value: "http://apm-server-apm-http:8200"
        - name: ELASTIC_APM_SERVICE_NAME
          value: "petclinic"
        - name: ELASTIC_APM_APPLICATION_PACKAGES
          value: "org.springframework.samples.petclinic"
        - name: ELASTIC_APM_ENVIRONMENT
          value: test
        - name: ELASTIC_APM_LOG_LEVEL
          value: DEBUG
        - name: ELASTIC_APM_SECRET_TOKEN
          valueFrom:
            secretKeyRef:
              name: apm-server-apm-token
              key: secret-token
        - name: JAVA_TOOL_OPTIONS
          value: -javaagent:/elastic/apm/agent/elastic-apm-agent.jar
      ##################################################################################
As you can see, this deployment config is using the exact same eyalkoren/pet-clinic:without-agent image we used originally. In other words, we managed to monitor our Java application with Elastic APM without having to modify our application code, or even its packaging.
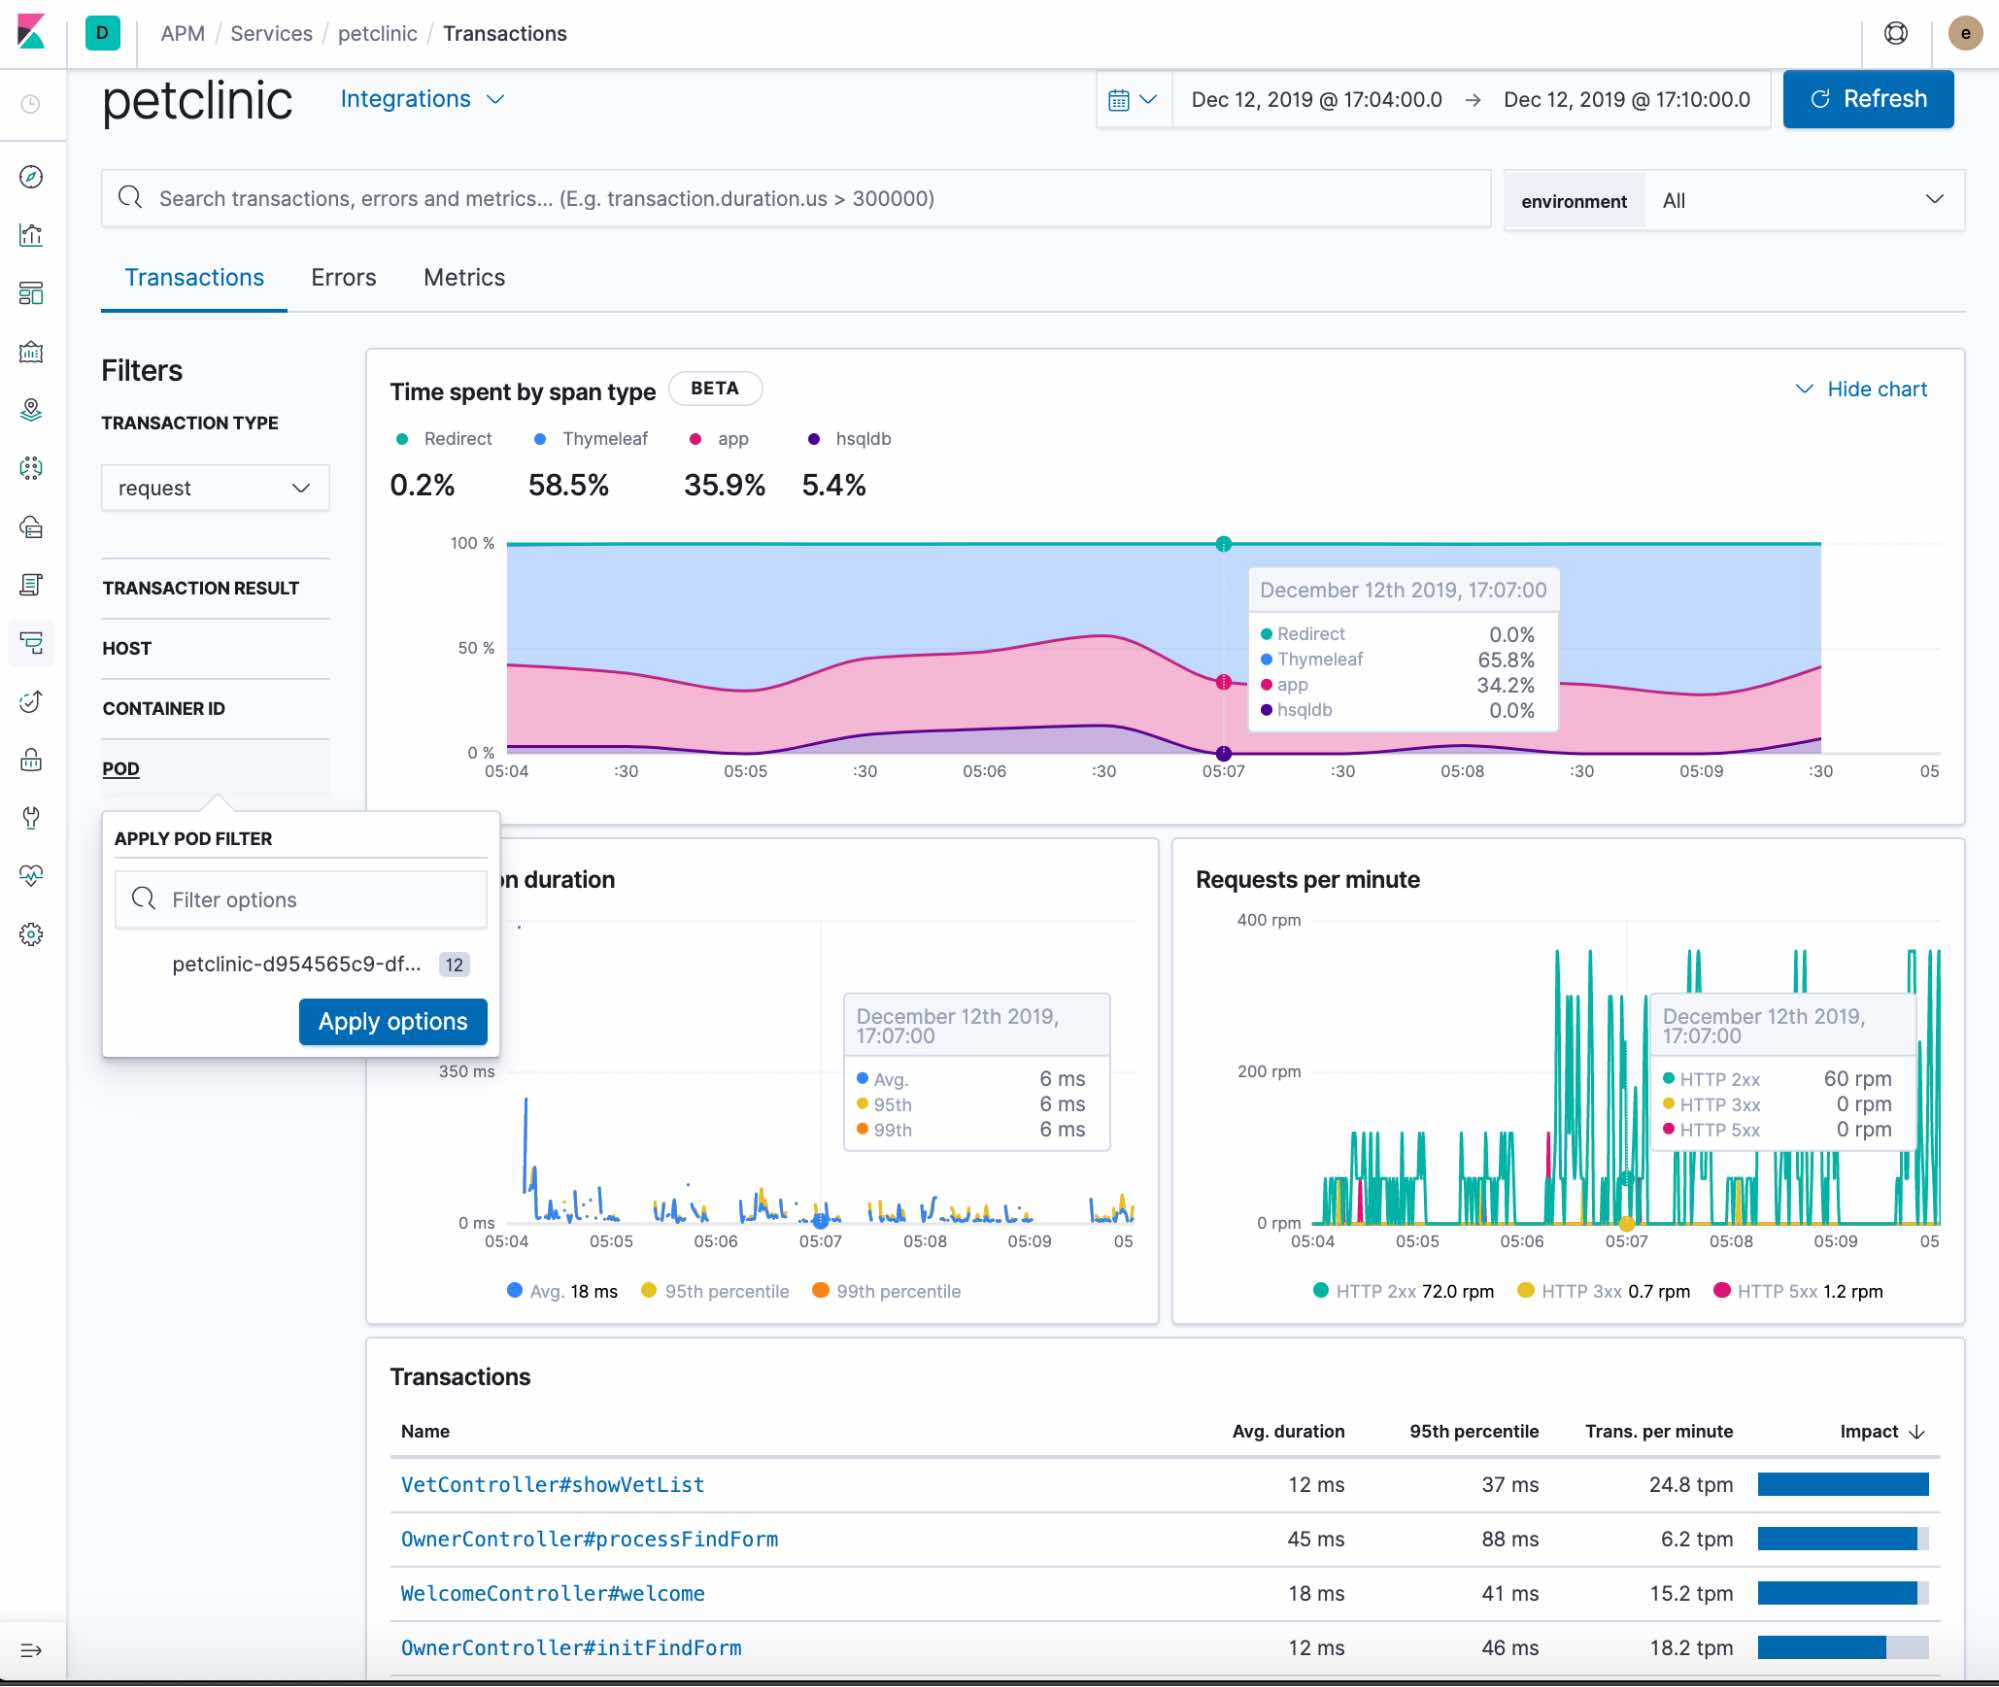
Once this is deployed, you should be able to get all the Elastic APM goodness at hand:
Transaction details
![]()
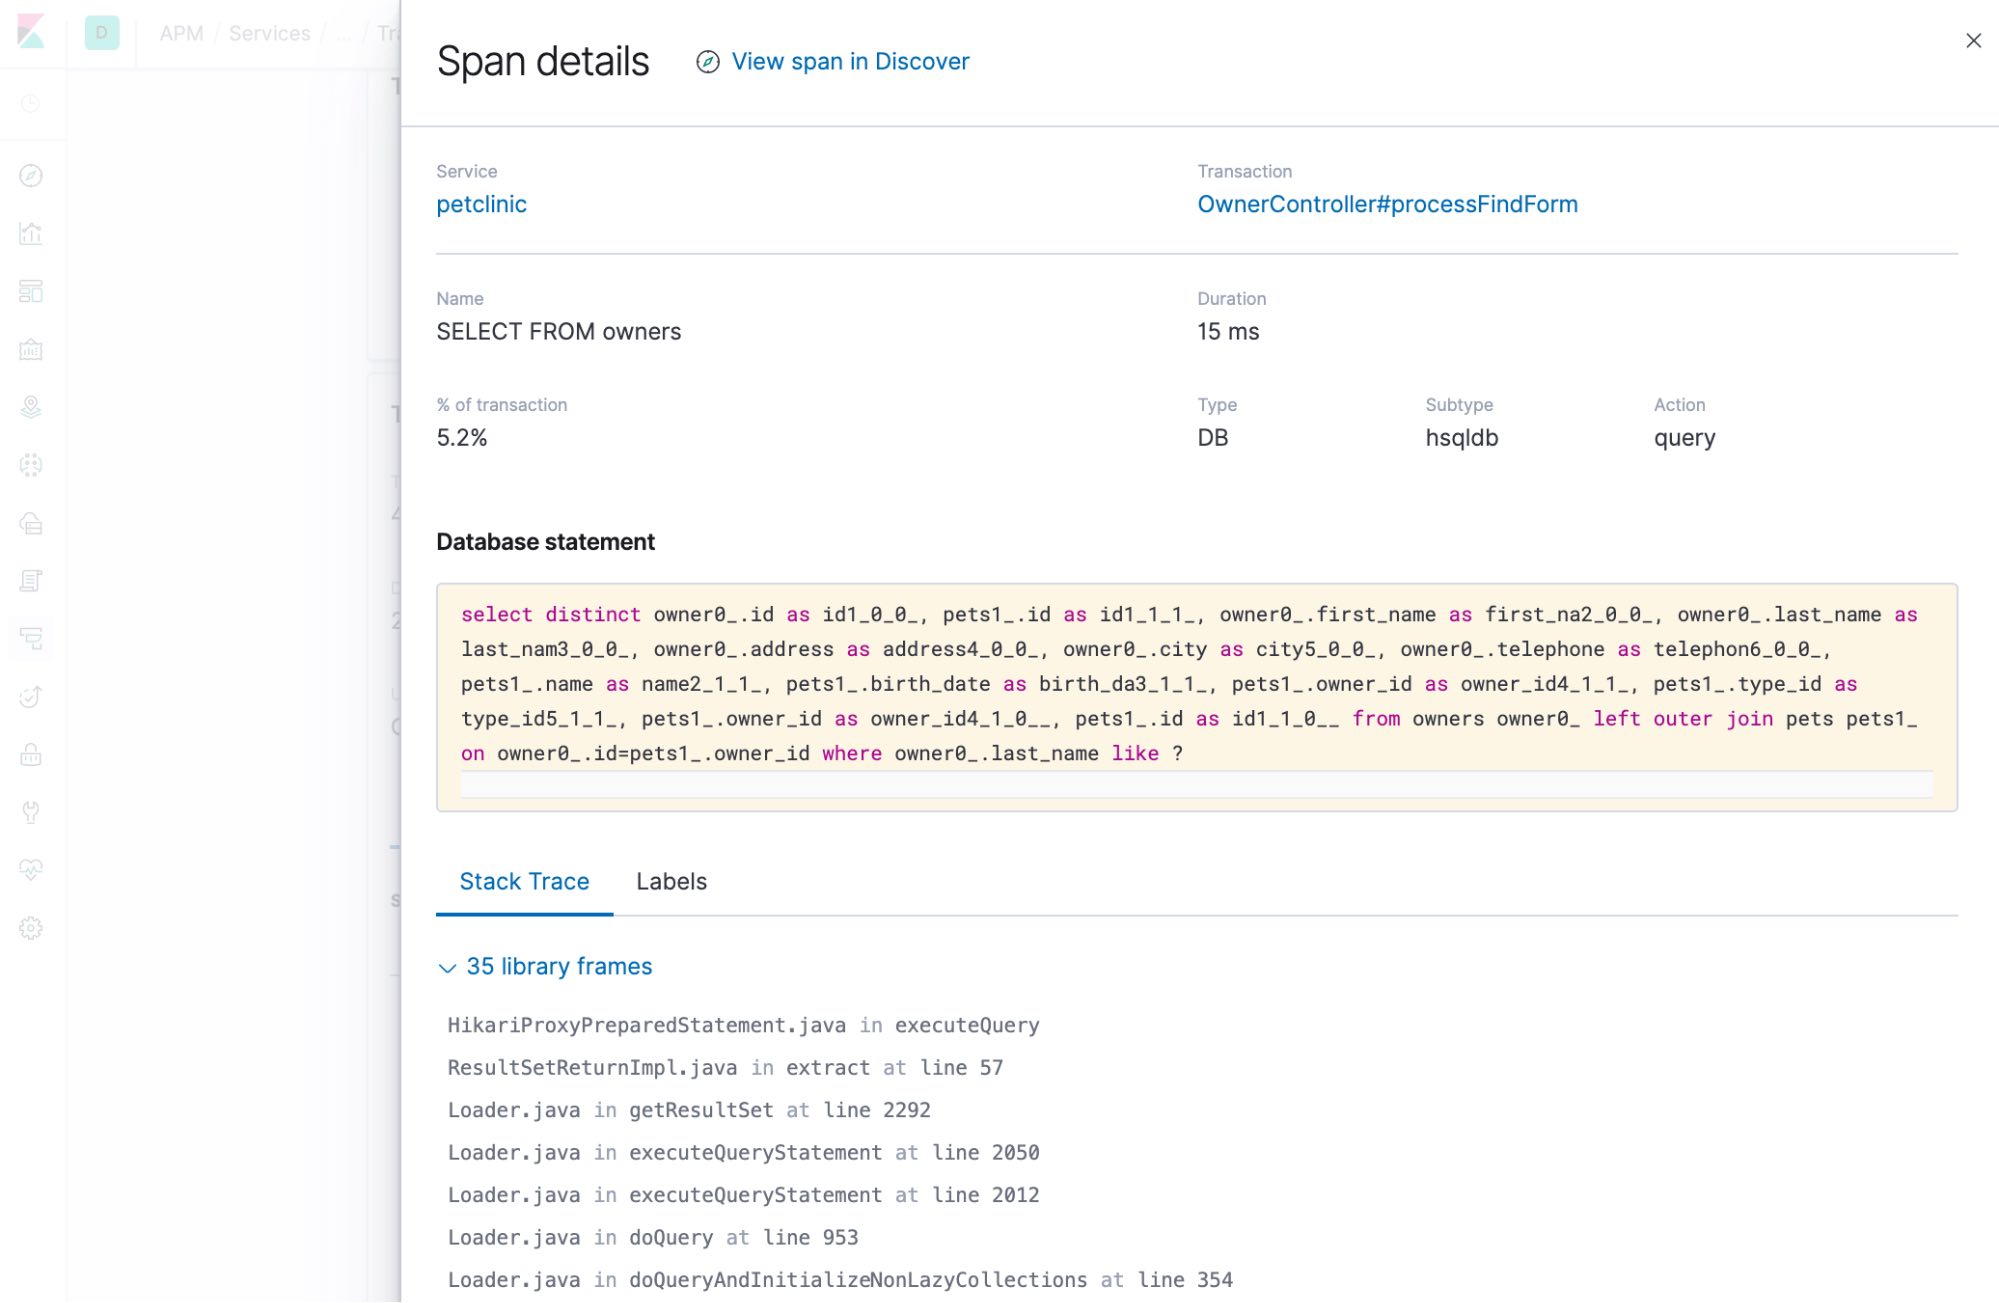
Span details
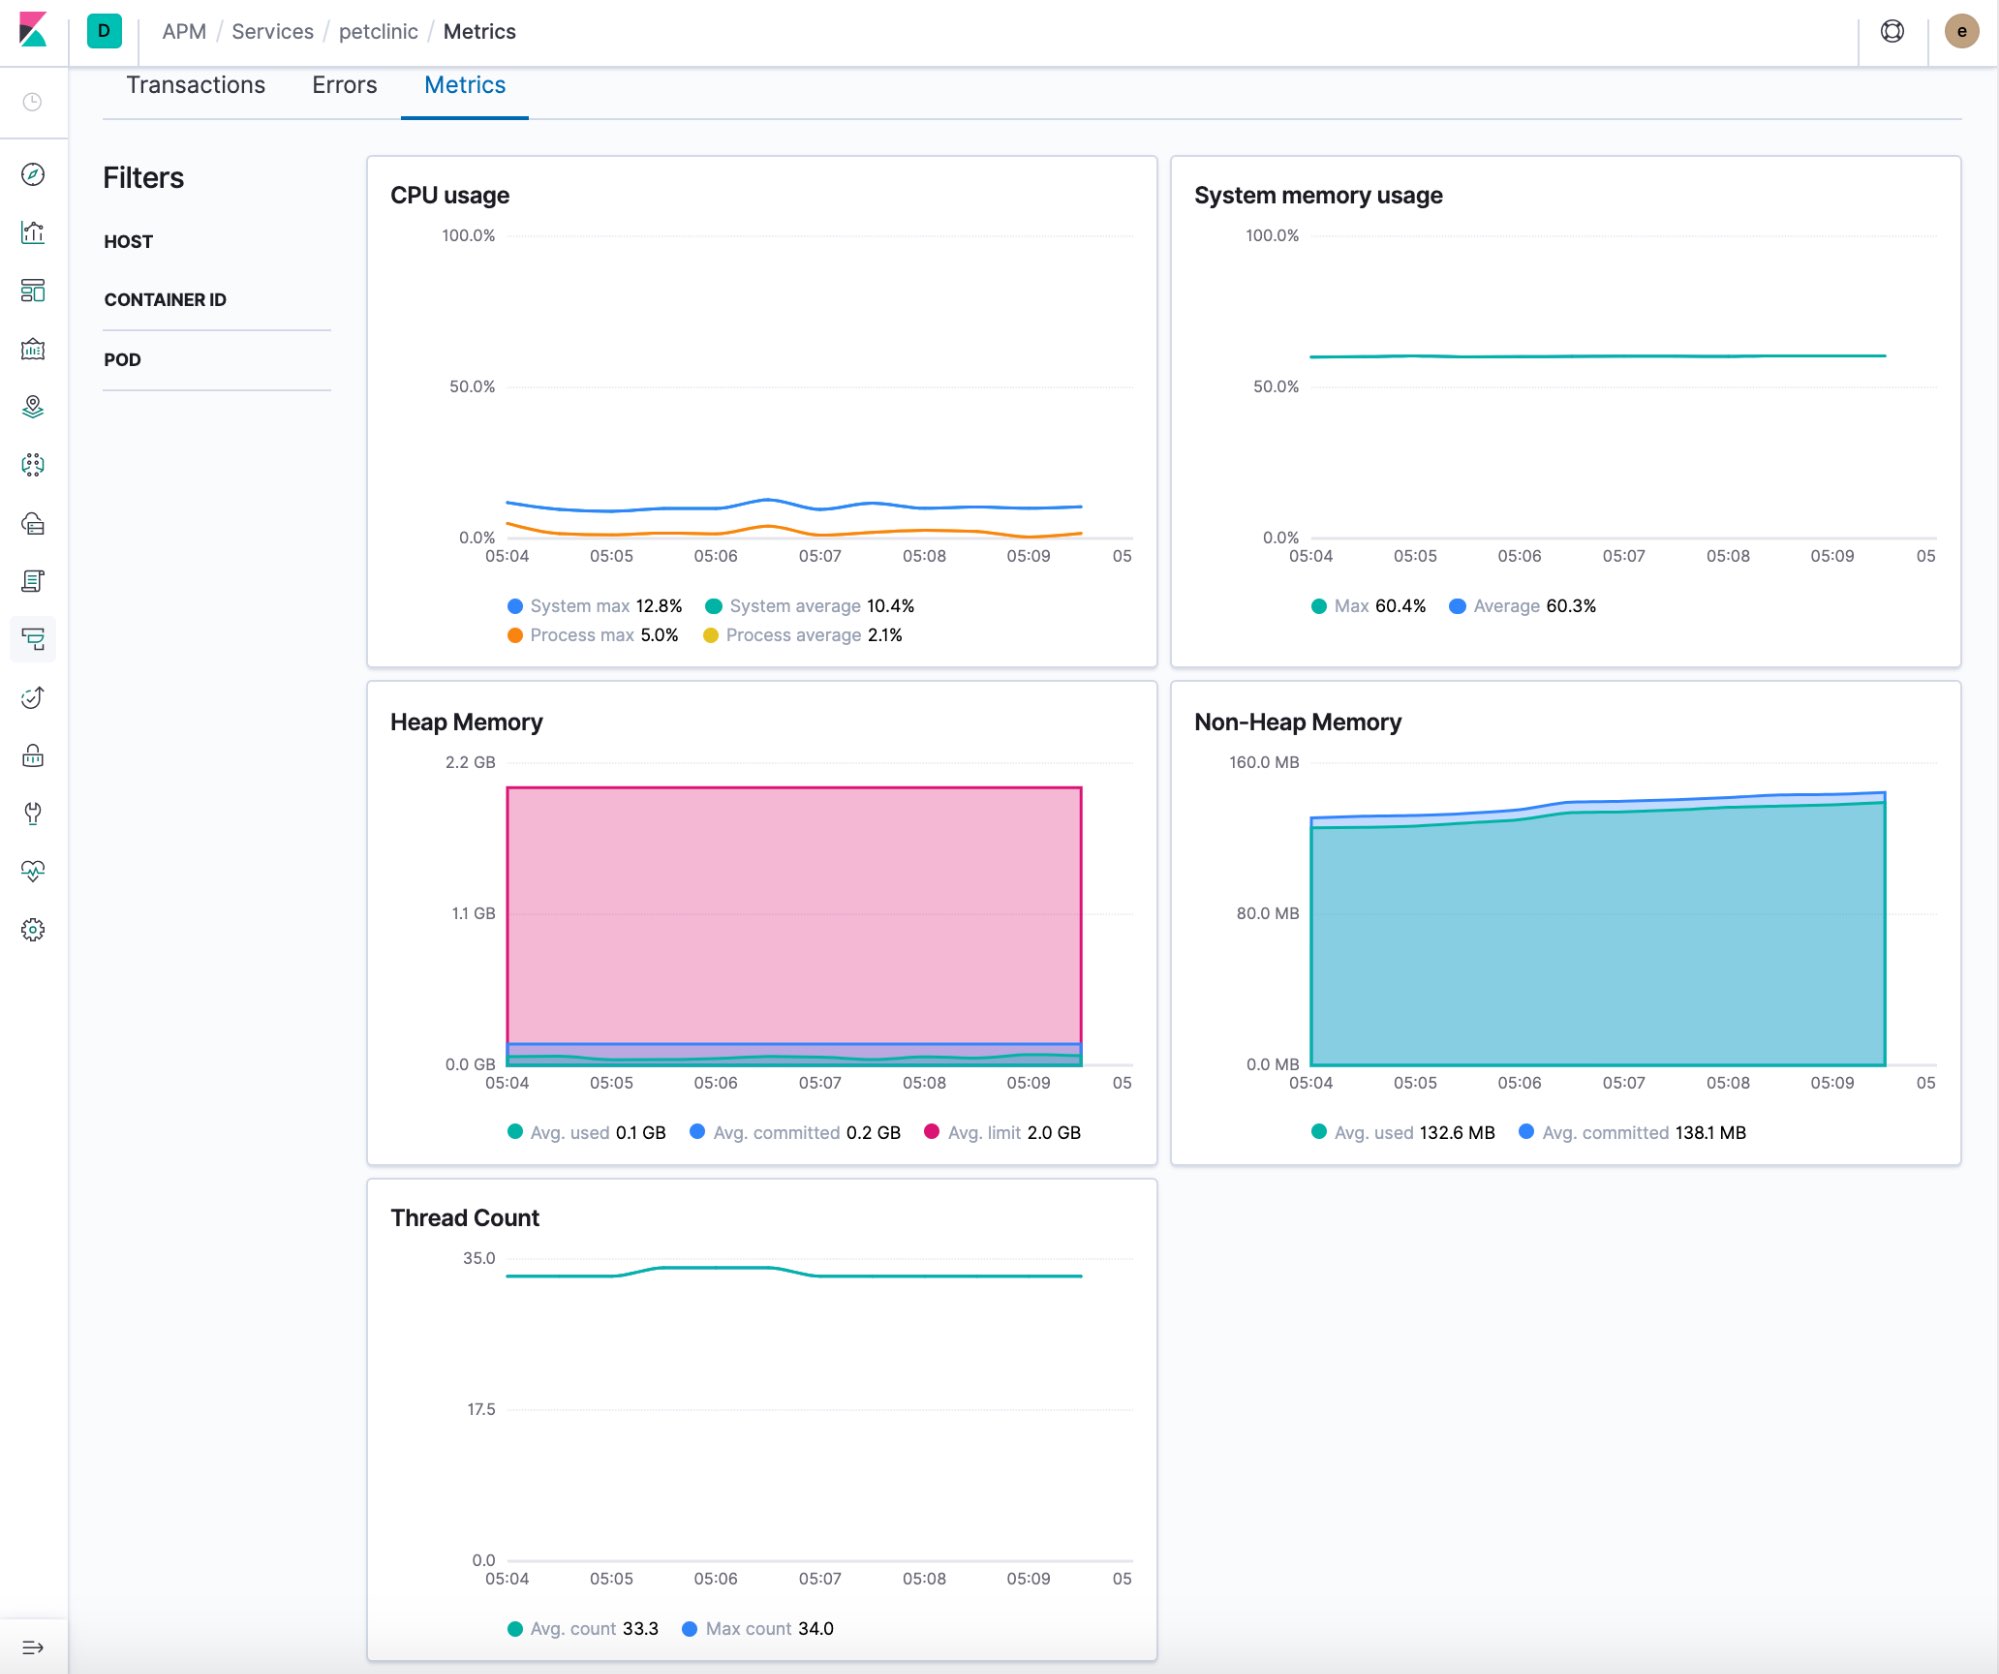
Performance metrics
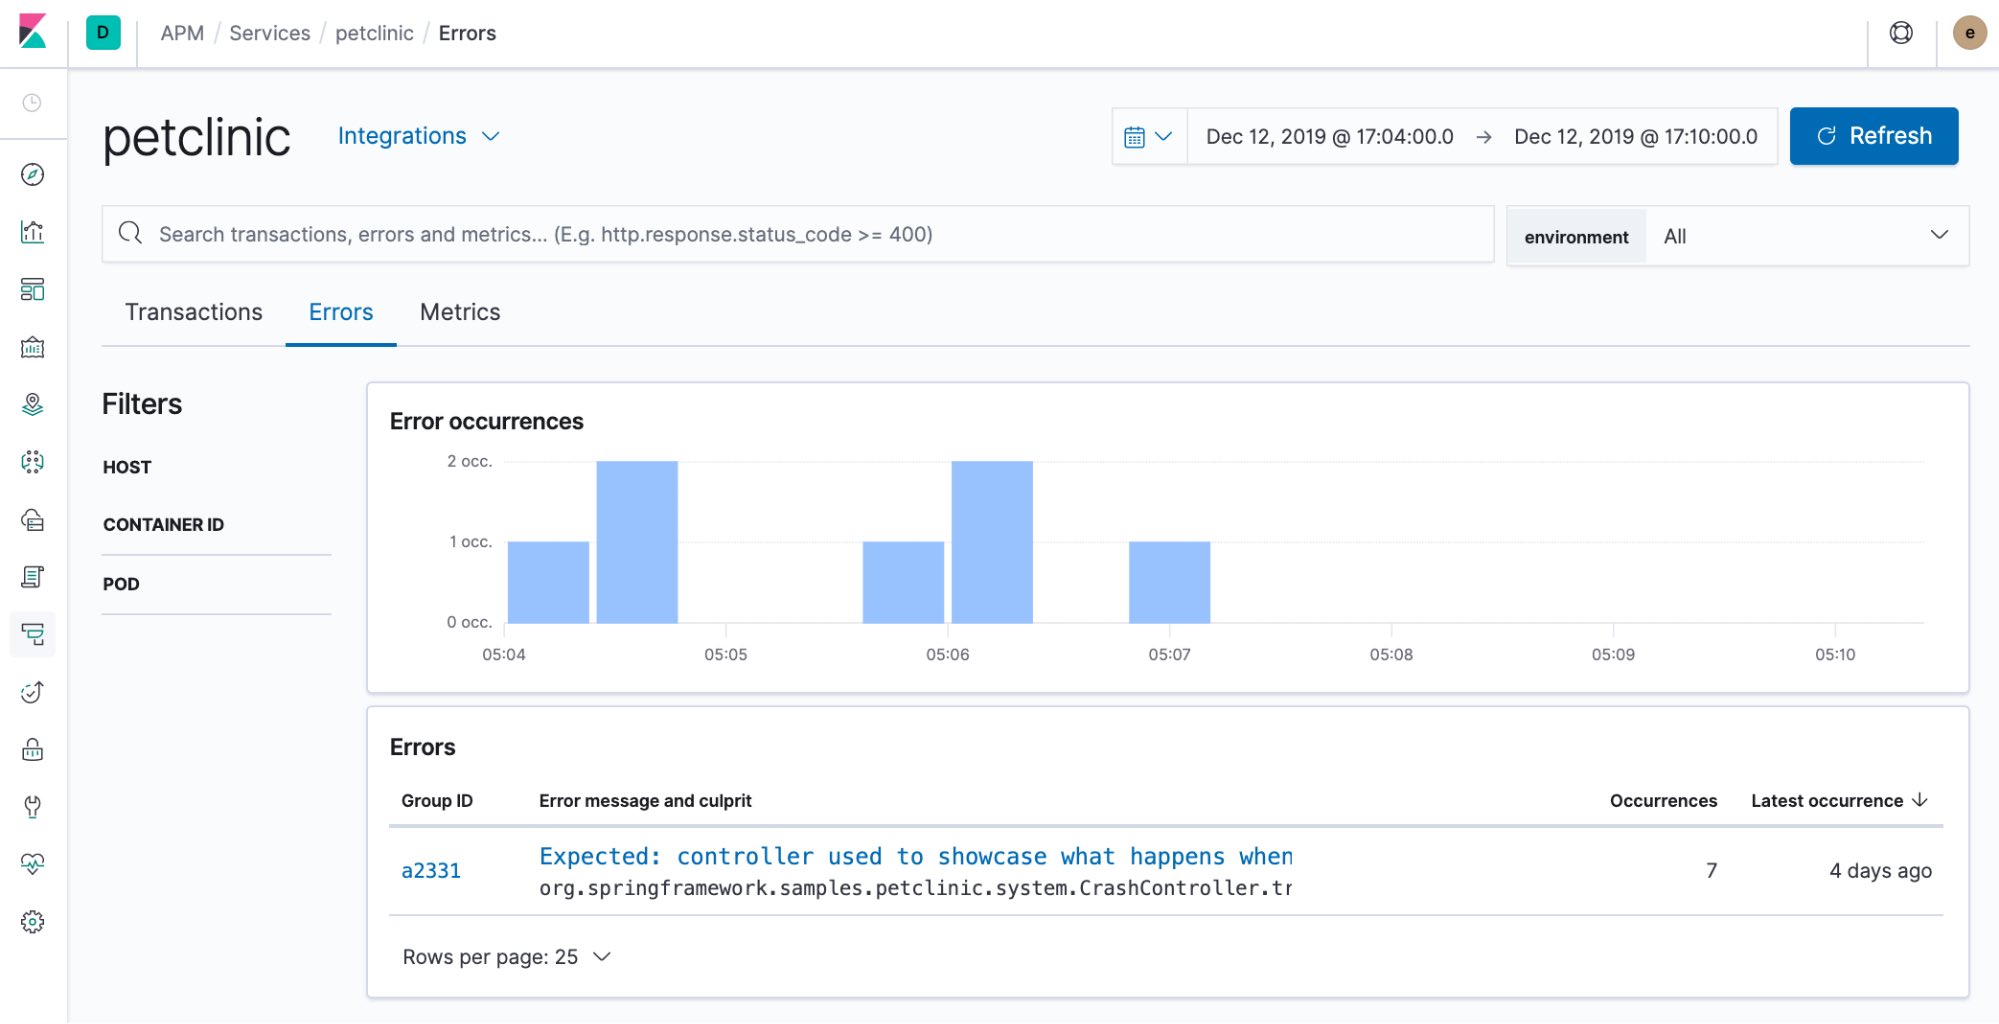
Error details
Further enhancements for our Kubernetes offering
We are only at the beginning of our Kubernetes integration path, with lots of enhancements to come. We are looking into ways of making the agent installation more native and seamless, requiring even less configuration than suggested above.
More importantly, we are constantly working to improve our holistic observability offerings and the Kubernetes ecosystem is no exception. Our goal is to provide a Kubernetes-native solution that will tie your APM traces together with logs and metrics with near-zero effort and we do not intend to rest until we get there, so there’s a lot to look forward to.