


Elastic Stack Monitoring with Elastic Cloud on Kubernetes
Elastic Cloud on Kubernetes (ECK) is the official operator for provisioning Elastic Stack deployments in Kubernetes. It orchestrates not only day-one provisioning, but also has the processes and best practices for day-two management and maintenance baked in. If you want to run your own Elastic Stack deployment on Kubernetes, then look no further than ECK! (If you'd rather have someone manage it for you then you should also check out Elasticsearch Service on Elastic Cloud.)
The recent release of Elastic Cloud on Kubernetes 1.2 introduced support for Beats. Deployment and management of Filebeat, Metricbeat, and all other Beats is now possible directly through ECK. Combined with the existing support for Elasticsearch, Kibana, and APM Server, ECK can drive an end-to-end experience for the Elastic Stack in Kubernetes environments.
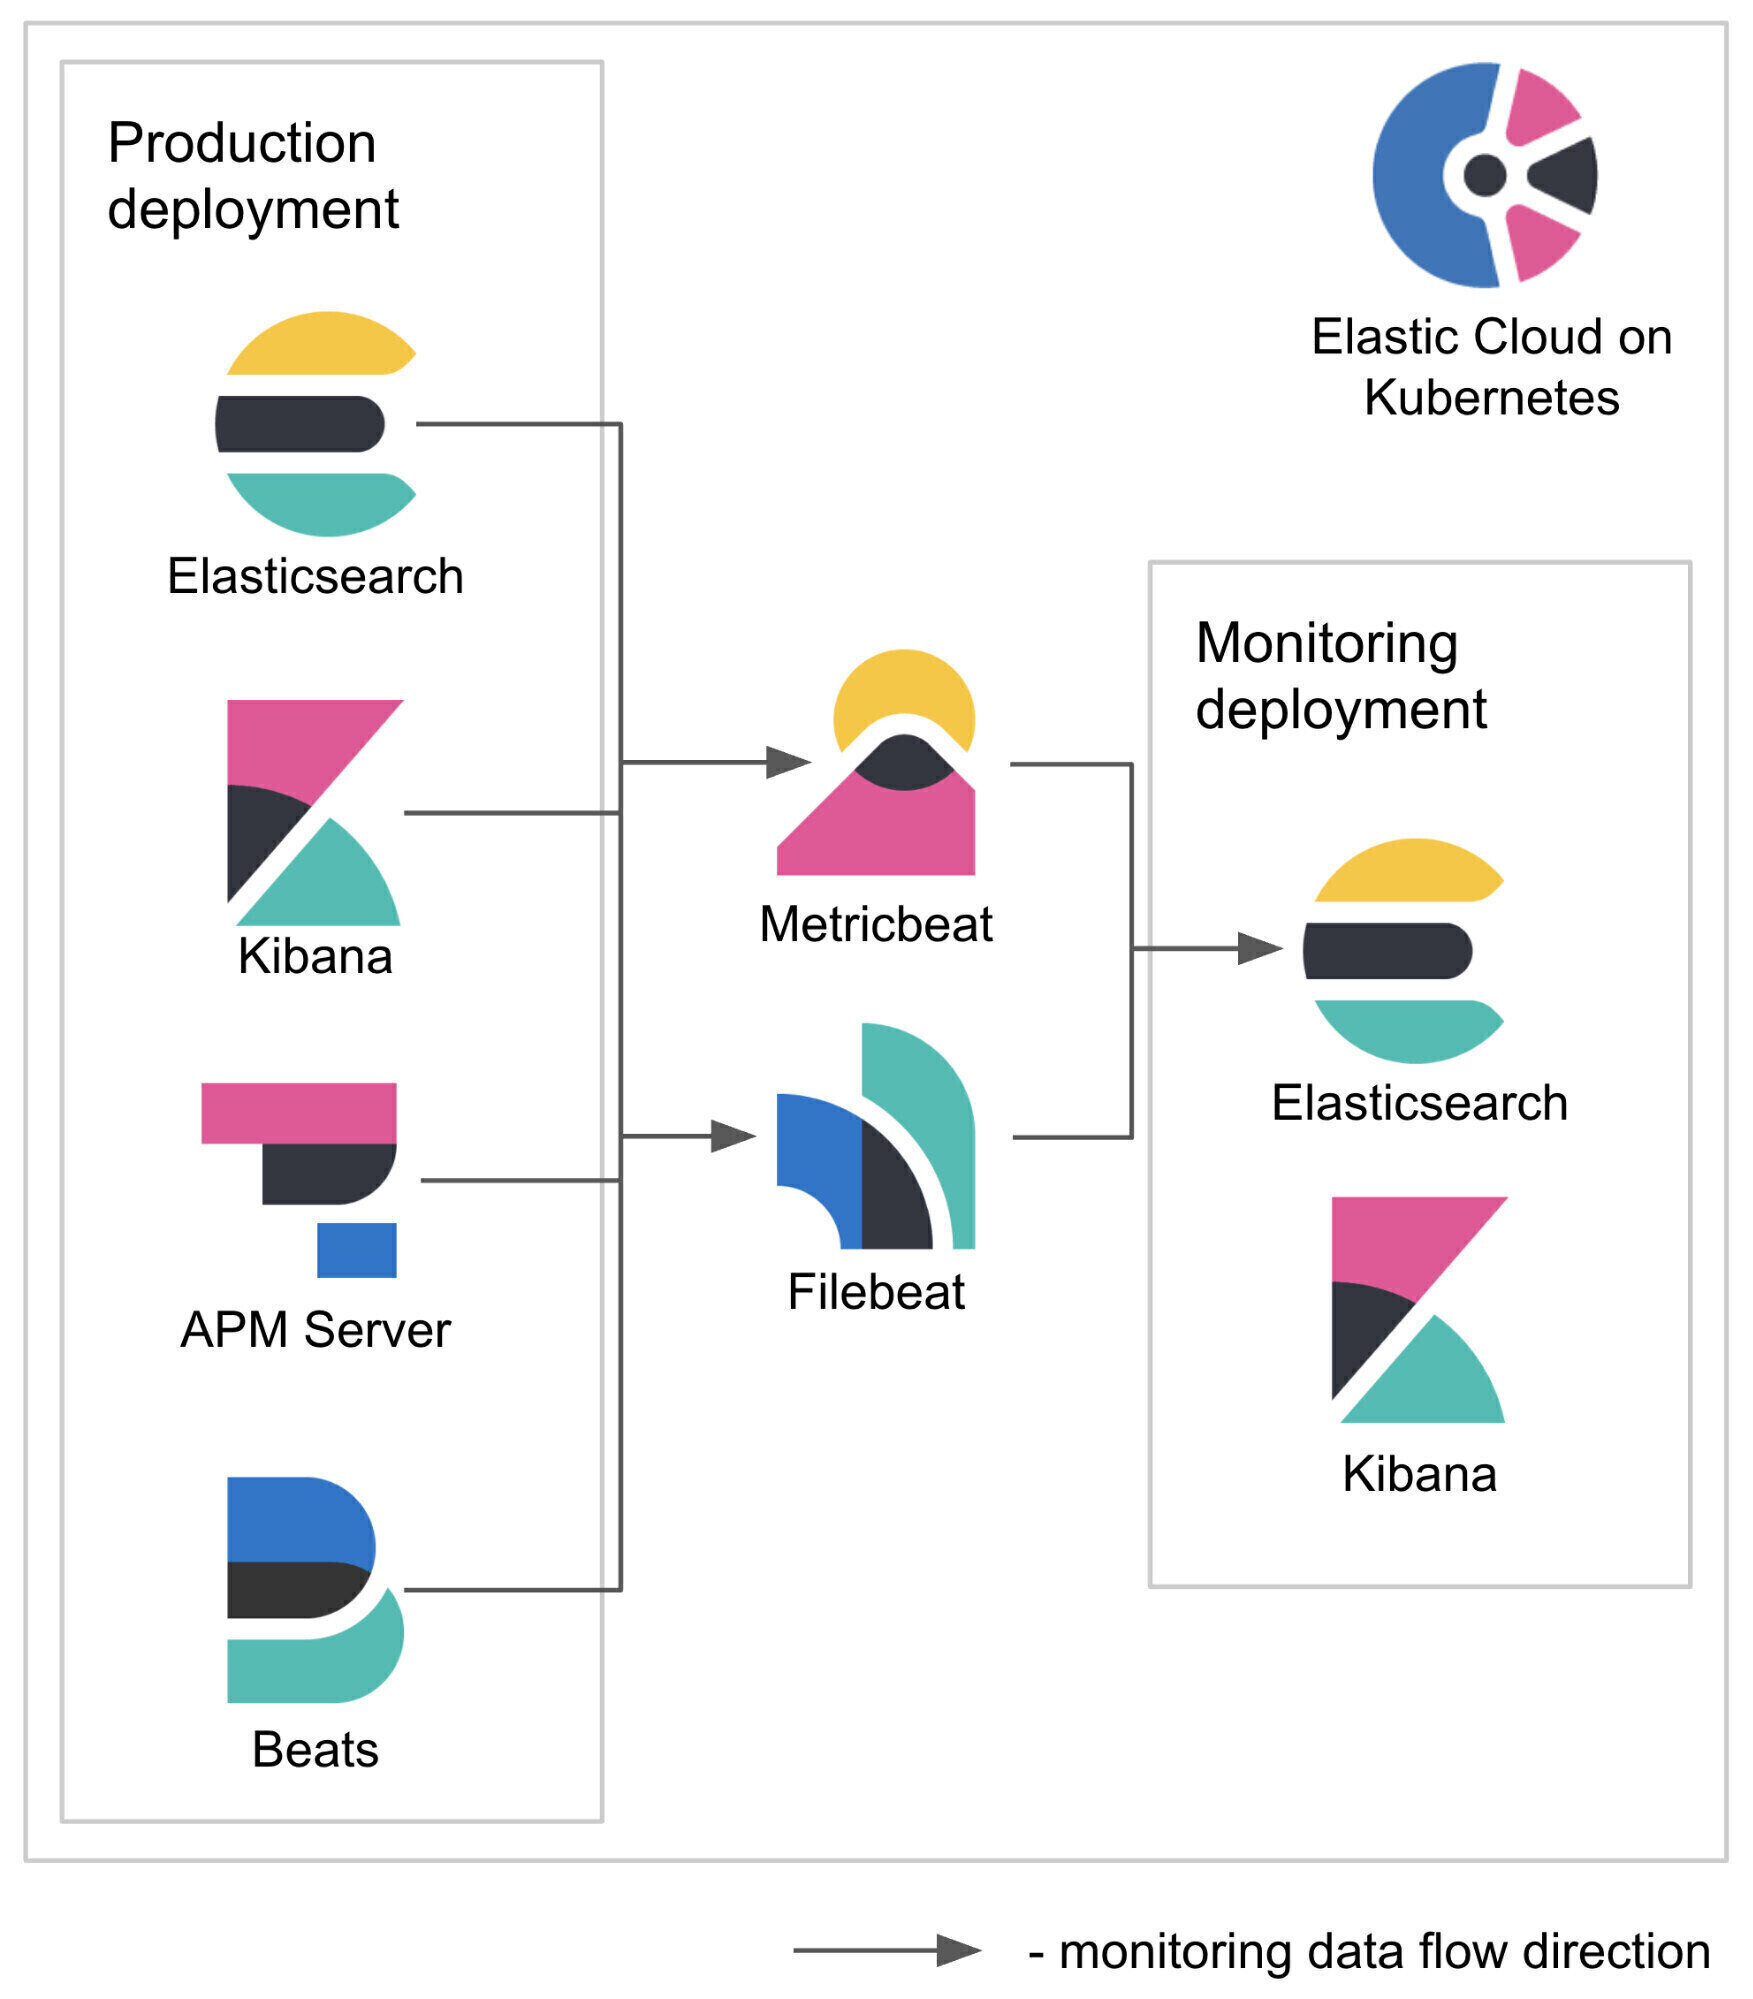
In this blog post we will explore how these new capabilities can be used to set up Stack Monitoring for Elasticsearch, Kibana, APM Server, and Beats. To do so, we will launch two Elastic Stack deployments — one to be monitored and one to perform the monitoring. We will then use Metricbeat and Filebeat to collect metrics and logs from the monitored components as pictured in the architectural diagram below.
Configuration notes
Two things before we get started...
- A single, all-in-one file containing manifests for all required resources described in this blog post is available here.
- For purposes of this post we will assume that we are deploying to the
defaultnamespace. If you would like to deploy elsewhere, you will need to change the namespace in resources related to RBAC (ServiceAccountandClusterRoleBinding) as well as in the Heartbeat monitor configuration.
Set up ECK
If ECK is not already deployed in your Kubernetes cluster, you can use the below command to install it. The same command can be used to upgrade ECK to the version that supports Beats (1.2+). You can also see our ECK documentation for more details.
kubectl apply -f https://download.elastic.co/downloads/eck/1.2.1/all-in-one.yaml
Create the monitored Elastic Stack
In order to monitor this first deployment, we’re going to need to make changes to a few config files. Let’s take a look at these tweaks.
Configure Elasticsearch, Kibana, and APM Server
Let's start with setting up a simple deployment of Elasticsearch, Kibana, and APM Server that we will monitor. To enable Stack Monitoring for these products, small changes to their configurations are needed compared to a deployment without Stack Monitoring enabled. These changes include:
- Making Pods easily autodiscoverable by applying a label to monitored Pods. We will use the
stack-monitoring.elastic.co/typelabel for that purpose. - Enabling logs collection via a well-known
co.elastic.logs/enabledannotation. Our monitoring Filebeat will only pick logs of Pods that have this annotation set totrue. - Disabling legacy metric collection method by setting both
xpack.monitoring.elasticsearch.collection.enabledandxpack.monitoring.kibana.collection.enabledtofalse. - Enabling metrics collection by setting
xpack.monitoring.collection.enabledtotrue. - Exposing an endpoint to allow metric collection for APM Server. For Elasticsearch and Kibana, metrics can be fetched using their regular, already available endpoints.
For example, the Elasticsearch resource would have the following added:
spec:
  config:
    xpack.monitoring.collection.enabled: true
    xpack.monitoring.elasticsearch.collection.enabled: false
  podTemplate:
    metadata:
      labels:
        stack-monitoring.elastic.co/type: es
      annotations:
        co.elastic.logs/enabled: "true"
To deploy all resources with the appropriate configurations changes already made, run:
kubectl apply -f https://static-www.elastic.co/v3/assets/bltefdd0b53724fa2ce/blt70e85703e1da4a66/5f71774b51d0774abbe552e6/es-kb-apm-monitored.yaml
Configure Beats
Similarly, Beats that we want to monitor also require some changes to their configuration to enable Stack Monitoring. These changes include:
- Making Pods easily autodiscoverable by applying a label to monitored Pods. We will use the
stack-monitoring.elastic.co/typelabel for that purpose. - Enabling logs collection via a well-known
co.elastic.logs/enabledannotation. Our monitoring Filebeat will only pick logs of Pods that have this annotation set totrue. - Disabling internal metric collection method by setting
monitoring.enabledtofalse. - Exposing an endpoint to allow metric collection.
For example, the Filebeat resource would have the following added:
spec:
  config:
    http.enabled: true
    http.port: 5066
    http.host: 0.0.0.0
    monitoring.enabled: false
...
  daemonSet:
    podTemplate:
      metadata:
        labels:
          stack-monitoring.elastic.co/type: beat
        annotations:
          co.elastic.logs/enabled: "true"
      spec:
        containers:
        - name: filebeat
          ports:
          - containerPort: 5066
            name: monitoring
            protocol: TCP
To deploy all resources with the appropriate configuration changes already made, run:
kubectl apply -f https://static-www.elastic.co/v3/assets/bltefdd0b53724fa2ce/blt758c96e2ae22833f/5f71774c67fb9e45454380c6/filebeat-monitored.yaml
kubectl apply -f https://static-www.elastic.co/v3/assets/bltefdd0b53724fa2ce/blt63fa315c67ce1cc8/5f71774c1c1c533ba55d60a9/metricbeat-monitored.yaml
kubectl apply -f https://static-www.elastic.co/v3/assets/bltefdd0b53724fa2ce/blt622b18fa02da60dd/5f71774c8c3821496a601bec/heartbeat-monitored.yaml
Configure existing components
If you wish to enable Stack Monitoring for components of your already existing deployment, please make sure that their configurations contain the changes outlined above. You can also compare *_base.yaml files (for Filebeat, Metricbeat, Heartbeat and Elasticsearch, Kibana, APM Server) with their *_monitored.yaml counterparts to discover what changes are needed exactly.
Create the monitoring Elastic Stack
Now let's move on to creating a separate Elastic Stack that we will use to perform the monitoring of the Stack we’ve already deployed. This one will include Elasticsearch, Kibana, Metricbeat, and Filebeat. Metricbeat will collect metrics from all Pods of all monitored components endpoints that we exposed. Filebeat will collect logs from all Pods of all monitored components. We will explore two options of hosting the Elasticsearch and Kibana used for monitoring:
- Deploy it using ECK in the same Kubernetes cluster, or
- Deploy it on Elastic Cloud (free for a 14-day trial)
Deploy on Kubernetes using ECK
To deploy Elasticsearch and Kibana for the monitoring cluster, run:
kubectl apply -f https://static-www.elastic.co/v3/assets/bltefdd0b53724fa2ce/bltebb3cb94ae14c511/5f717762747ff04fb790086a/monitoring-beats-eck.yaml
To deploy Metricbeat and Filebeat for the monitoring cluster, run:
kubectl apply -f https://static-www.elastic.co/v3/assets/bltefdd0b53724fa2ce/blt15e75034cdf96fbc/5f717762419b304ab54c37d8/monitoring-es-kb.yaml
Filebeat is configured to not pick up logs from any of the Pods unless the annotation co.elastic.logs/enabled is set to true. In addition to that, ECK annotates all Elasticsearch and Kibana Pods with co.elastic.logs/module set to elasticsearch and kibana, respectively. This is used by Filebeat autodiscover feature to enable appropriate modules.
Metricbeat will collect metrics from Pods with the stack-monitoring.elastic.co/type label. The value of that label will be used to determine which module (elasticsearch, kibana, or beat) should be enabled. Note that APM Server should be monitored using the beat module as it's based on libbeat.
Below you can see how a configuration template is chosen conditionally based on the presence and value of the stack-monitoring.elastic.co/type label. Dots in the label name are replaced by underscores as expected by Beat.
    metricbeat:
      autodiscover:
        providers:
          - type: kubernetes
            scope: cluster
            hints.enabled: true
            templates:
              - condition:
                  equals.kubernetes.labels.stack-monitoring_elastic_co/type: es
                config:
                  - module: elasticsearch
                    metricsets:
                      - ccr
                ...
              - condition:
                  equals.kubernetes.labels.stack-monitoring_elastic_co/type: kb
                config:
                  - module: kibana
                    metricsets:
                      - stats
                ...
              - condition:
                  equals.kubernetes.labels.stack-monitoring_elastic_co/type: beat
                config:
                  - module: beat
                    metricsets:
                      - stats
                ...
Deploy on Elastic Cloud
Alternatively, you can use Elastic Cloud to host your monitoring cluster. This will allow for even stronger isolation between your monitored and monitoring infrastructure. To configure Metricbeat for sending data to a cluster in Elastic Cloud, you need to perform minimal changes to the Metricbeat/Filebeat resources:
- Remove
elasticsearchRefandkibanaRefto prevent ECK from managing the output and dashboard setup. - Provide
cloud.idandcloud.auththat you've obtained during deployment in Elastic Cloud.
You can use https://static-www.elastic.co/v3/assets/bltefdd0b53724fa2ce/blt19cb35009d4f6e59/5f71776251d0774abbe552ea/monitoring-beats-cloud.yaml file to deploy the correctly configured Beats. Provide cloud.id and cloud.auth in both Metricbeat and Filebeat config, as below.
spec:
  config:
   cloud.id: # your cloud.id goes here
   cloud.auth: # your cloud.auth goes here
...
As cloud.id and cloud.auth are credentials, consider using secure settings to store them.
|
Then, you can run:
kubectl apply -f monitoring-beats-cloud.yaml
Now that both of our deployments are up and running, we can start monitoring.
Stack Monitoring within Kibana
When both monitored and monitoring Elastic Stacks are up and running, you can log in to Kibana. If you’ve deployed Elastic Stack Monitoring with ECK, you can use the below to get the password of the elastic user and set up port-forwarding from your machine.
$ echo $(kubectl get secret elasticsearch-monitoring-es-elastic-user -o=jsonpath='{.data.elastic}' | base64 --decode)
O6xA69Sf13cn8FaA9588XBmp
$ kubectl port-forward svc/kibana-monitoring-kb-http 5601
Forwarding from 127.0.0.1:5601 -> 5601
Now you are able to access Kibana at https://localhost:5601/.
Stack Monitoring can be found in the Management section of the menu. The view should be similar to the one below. Note that this UI enables you to inspect any of the components and monitor errors, resource usage, rates, and more for any of the instances and indices. With the release of Elastic 7.9, you can now set up alerts for those metrics as well.
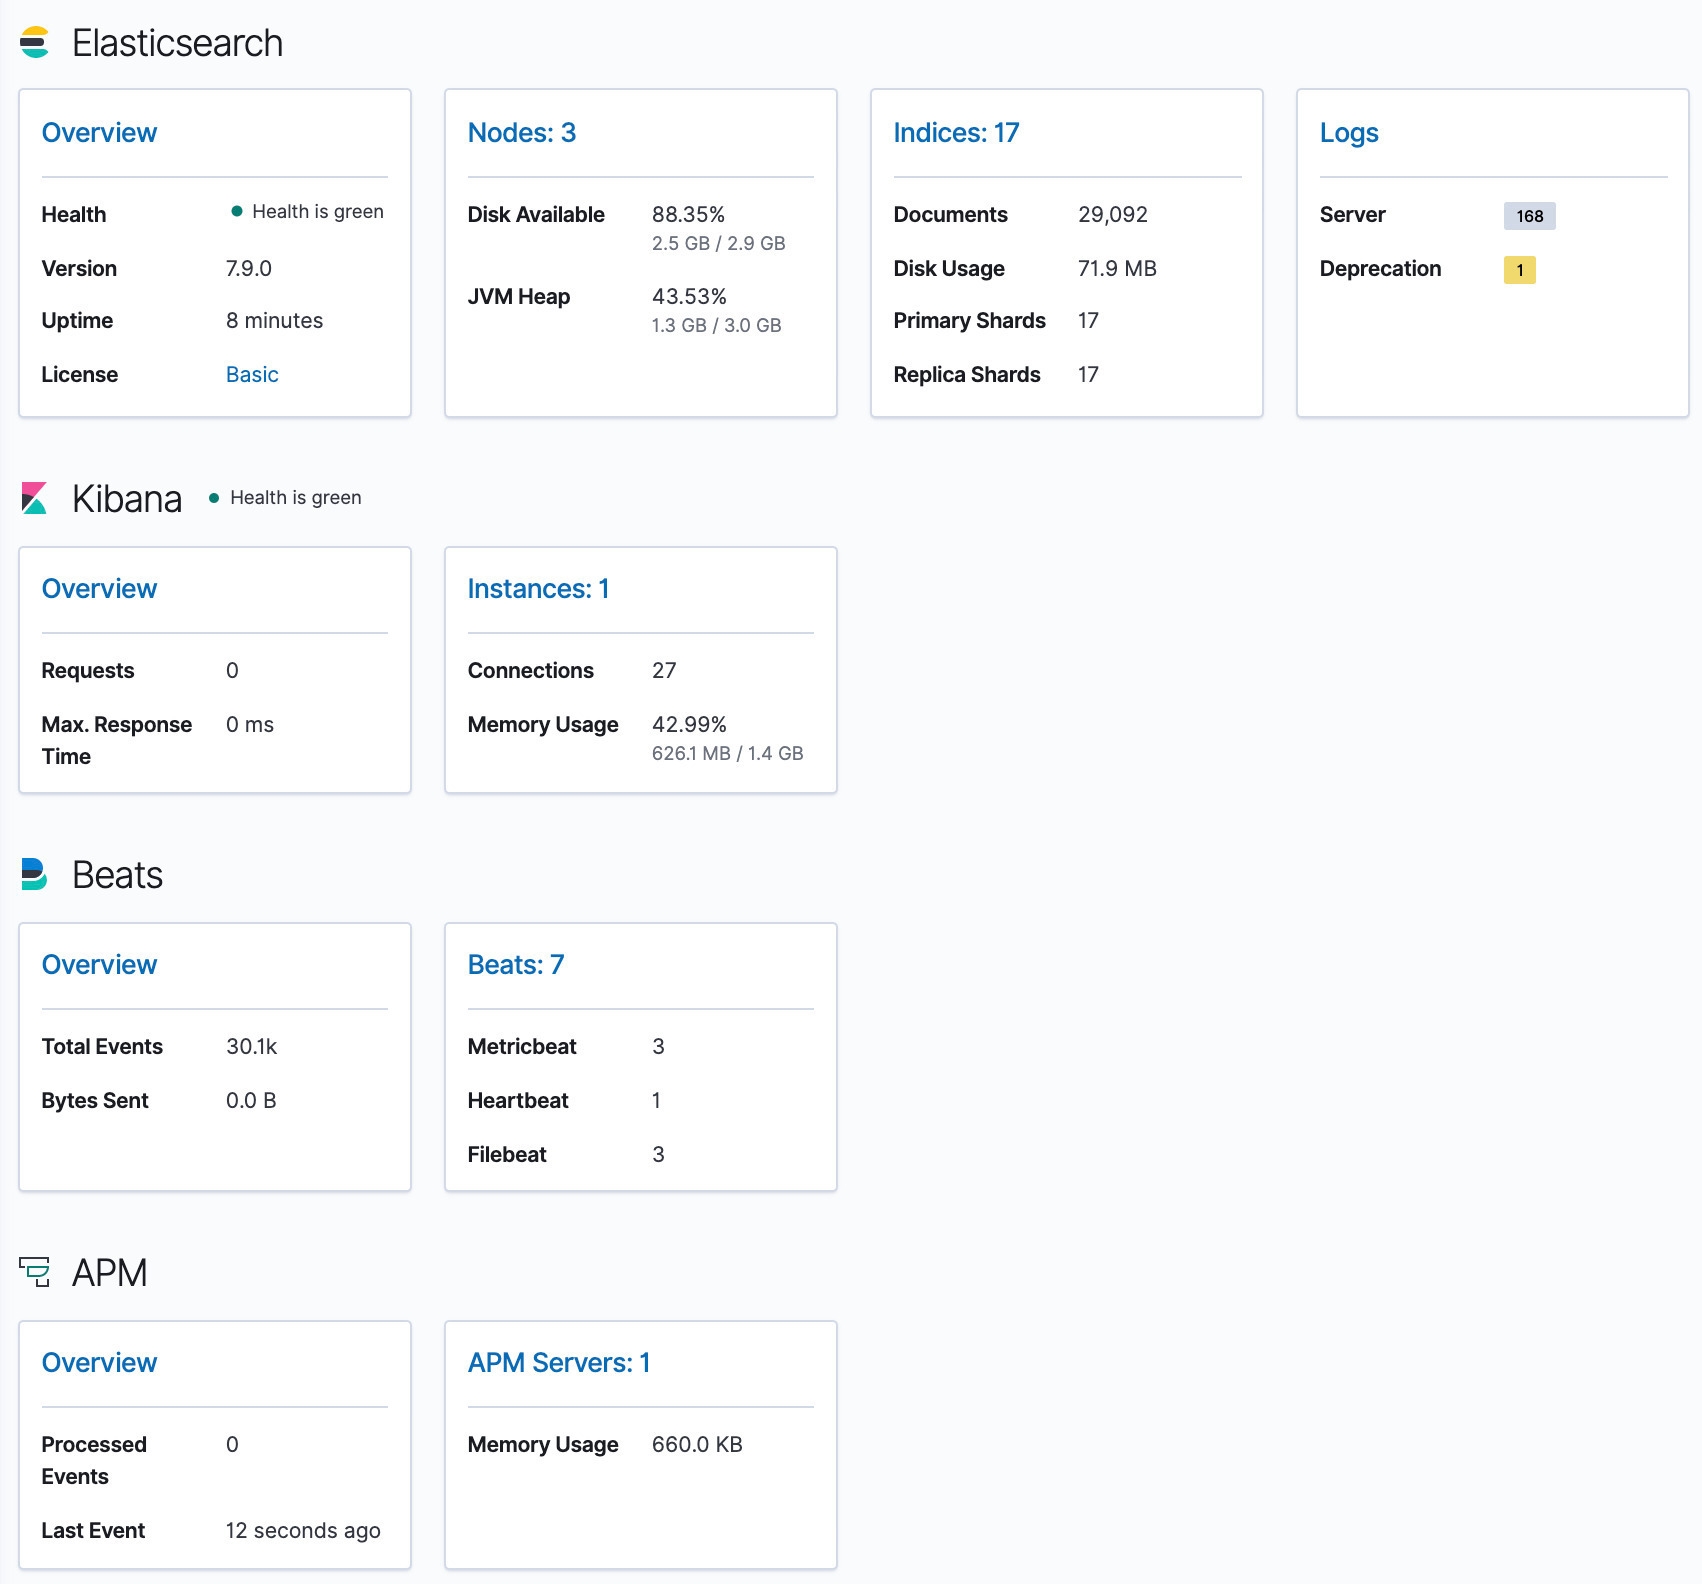
In the screenshot above, we can see a healthy deployment of a three-node Elasticsearch cluster, a single instance of Kibana, a single instance of APM Server, three Metricbeats, three Filebeats, and a single Heartbeat. From here, we can dig deeper into more detailed metrics and dedicated dashboards for each of those components.
Summary
In this blog post we explored how the Elastic Stack can be deployed and monitored using Elastic Cloud on Kubernetes. We configured two Elastic Stack deployments — one to be monitored and one to perform the monitoring. Finally, we used Stack Monitoring in Kibana to look at the health of our first deployment.
For more information about running Beats on ECK, check out the Quick Start and configuration examples. If you have any questions, start up a conversation on our Discuss forums — we'd love to hear from you.