


A survey on modules, data sources, and ingestion experience
Struggling to collect and analyze data for a particular use case? Read on.
The 30 seconds read:
- Modules automate the collection and analysis of data from common sources
- We want to expand the modules effort to support more data sources
- We need your input to prioritize the next wave of modules
Which modules should we build next? Let us know by filling out this short survey. It will take only couple of minutes. We promise.
Need a little more context? Read on.
The 5 minutes read:
Modules were build on the principle that simple things should be simple. They let you go from raw data to dashboards in literally minutes. Or dare I say seconds. With just one command, your data is collected, parsed, enriched and indexed into Elasticsearch, and ready for exploration in prepackaged Kibana dashboards (which also ship with the module).
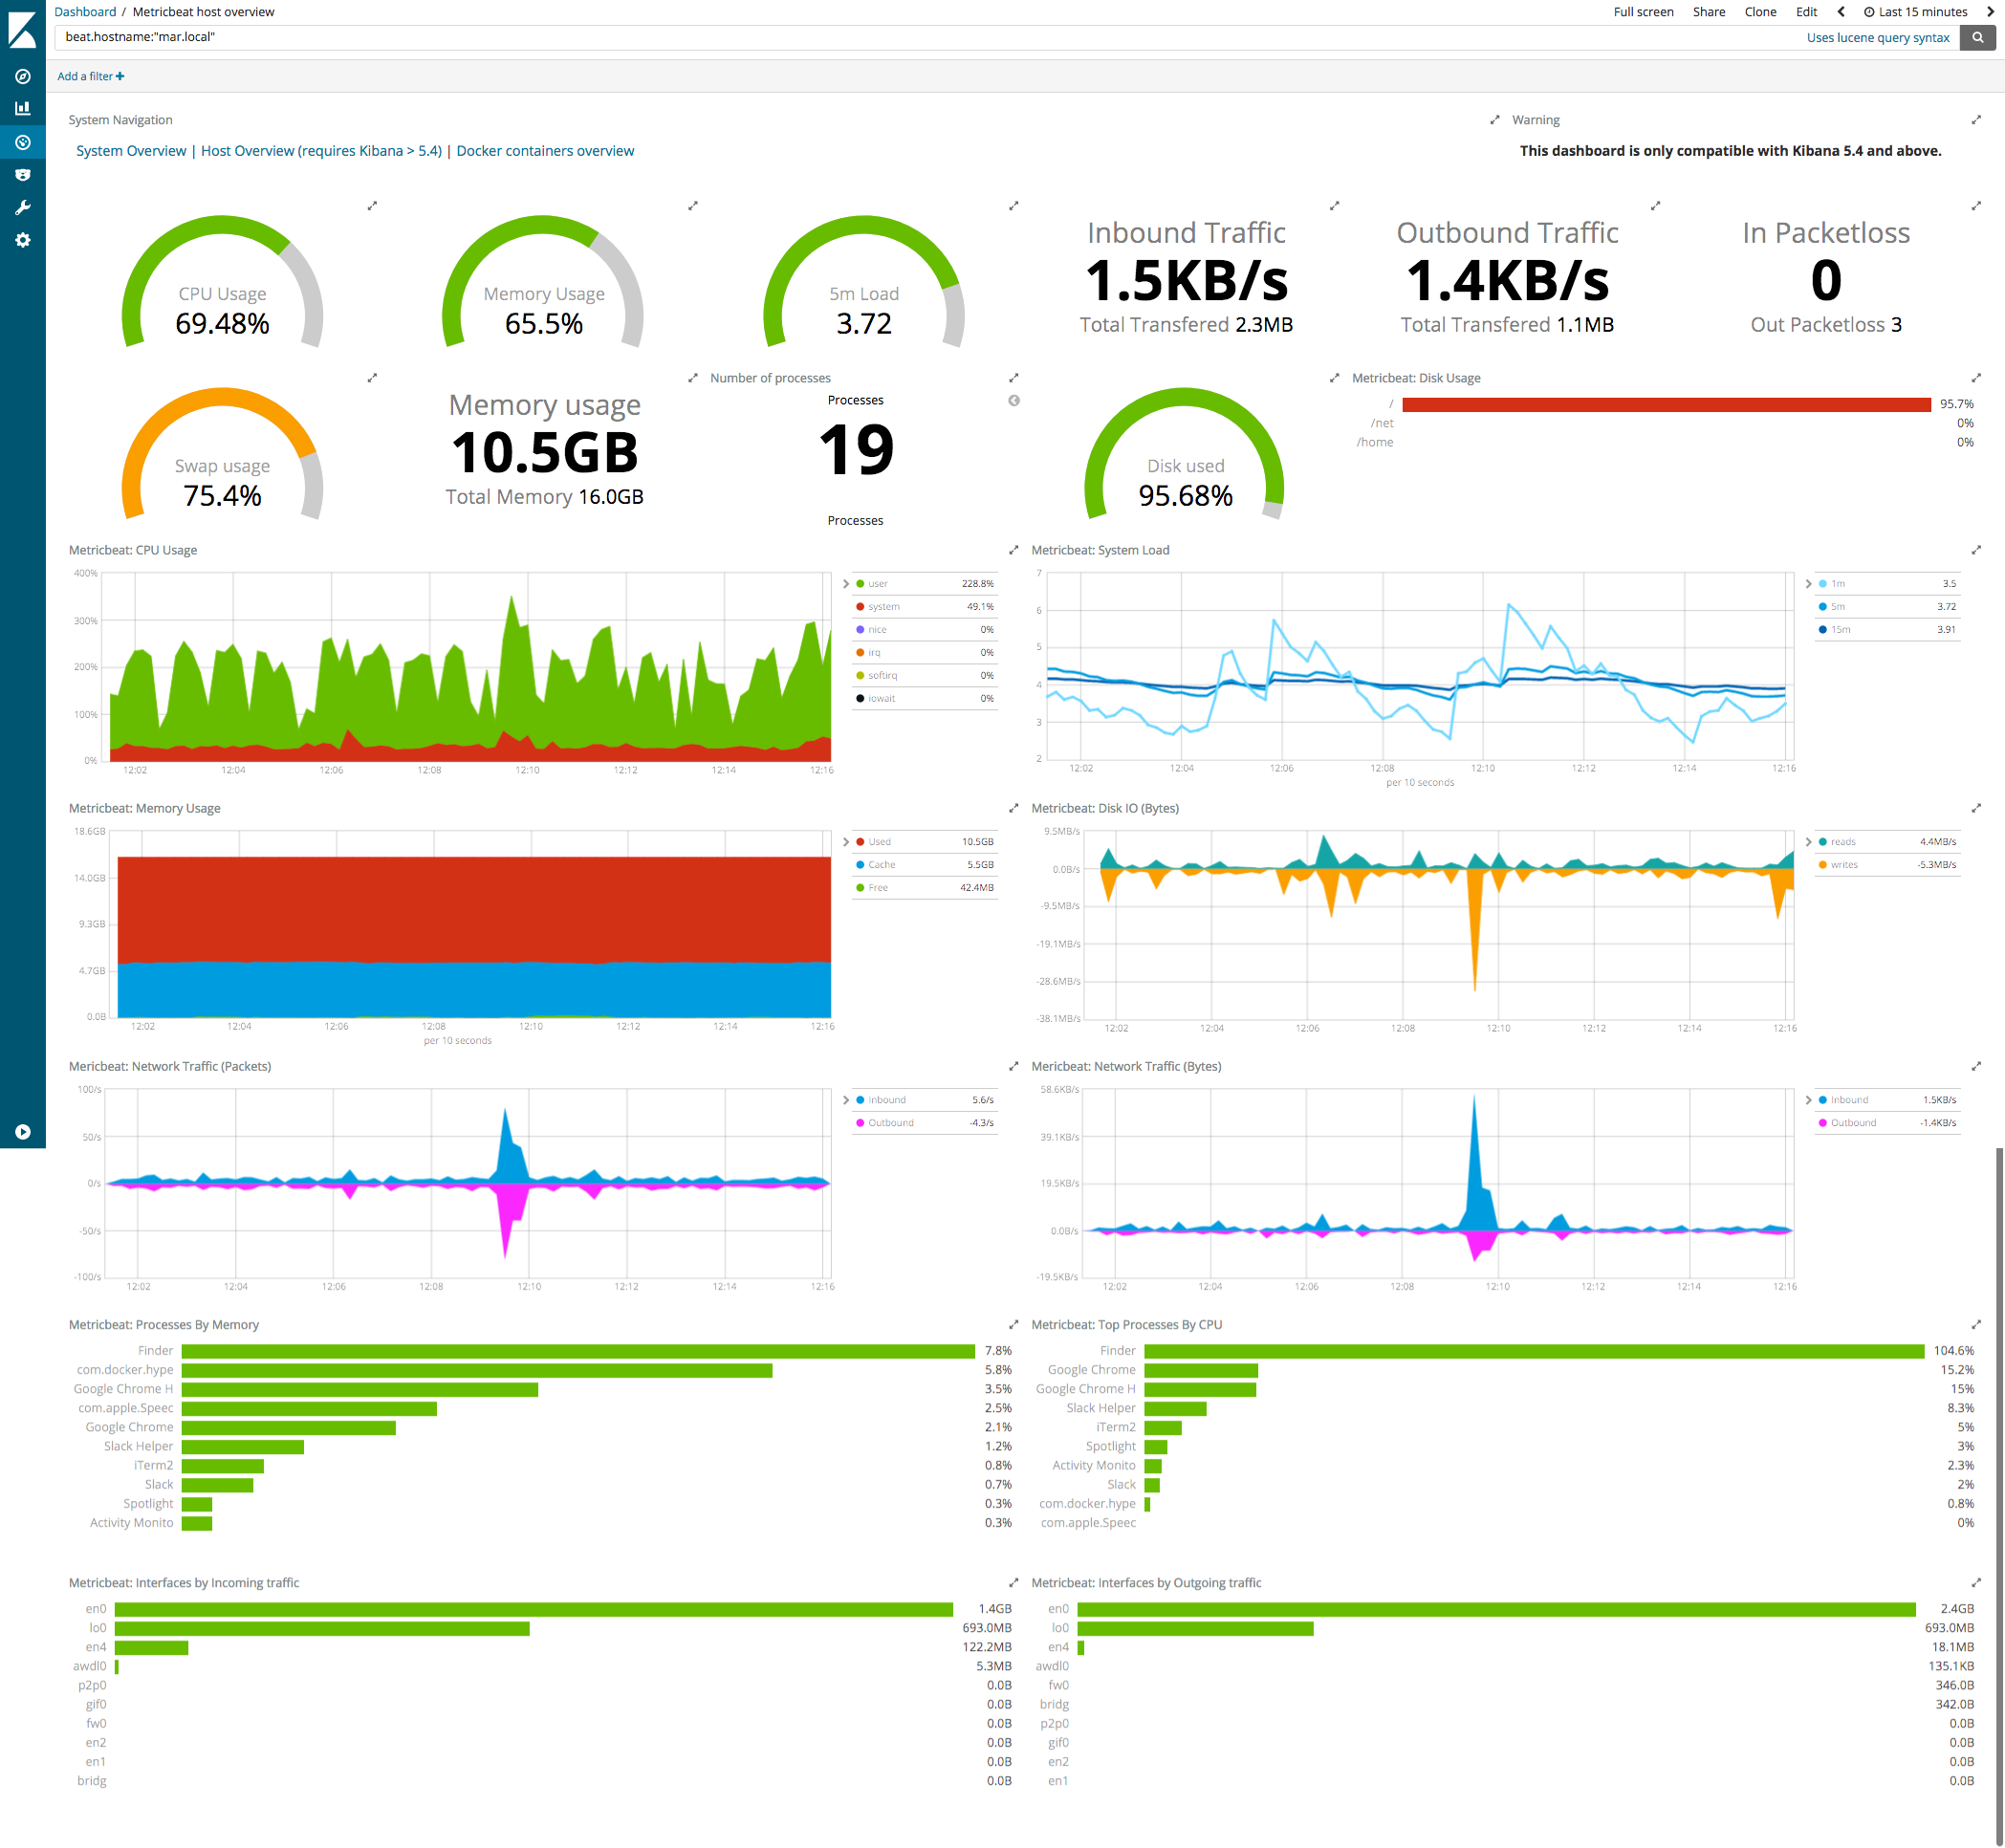
Below is one such example of a prepackaged module dashboard, this one’s from the system module in Metricbeat.
A little history lesson
The concept of modules was initially introduced in Metricbeat 5.0 last year, and tried to streamline data to dashboard experience for metrics from the OS and other common services (Redis, Apache, etc) running in your infrastructure. The idea really took off with the addition of modules to Filebeat in version 5.3.0. With Filebeat modules, we really aimed to get the experience to be turn-key from the beginning. Filebeat modules also extended the concept from metrics to common log formats, such as Apache and NGINX access logs. In version 5.6, Logstash entered the modules party with ArcSight and Netflow modules.
Going beyond dashboards
So, what’s next for modules? More modules for more data sources is an obvious direction. But, we have recently started exploring how modules could further enrich the getting started experience, by going beyond data to dashboard. Why stop at dashboards? Why not data to insight?
In 5.6, we tested this concept by adding preconfigured machine learning jobs to the NGINX module in Filebeat. Now, with just one command you not only have NGINX logs visualized in Kibana dashboards, but you also have machine learning jobs (requires X-Pack) that track anomalies on common metrics (such as visitor rate, request rate, etc) in those logs.
The journey ahead (and we need your inputs)
In the last year, the ecosystem has grown to 40+ modules across Metricbeat, Filebeat, and Logstash. We want to continue down this path by building more modules and expanding this simple getting started experience to more data sources. As we start planning for the 6.x releases, we would love a little help from you, our community, to help prioritize the next wave of modules.
Fill out this short survey to let us know which modules you are currently using and which modules we should build next. It’s a super short survey and should take only a couple of minutes to complete.