


Leveraging Elasticsearch at 1WorldSync to increase product sales
This article describes how 1WorldSync came to introduce Elasticsearch and the Elastic Stack in our infrastructure. The goal was to provide a much faster search experience for our customers as well as a means to proactively take action if there are trends for production issues.
Our Business
1WorldSync is the leading provider of product content solutions, enabling more than 25,000 global companies in over 65 countries to share authentic, trusted content with customers and consumers. 1WorldSync provides solutions that meet the diverse needs of the industry through its technology platform and expert services empowering intelligent choices for purchases, wellness, and lifestyle decisions.
We provide several products for our customers as SaaS. On the supplier side, we provide a Publisher product; while on the retailer side, we have an Approval service. The Publisher product enables customers like Coca Cola, Unilever, etc. to administer their product information and distribute them worldwide to retailers like Edeka, Metro, Rewe, Walmart and others. The Approval product is used by retailers to get up-to-date metadata information about the products sold in their stores. They approve the metadata about the articles or reject the metadata due to missing information necessary for the retailers.
Elasticsearch at the Core of our Search Engine
As a customer would like to search for article information like title, description, logistics information, ingredients, there is naturally a need for a search functionality that helps the customer get the respective results for those queries. The product information, referred to as (trade) items, persists in a relational Oracle database. An item contains all the information belonging to that product. The nature of items demands a flexible schema, since not each and every product (chocolate, juice, sweets, ...) has the same kind of attributes. There are also composite attributes, like dimensions, which consist of e.g. value + unit: e.g. “length = 13 cm”). In fact, the GDSN defines more than 4,000 attributes for items. For more information about the GDSN take a look at our mother company GS1.
Therefore, we evaluated document oriented databases to support a deep attribute search (like the length, height, and width) as well as to speed up the search for products. In the German product information community, called FMCG, we have about 20 million products, each with at least hundreds of attributes — which are searchable. To make things a bit more interesting, these items can be organized in a hierarchical order, like a bottle is enclosed in a box which is packed on pallets. On top of that, product information is versioned. So, there is not only one version of a product but several.
The search form looks like this:
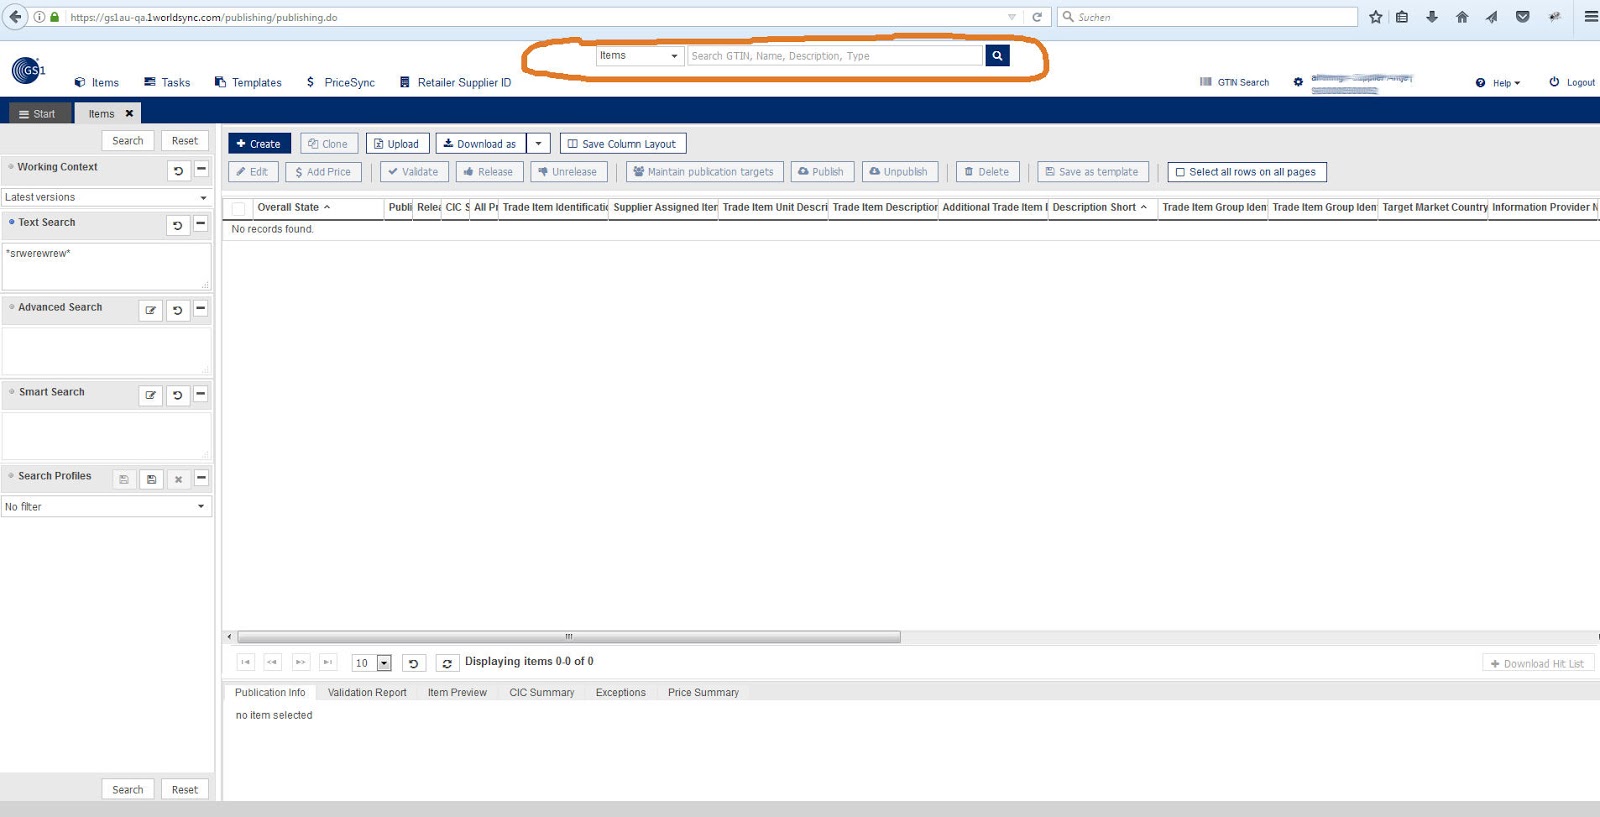
On the top (marked in orange) you can do a free text search for fields like title, description, dimensions. On the left side, you have a detailed search where you can specify types and values to search for. The result is a list of trade items which match the search criterias.
The reason why we decided to use Elasticsearch as our core search engine is because we can store one item as one document (in a denormalized way) and its search is lightning fast. To store data with a flexible schema for the trade items is not an easy task in a relational database. We ran into performance issues for more complex searches while our amount of trade items rose. So, in summer 2015, we began to import the product information data to Elasticsearch to make it searchable. The performance increase due to the switch to Elasticsearch was immense (depending on the specified search up to 10-100 times faster!). So our pilot customer GS1 Australia was happy with the outcome of the new search. On top of the performance increase, we had the new feature to search in composite attributes, which are attribute values nested and composed together. (E.g. physical dimensions consist of length, height and depth as well as a value and a measurement unit like cm or inch).
The product information is stored in Oracle (and then synced with Elasticsearch). The workflow can be visualized as follows:
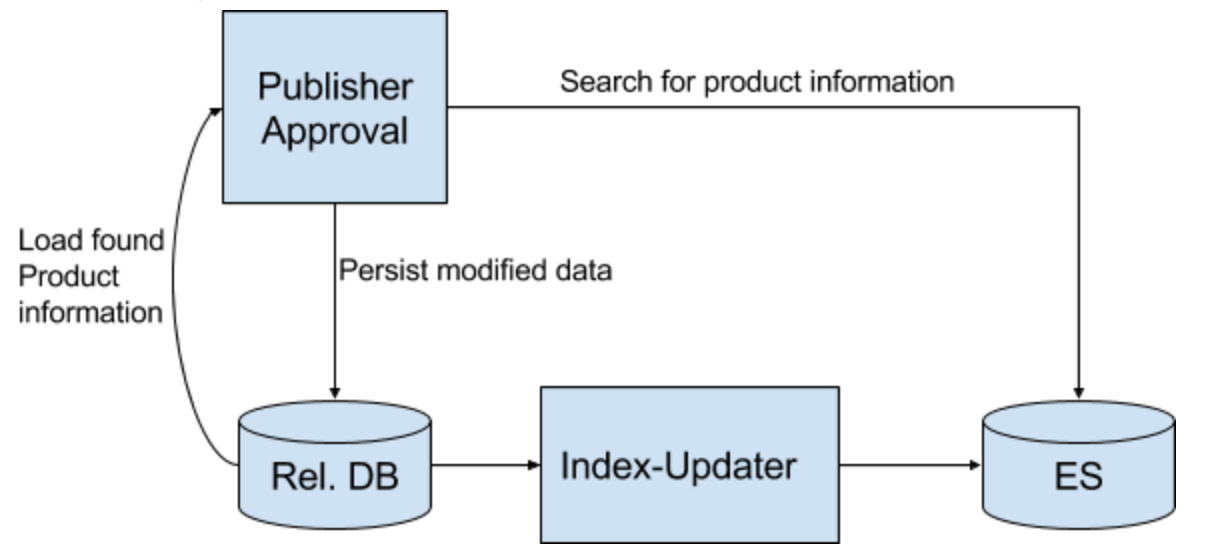
When a user modifies an item, it gets stored in Oracle and is indexed into Elasticsearch synchronously by a separate job (Index-Updater). The delay after a product information is stored in Oracle is about 1-2 seconds. This process is a decoupling mechanism (queueing-like system). Now, when a user searches for an attribute of an item, the UI will query against Elasticsearch (ES) which returns the found item(s). If the user then wants to modify the item, it gets loaded from Oracle in the most current version. Each modification leads to a new version of the item in Oracle as well as in Elasticsearch; this is called revisions. We do not update records in the database. Each modification leads to a new record with a new revision number. In Elasticsearch there is a document stored for each revision.
After the first pilot project for the Australian community, we began with a worldwide rollout (Germany, Japan, UK, Spain, BeNeLux, etc.).
Monitoring Business Trends & Upcoming Issues
Before summer 2015, our monitoring infrastructure consisted of the typical Icinga/Nagios checks along with an alerting. From an operations point of view, this was ok. From a business perspective, we wanted to have more details on business trends and upcoming issues. To look at questions that were asked by our customers, our support team often had to manually dig into the log files. Since our services are distributed over several hosts/data centers, they had to login to various machines and do a “grep” on log files. This wasn’t quite efficient and furthermore heavy “grepping” impacts the host performance since we have several GBytes of log files on each host and millions of message files. On top of that, this could lead to security issues. Since we are currently in the process of a certification for ISO-27001, this had to change. So we decided to introduce the Elastic Stack.
Each virtual machine got a Logstash instance to ship log files to a central redis cluster. In the central data center, several Logstash instances did the indexing into our Elasticsearch cluster.
After this standard setup we developed charts and dashboards with Kibana.
Here’s a 5-day dashboard for several customers:
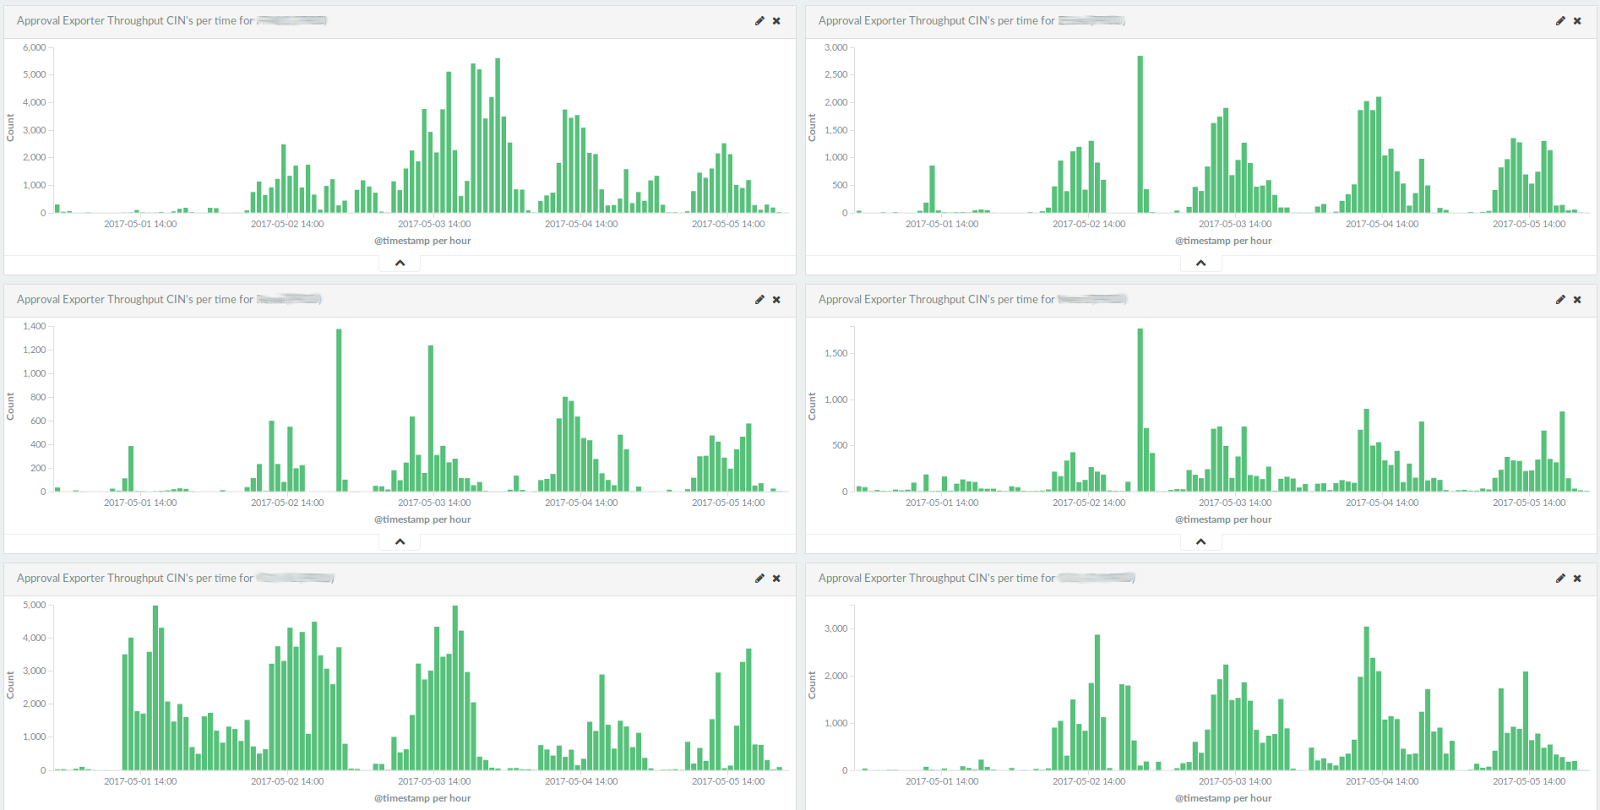
It shows the amount of GDSN messages exported to customer systems. The screenshot shows normal operation: peaks during working hours. Monday, May the 1st was a German holiday, so there was not much traffic for most of our German customers.
Often, customers ask our support about the status of a new or updated trade item. Our support team then has to track the message flow through our infrastructure (from creating a trade item to publishing it, and getting reviews from retailers). This is now done via Kibana (in discover mode). To get an impression, if there is an upcoming issue in the infrastructure, the charts (visualizations) measure metrics like “messages per queue/system/community” or “backlog of messages to process” and so on. Now, the first step is to see if there is a problem in general before digging deeper into the analysis.
Our infrastructure produces about 35 million log events per day. Currently, we have a historical window of about 90 days to analyze issues. From the creation of a log line in a production system to the visibility in Kibana, there is a delay of a few seconds, which is more than enough to analyze issues without logging in into production hosts.
Besides Kibana, we have an additional screen to visualize the current flow of messages throughout the infrastructure (see Diagram 1 below).
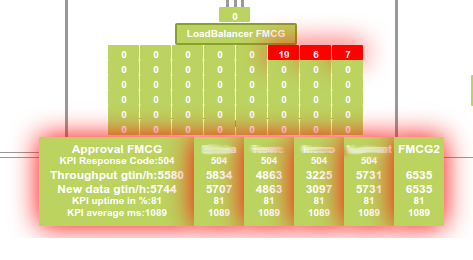
The values of the fields shown above are pulled from the Elasticsearch cluster after processing the log events. Now, for the first time, we get near-real-time performance metrics for our key customers (the values shown are just sample values).
As a third aspect of monitoring, we use Icinga (resp. check_mk) to query metrics of the infrastructure we gather from Elasticsearch. If the metrics are out of line a notification of the support team will be initiated. That way they can react before it becomes a real issue.
Summary and Outlook
On the search end, Elasticsearch provided us with the means to significantly speed up the search process as well as the deep search inside. On the other side, it led to a tremendous effect in terms of Oracle database offloading and in turn to a reduced amount of Oracle licences.
For the time being, we deploy one Elasticsearch cluster per community. For the future, we plan to introduce a centralized cluster of several Elasticsearch instances as well as an upgrade to version 5.x. For the monitoring part, we are thinking about using the new Elastic machine learning features as part of X-Pack.
The goals for the monitoring system were:
- to have a standardized, centralized monitoring system for “grepping” logs
- to get visual overview about the current status of the workflow infrastructure
- to achieve notification and alerting if there are issues in the infrastructure
With the Elastic Stack, we were able to address all of these issues combined with our already existing operations mode.
The next step with the monitoring system will be to upgrade to the Elastic Stack 5.x along with an evaluation of Filebeat, Metricbeat, and Dockbeat.
Mike Gaßmann studied mathematics and computer sciences at the University of Siegen and started working as a freelancer on several projects. After a few years in Siegen he moved to Cologne and started working as a fulltime employee for various web companies. Today his focus lies on DevOps engineering and CI/CD topics with a software engineering background.