Elastic Observability 7.7 released
We are happy to announce the release of Elastic Observability version 7.7. This release improves operational efficiency by bringing enhanced alerting and automation workflows to the Elastic APM, Metrics, and Uptime apps, deepens application performance visibility with the introduction of service maps to Elastic APM, and introduces a boatload of new data integrations that expand the breadth of monitoring coverage for cloud, cloud-native, and enterprise platforms.
Experience the latest version of Elastic Observability on our Elasticsearch Service on Elastic Cloud (free 14-day trials available) or install the latest version of the Elastic Stack for a self-managed experience.
And now to the release highlights in Elastic Observability.
Integrated alerting workflows in Uptime, Metrics, and APM
Alerting is a foundational part of observability and monitoring workflows. Whether it's keeping a pulse on application response times, error rates, or some other system KPI, alerting helps operations teams automatically get notified and act on changes in their infrastructure. The Elastic Stack has provided powerful alerting capabilities since 2015. In version 7.7, we are excited to extend those foundational capabilities to the observability workflows in a more integrated and context-rich way.
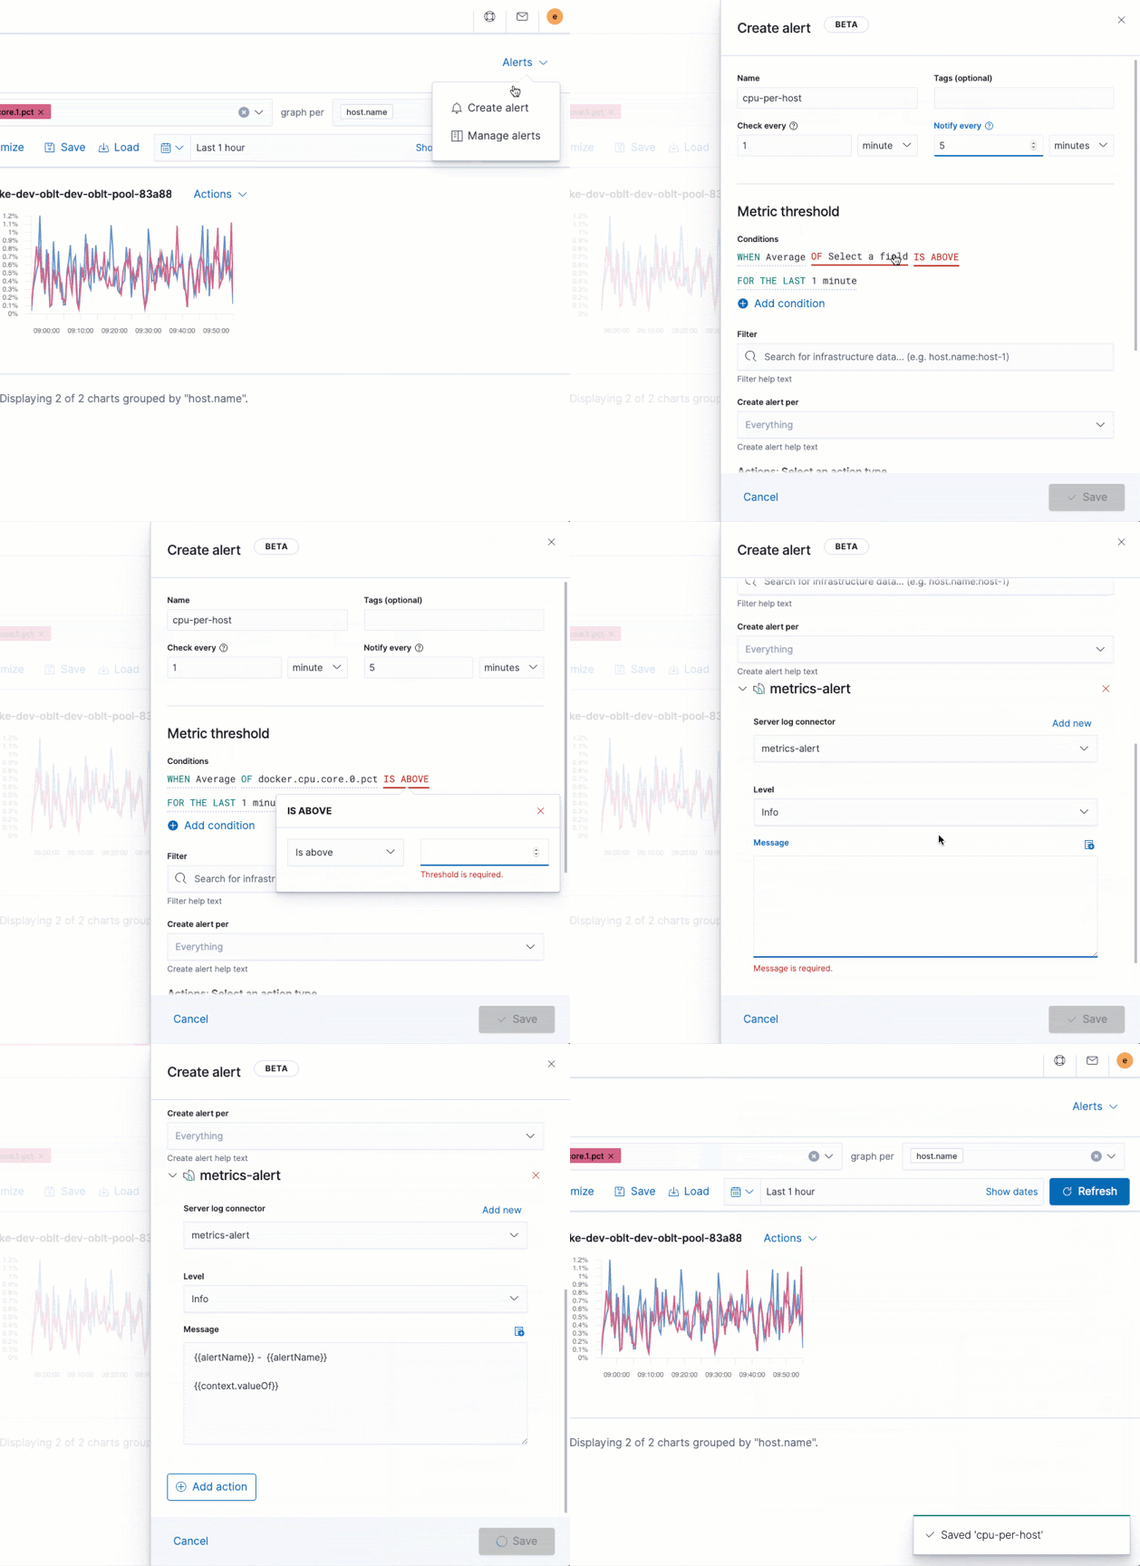
Users can now manage the end-to-end alerting workflow — defining the condition, schedule, and action — directly from within the APM, Metrics, and Uptime apps. This deep integration brings alerting workflows to where the user is, tailored to their context and use case. Users can go from seeing something interesting (for example, high response time in the APM app) to creating a threshold rule to be paged the next time a similar event occurs, without switching context or screens.

Supported actions include sending notifications via email, through third-party tools such as PagerDuty and Slack, or configuring custom connections via webhook support — so that you can action the response through existing tools and workflows. Our focus with this new alerting experience in Elastic Observability is to meet you where you are — from setup to action.
Users can now create composite conditions that combine metrics. While alerting on single metrics is valuable, these combined conditions are more precise and can help reduce false positives and alert fatigue, which is a huge time sink and challenge for operators. Addressing alert fatigue through higher quality alerts frees up your DevOps, SRE, and IT Operations teams to focus on more important things.
These new alerting workflows in observability are enabled by the redesigned alerting foundation introduced in Elastic Stack 7.7. And this is just the beginning. Read about our vision for alerting, and stay tuned for more exciting developments on this front.
Service maps for full visibility into service dependencies
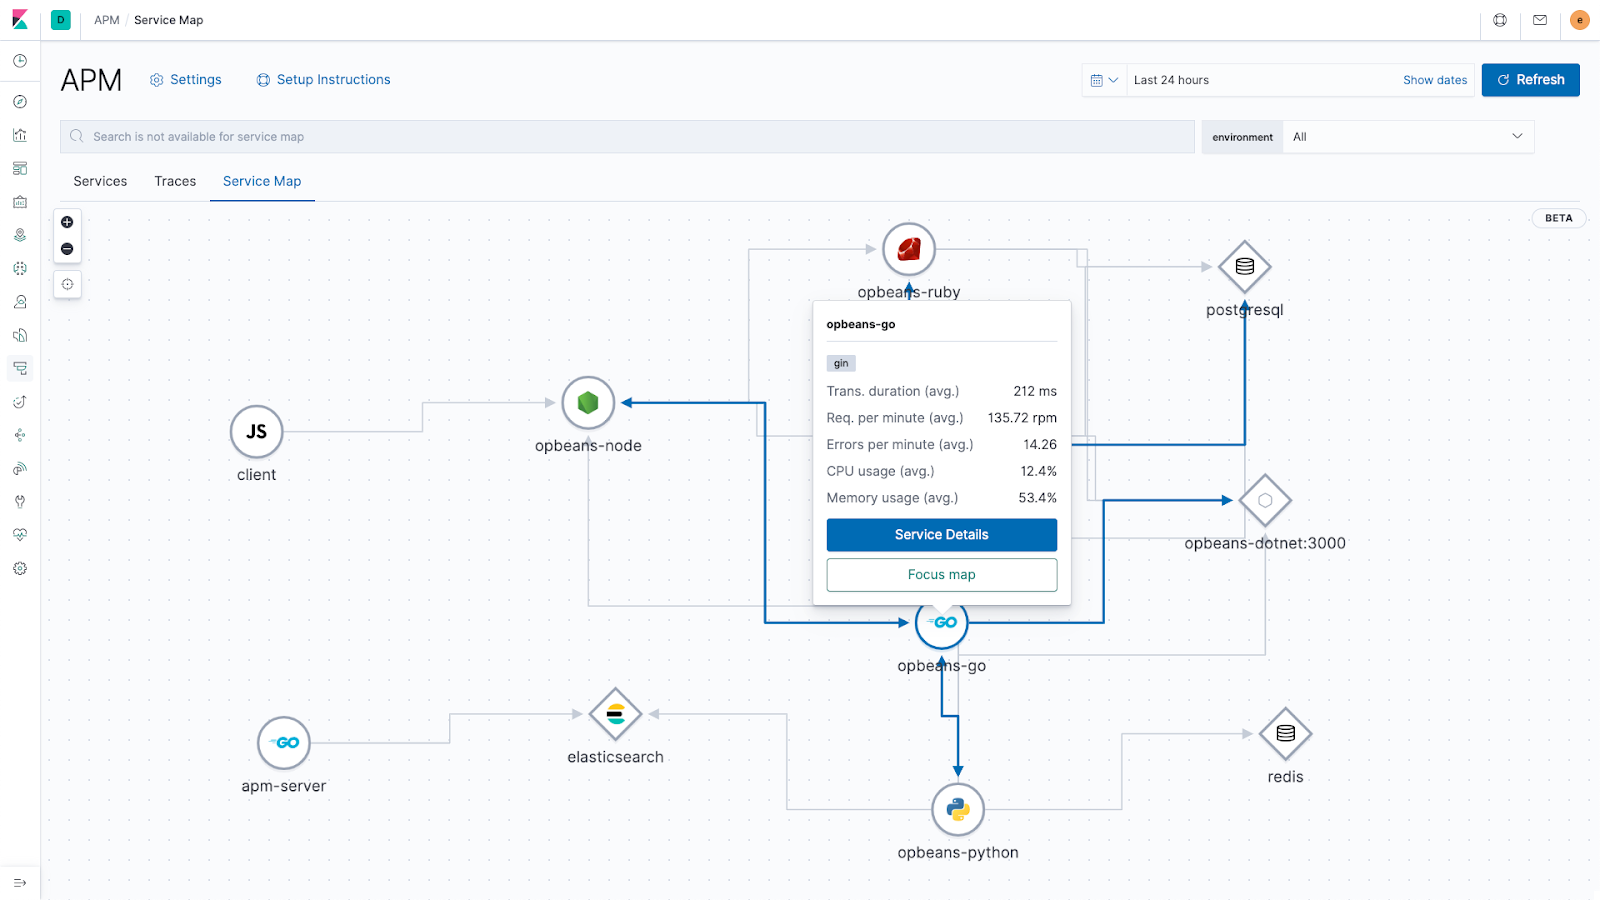
Elastic APM adds service maps, an easy way to visualize how the services powering an application are connected to each other. The service maps are automatically created by using live transaction data to build an aggregate view of service dependency mapping. And because the maps are dynamically created based on the live data, they serve as a real-time view of system dependencies, which speeds up troubleshooting issues, especially in today's distributed and ephemeral cloud-native environments.
A much requested feature, service maps complement the distributed tracing feature in Elastic APM. Distributed tracing provides a waterfall view of individual service calls for a specific transaction, while service maps provide a more aggregate view of how services talk to each other.
The service map also bubbles up high-level service information, and the users can easily go from the high-level view to the details of a particular service as a part of their investigative workflows.
The best part? As long as you're running recent versions of Elastic APM agents, service maps will just work. Service maps are available as a beta feature in version 7.7, and are available in the Platinum subscription tier.

Integrations! Integrations! Integrations!
If we were to summarize the Observability 7.7 release in one word, it would be integrations! Elastic Observability adds several new out-of-the-box integrations to collect logs and metrics from many common data sources across the infrastructure ecosystem.
Instrumentation is a big part of building observable systems. When something goes wrong, well-instrumented systems ensure that you have all the data you need to quickly detect and fix the system component that caused the failure. The Elastic Observability team has been on a relentless mission to simplify instrumentation by providing turnkey integrations across all layers of the technology stack. No matter what technologies make up your application or infrastructure, we want to make collecting the logs and metrics from all layers ridiculously simple.
The mission continues in 7.7 with the addition of several new key integrations:
- Prometheus is an open source monitoring solution built primarily for collecting metrics but lacks the necessary capabilities required for the enterprise. Elastic Observability 7.7 brings enterprise-grade capabilities to Prometheus monitoring that include unified observability with Logs, APM, and Uptime metrics, enterprise-grade security and scalability provided by the Elastic Stack, and long-term storage of Prometheus data
- Our cloud (AWS, GCP, Azure) monitoring story continues to expand in 7.7, with the addition of several new integrations for AWS, GCP, and Azure services. These include support for monitoring Lambda functions, Virtual Private Cloud (VPC), DynamoDB and Aurora DB in AWS, Pub/Sub and Load Balancing in GCP, and Azure container and database services.
- Pivotal Cloud Foundry (PCF) is a popular cloud-agnostic Platform-as-a-Service solution. The highly requested PCF integration connects to the PCF's loggregator API and pulls container, counter, and value metrics from it into Elasticsearch.
- Istio is an open source service mesh, popular in the Kubernetes ecosystem, that provides the fundamentals required to successfully run a distributed microservice architecture. The new Istio integration will allow users to see metrics for service traffic in, out, and within a service mesh, control-plane metrics for Istio's Pilot, Galley, Mixer components, and much more.
- MQTT is a lightweight machine-to-machine messaging protocol that is very popular for streaming data in the IoT space due to its low bandwidth and lightweight nature. With the MQTT input, users can now stream data from the MQTT broker into Elasticsearch more easily.
Get started today
Want to give Elastic Observability 7.7 a spin? Check out our latest version with a free 14-day trial of our Elasticsearch Service on Elastic Cloud or install the latest version of the Elastic Stack.
Related blogs


