


Elastic Infrastructure 7.0 released
Some call it "monitoring", some call it "KPI tracking", and others just say "meeting our SLAs". Whatever you call it, knowing what is going on inside your systems is crucial. Here at Elastic, we call it "observability", and we truly believe in its significance. The ability to see what is going on in your entire application stack — from the base infrastructure all the way down to the code — lets you find and fix those little "gotchas" faster. There are a LOT of moving parts. Load-balancing reverse-proxy servers, dynamically scaling REST endpoints, databases, key-value stores, even serverless functions spun up on demand. You need to monitor ALL of it, because the piece that you don't is likely the one that will break (been there, done that).
Increasing visibility with Elastic Stack 7.0
The 6.7 release of the Elastic Stack was a big one, especially when looking at it through the observability looking glass. The Logging and Infrastructure UIs both went GA, sporting new tooling for configuration, drill down, and grouping. A couple of new modules were released, and several more were promoted to "generally available". After all, to "observe" it, you have to capture it.
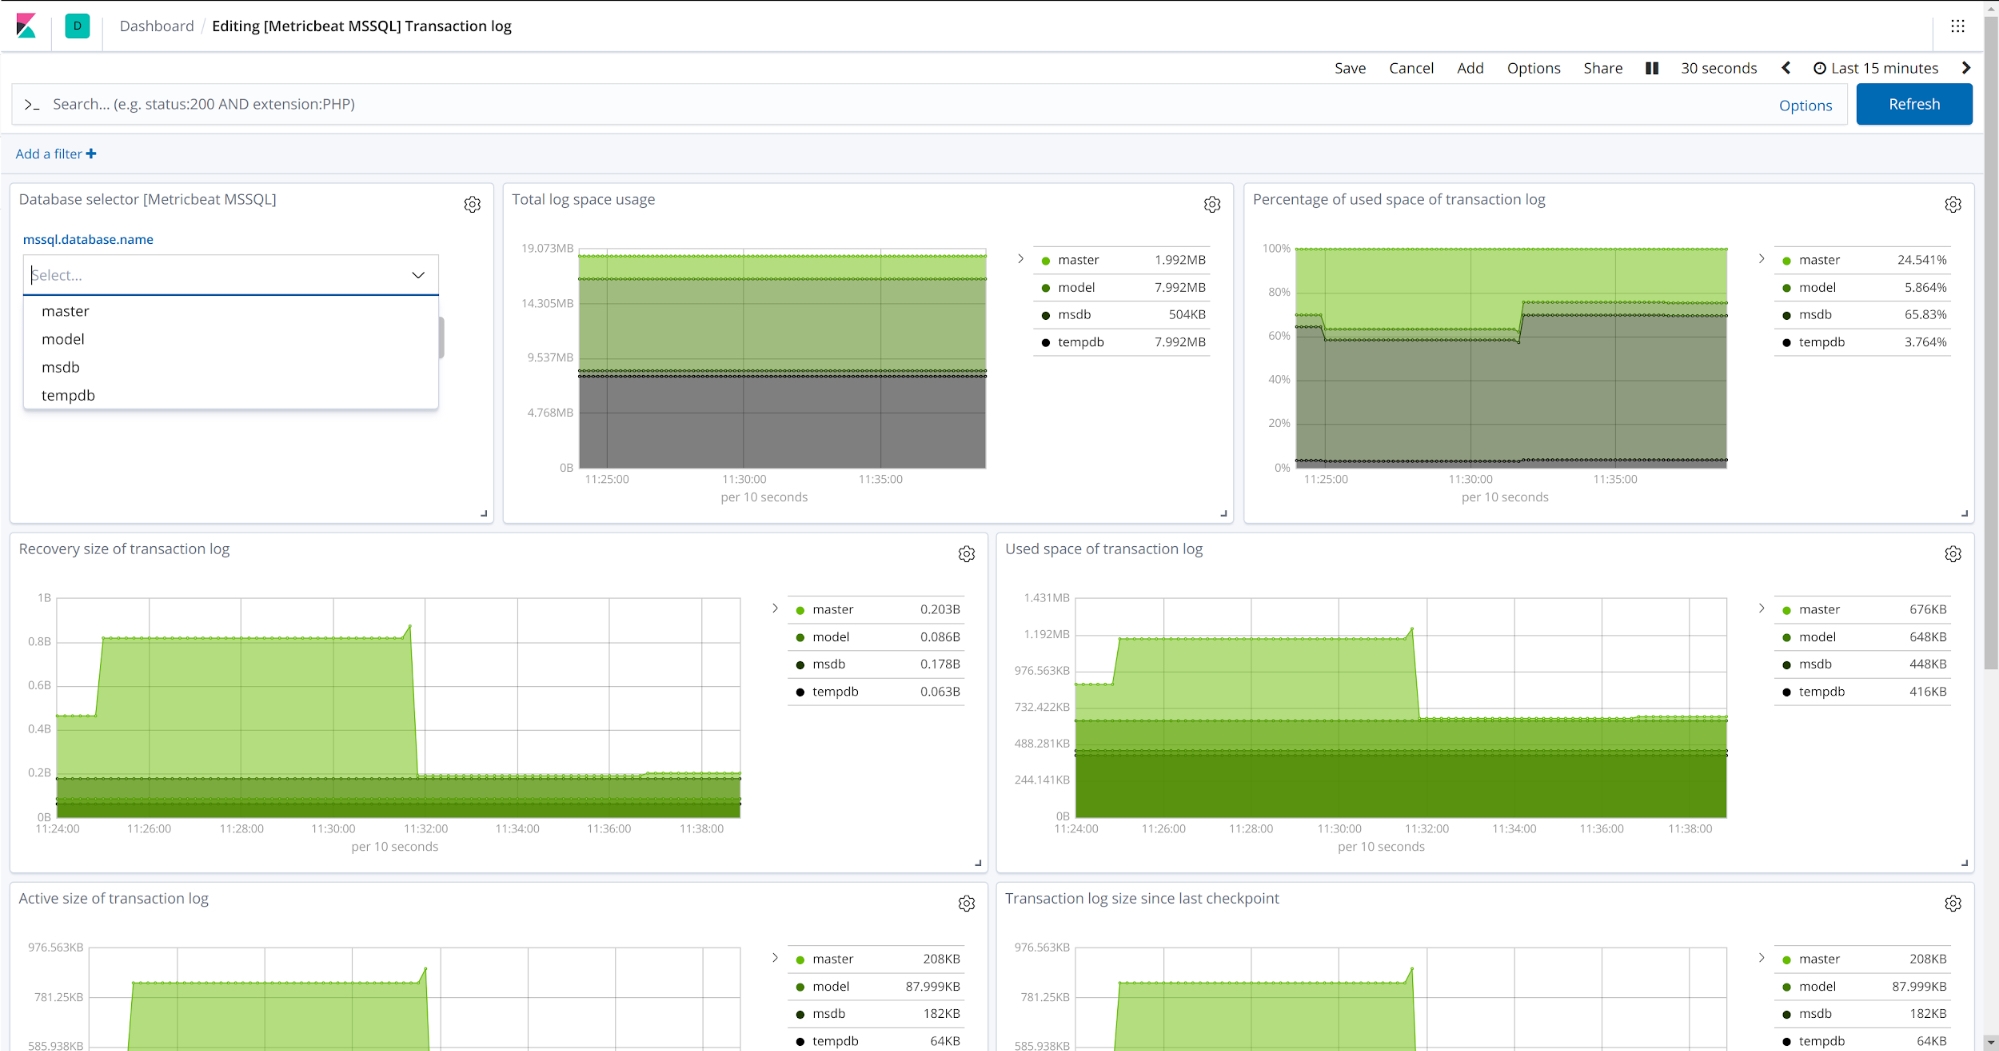
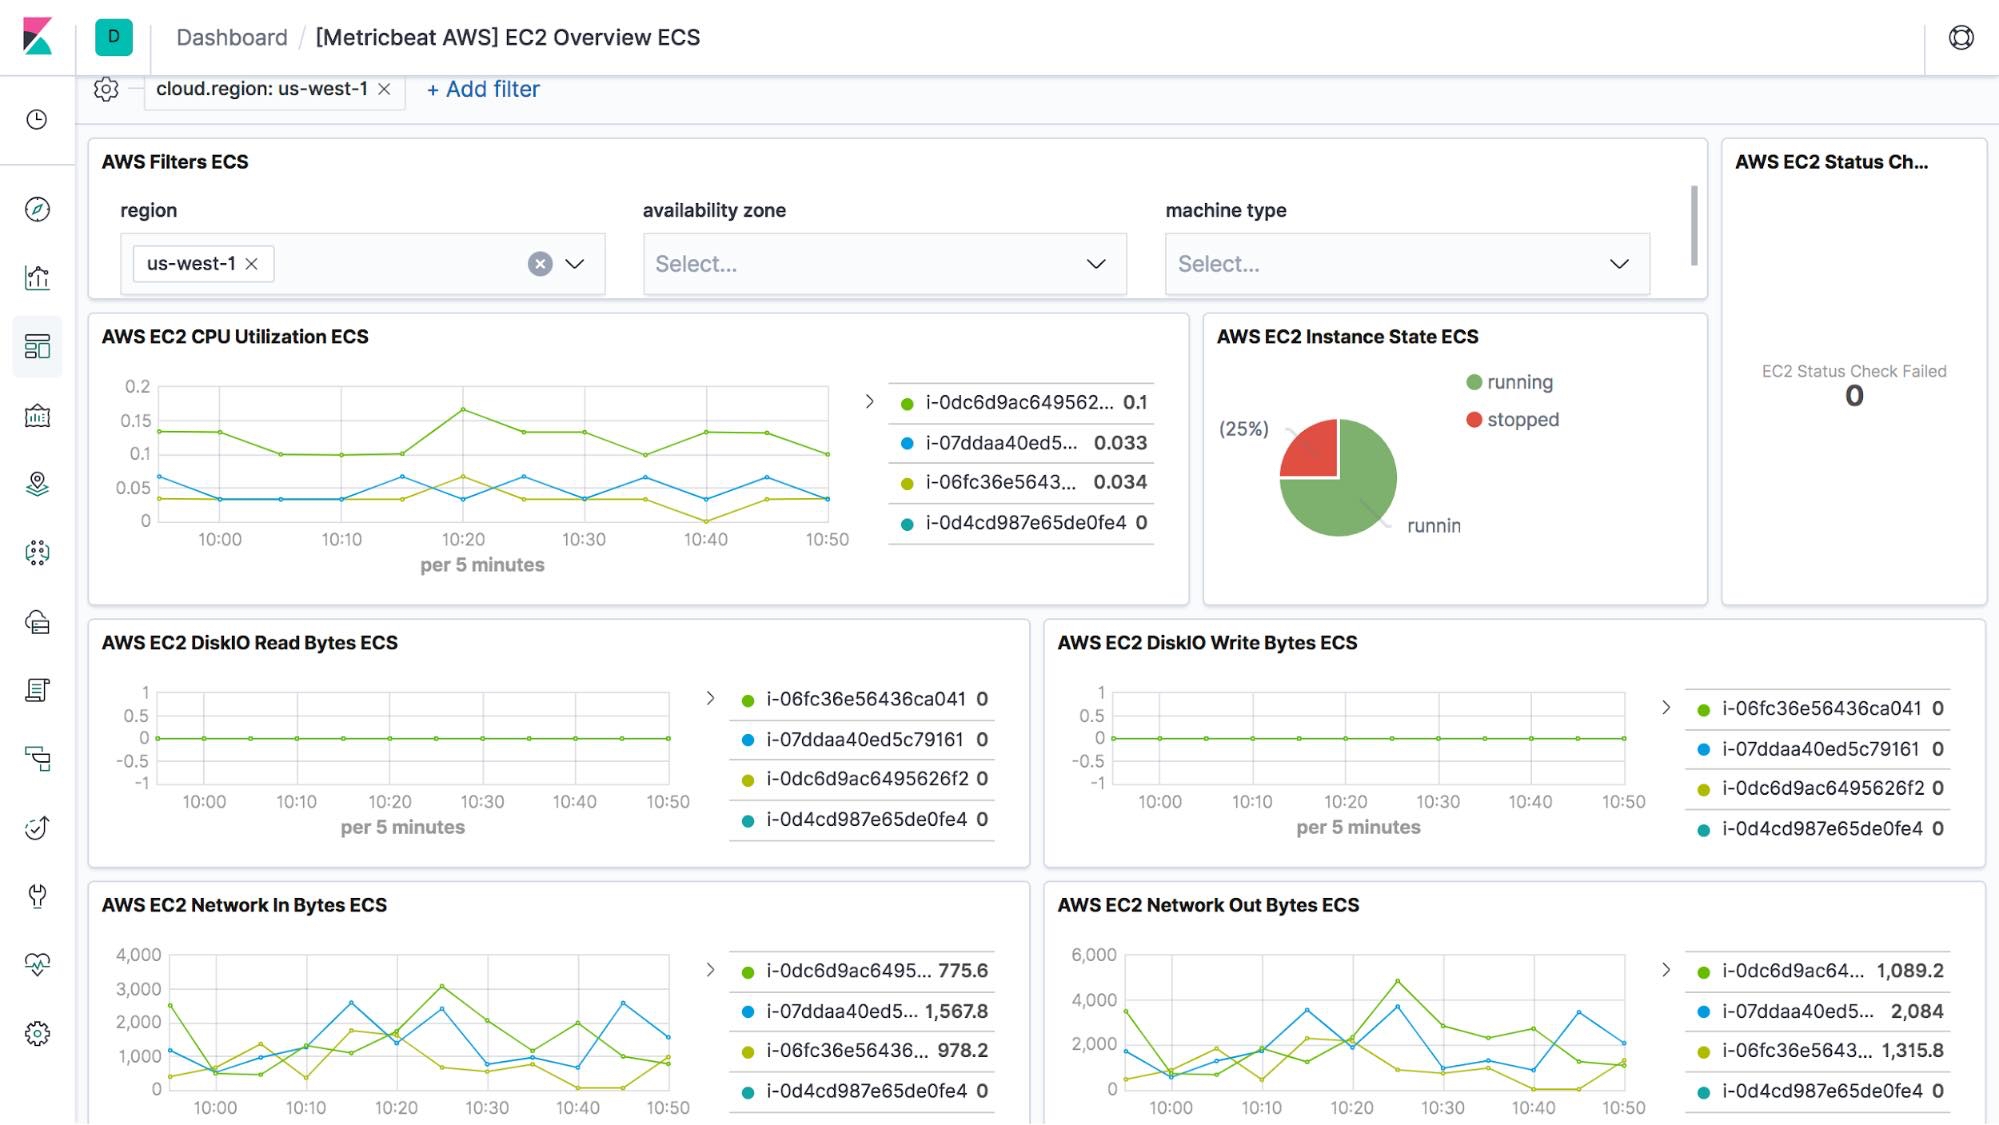
With the 7.0 release of Elastic Stack we continue that trend by releasing four new modules — the NATS module for capturing metrics from the high-performance, open source messaging system popular in Kubernetes and Cloud Foundry deployments, a Microsoft SQL Server module (beta), with metricsets for the transaction log and performance counters, a CouchDB module with a server metricset, and the highly requested AWS EC2 module, which collects and centralizes basic resource utilization metrics from all your EC2 instances, directly from Cloudwatch.
Using modules
Setting up modules is very straightforward, as seen in this video showing how to set up and use the new AWS module for Metricbeat.
Big on Prometheus
Not the Prometheus that stole fire from the gods and gave it to humanity (thanks for that, by the way), but rather the Cloud Native Computing Foundation (CNCF) "graduated" project for monitoring and alerting time-series metrics. With 7.0 comes some big improvements to the Prometheus module, including a refactoring in the way we store Prometheus metrics. Now, all metrics are stored in Elasticsearch in the same format they are captured by Prometheus: as doubles. Furthermore, a restructuring of fields and labels has made it so these mappings can no longer collide, which allowed us to remove the namespacing, and the chance for mapping explosion along with it. Now the mappings will be right, without the need for custom fields.yml files or index templates, and the metric names will be the very same that you will find in the Prometheus server. Now, with the Prometheus module, you can compare, contrast, and correlate your Prometheus time-series metrics alongside your logs, application traces, infrastructure metrics, and business data, all under one roof: the Elastic Stack. To learn more about configuring and using the Prometheus module, check out our blog on Elasticsearch Observability: Embracing Prometheus and OpenMetrics Standards for Metrics.
What's in a name?
Quite a lot, actually. Across different services of completely different types — you can be tracking infrastructure components like servers or Kubernetes, or common services like Kafka or Nginx — the metricsets from these can be completely unrelated, but still share some fundamental similarities. What host is it on? What is the process name? Where is the container running? When these common concepts are stored in different fields it makes it considerably more difficult to find the root cause of a problem. Tracking down slow response times from the aforementioned Kafka and Nginx servers is much easier when you can see that they are running on the same Kubernetes node.
That's where the Elastic Common Schema (ECS) comes in. ECS was designed to support uniform data modeling, enabling you to centrally analyze data from diverse sources with both interactive and automated techniques. It defines a purpose-built taxonomy that is adaptable to both common and custom use cases.
With that, we are happy to report that in 7.0, all officially supported Beats now adhere to ECS naming conventions. Now, regardless of the Beat being used, you will know exactly where a specific log or metric came from, and you will know exactly which fields to look at to find it. This makes correlation and comparison so much easier that you will find yourself quickly compiling custom dashboard and Canvas mash-ups that tell the story of your data. After all, it's your data that you care about. Well that, and maybe the outcome of your NCAA brackets, but that ship has sailed.
Observing your entire application stack
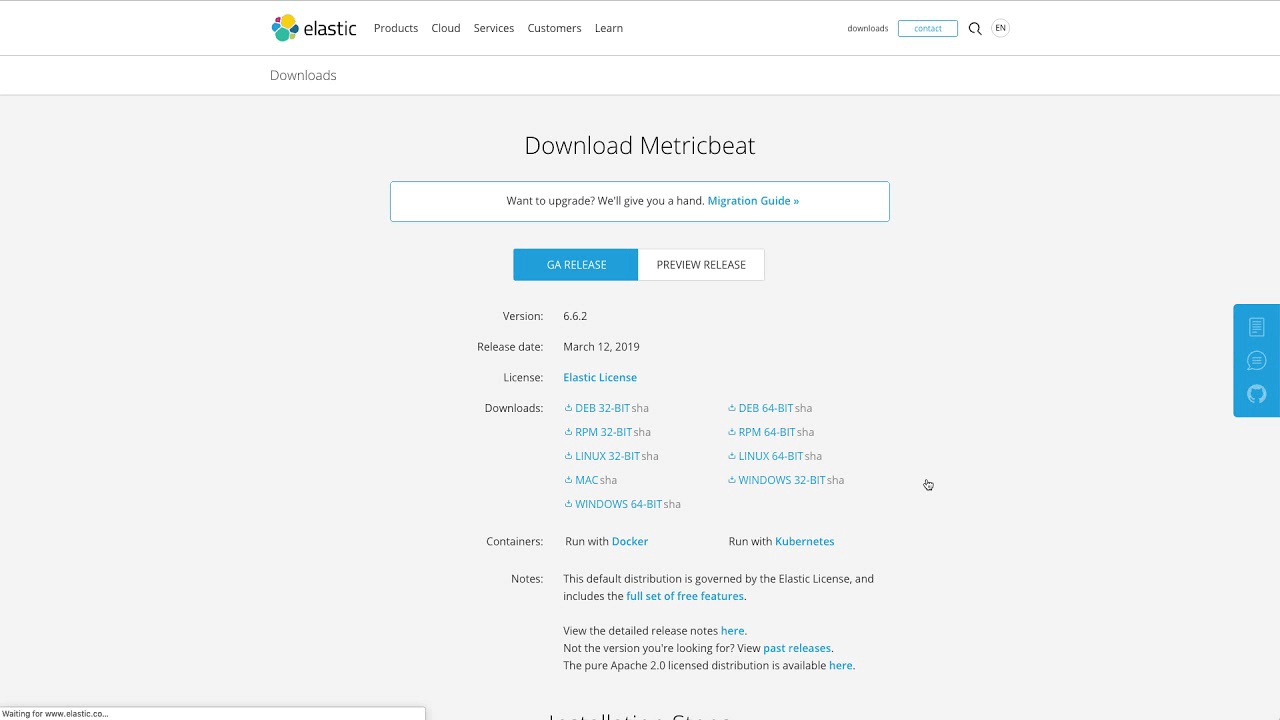
With the new and existing modules for logging and metrics, Elastic APM, Elastic Infrastructure, and Elastic Uptime, the Elastic Stack has what you need to monitor your entire application stack — from the bits and bytes of code, all the way down to the hardware and networks that they run on. Download and spin up a cluster on prem, or start with a free trial of Elasticsearch Service on Elastic Cloud, and start seeing what's going on in your environment.