


Understanding and unlocking security data sources
Security information and event management (SIEM) systems are centralized log platforms to analyze event data in real time for early detection of targeted cyber attacks and data breaches. A SIEM is used as a tool to collect, store, investigate, and report on log data for threat detection, incident response, forensics, and regulatory compliance.
Log collection is the lifeblood of SIEMs and other security analytics technologies. Application data, network traffic, and endpoint data tells us interesting information about our infrastructure. The more data sources that are available, the more that can be accomplished with security analytics. With all the available log sources, long gone are the days of speaking in terms of gigabytes of data — companies today are now regularly working with terabytes and petabytes.
Scaling and native distributed architecture are key when handling an explosion in data. These traits also happen to be two of the core values of Elasticsearch. In this blog post, we’ll explore how to understand data sources relevant to security analytics and how to bring them into the Elastic Stack.
As a note to the reader, the details shown here are intended only as a baseline guide to begin data collection for security analytics.
Data collection and enrichment
Log collection depends on various use cases and infrastructure. Knowledge of your network is important to decide on log collection scope and volume. It’s best to begin by understanding your IT network infrastructure. In any use case, you’ll need some sort of ingest mechanism.
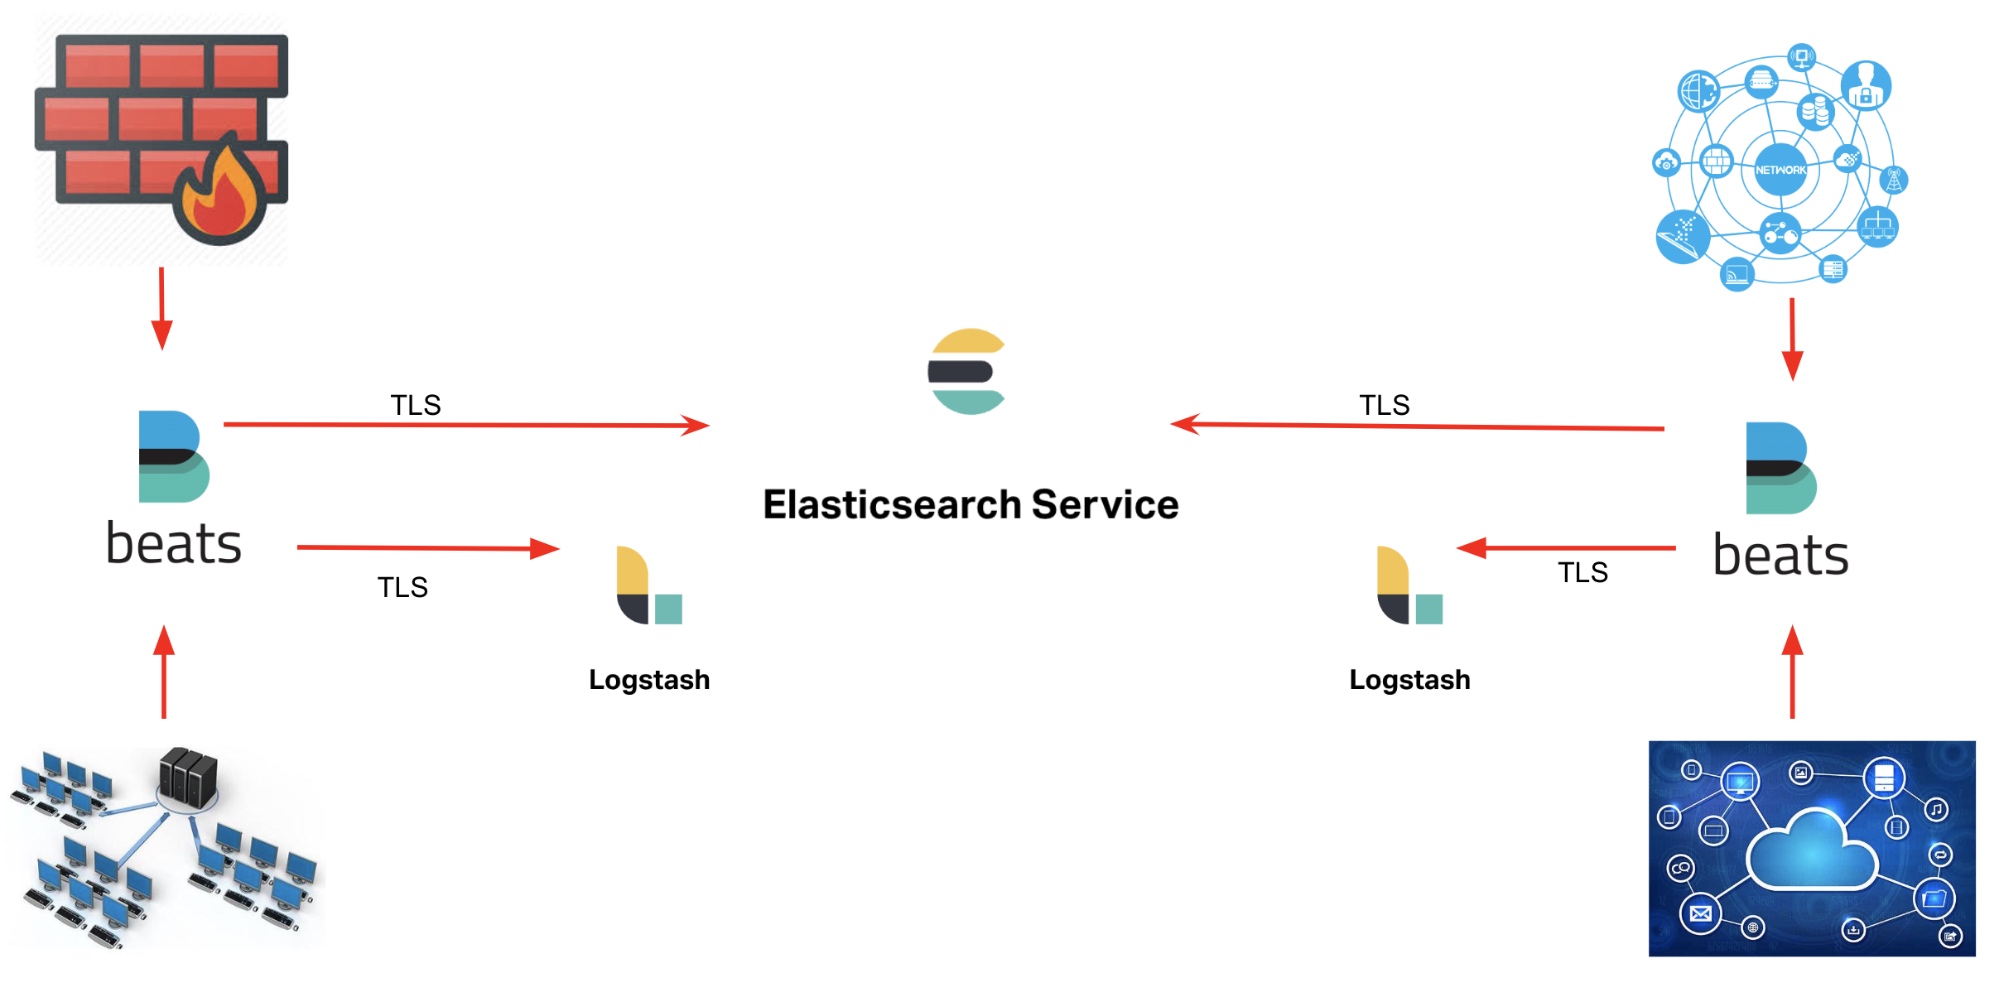
With the Elastic Stack, Beats and Logstash comprise the ingest layer to perform data collection and enrichment.
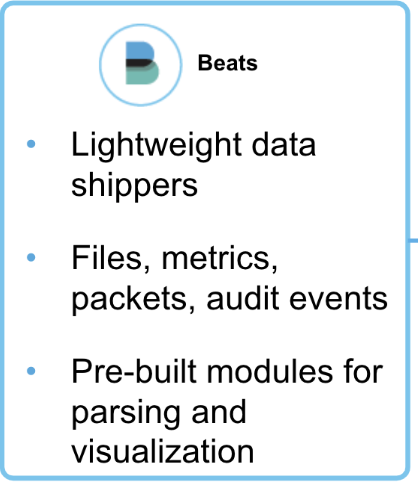
Beats
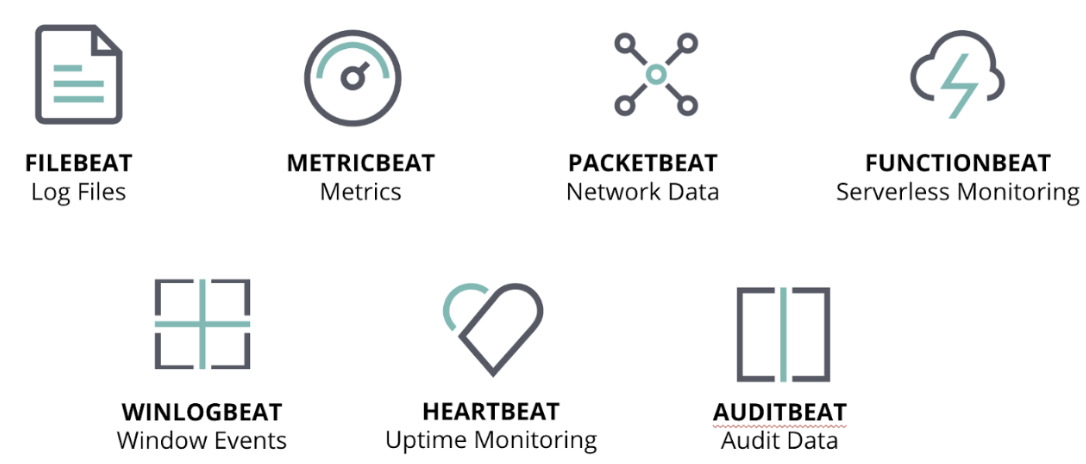
Beats are lightweight data shippers that address various data collection requirements such as file-based logs, metrics, network packets, cloud infrastructure, and Windows and Linux events. Beat modules are regularly developed to simplify data collection and provide pre-built data enrichment, dashboards, and machine learning jobs.
We’ll discuss the various Beats and what they can be used for, but for now, know that these modules can be centrally defined and managed using Beats central management. You can also quickly deploy configuration changes to all Beats running across your enterprise through this management platform.
Beats can ship data directly to an ingest node in Elasticsearch. In some cases, Logstash is used separately or alongside beats as an extract, transform, load (ETL) tool for log collection and enrichment.
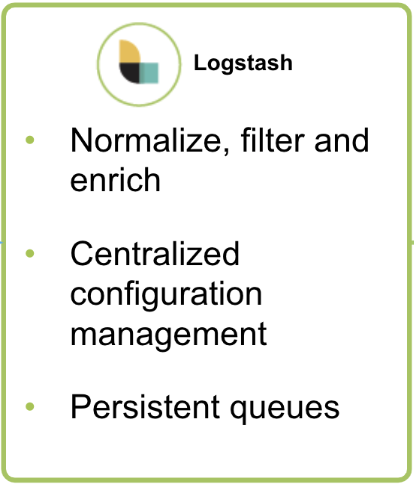
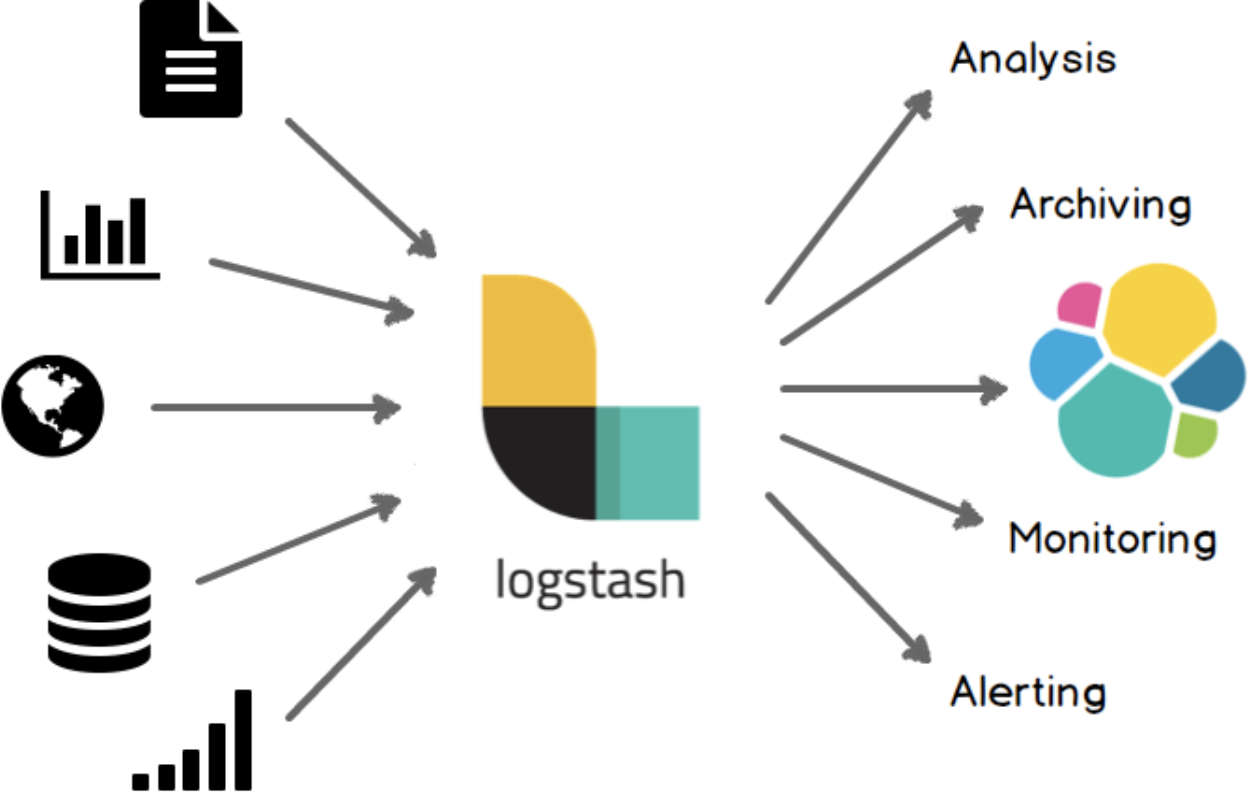
Logstash
Logstash is an open source data collection engine with real-time pipelining capabilities. It can dynamically unify data from disparate sources and normalize the data. Any type of event can be enriched and transformed. Many native codecs are supported with Logstash inputs, further simplifying the ingestion process.
Multiple Logstash configurations can also be managed using centralized pipeline management, which centralizes the creation and management of Logstash configuration pipelines.
Log enrichment is the process of adding additional information and analytical values to the logs collected. A few examples:
- Geo-location belonging to an IP address
- Threat intel lookup [IOC - indicators of compromise]
- Tracking asset ownership
- Tagging asset severity
- Tagging with vulnerability status reports
- Correlating email address with users
Such enrichments can be performed during data collection using Logstash plugins or Beats processors.
Beats or Logstash? The choice is not always one over the other, as they may be used together or in parallel for different parts of the data processing and use cases.
Types of data sources
Your environment has numerous data sources and organizations are sometimes tempted to deem everything a top priority — but where to begin? Here are some common data sources to consider collecting to enable security analytics:
Network infrastructure
The following technologies provide information about activity in your environment, with collection typically performed via native log collection or sniffing through a TAP or SPAN port.
- Routers
- Switches
- Domain controllers
- DNS traffic
- Wireless access points
- Application servers
- Databases
- Intranet applications
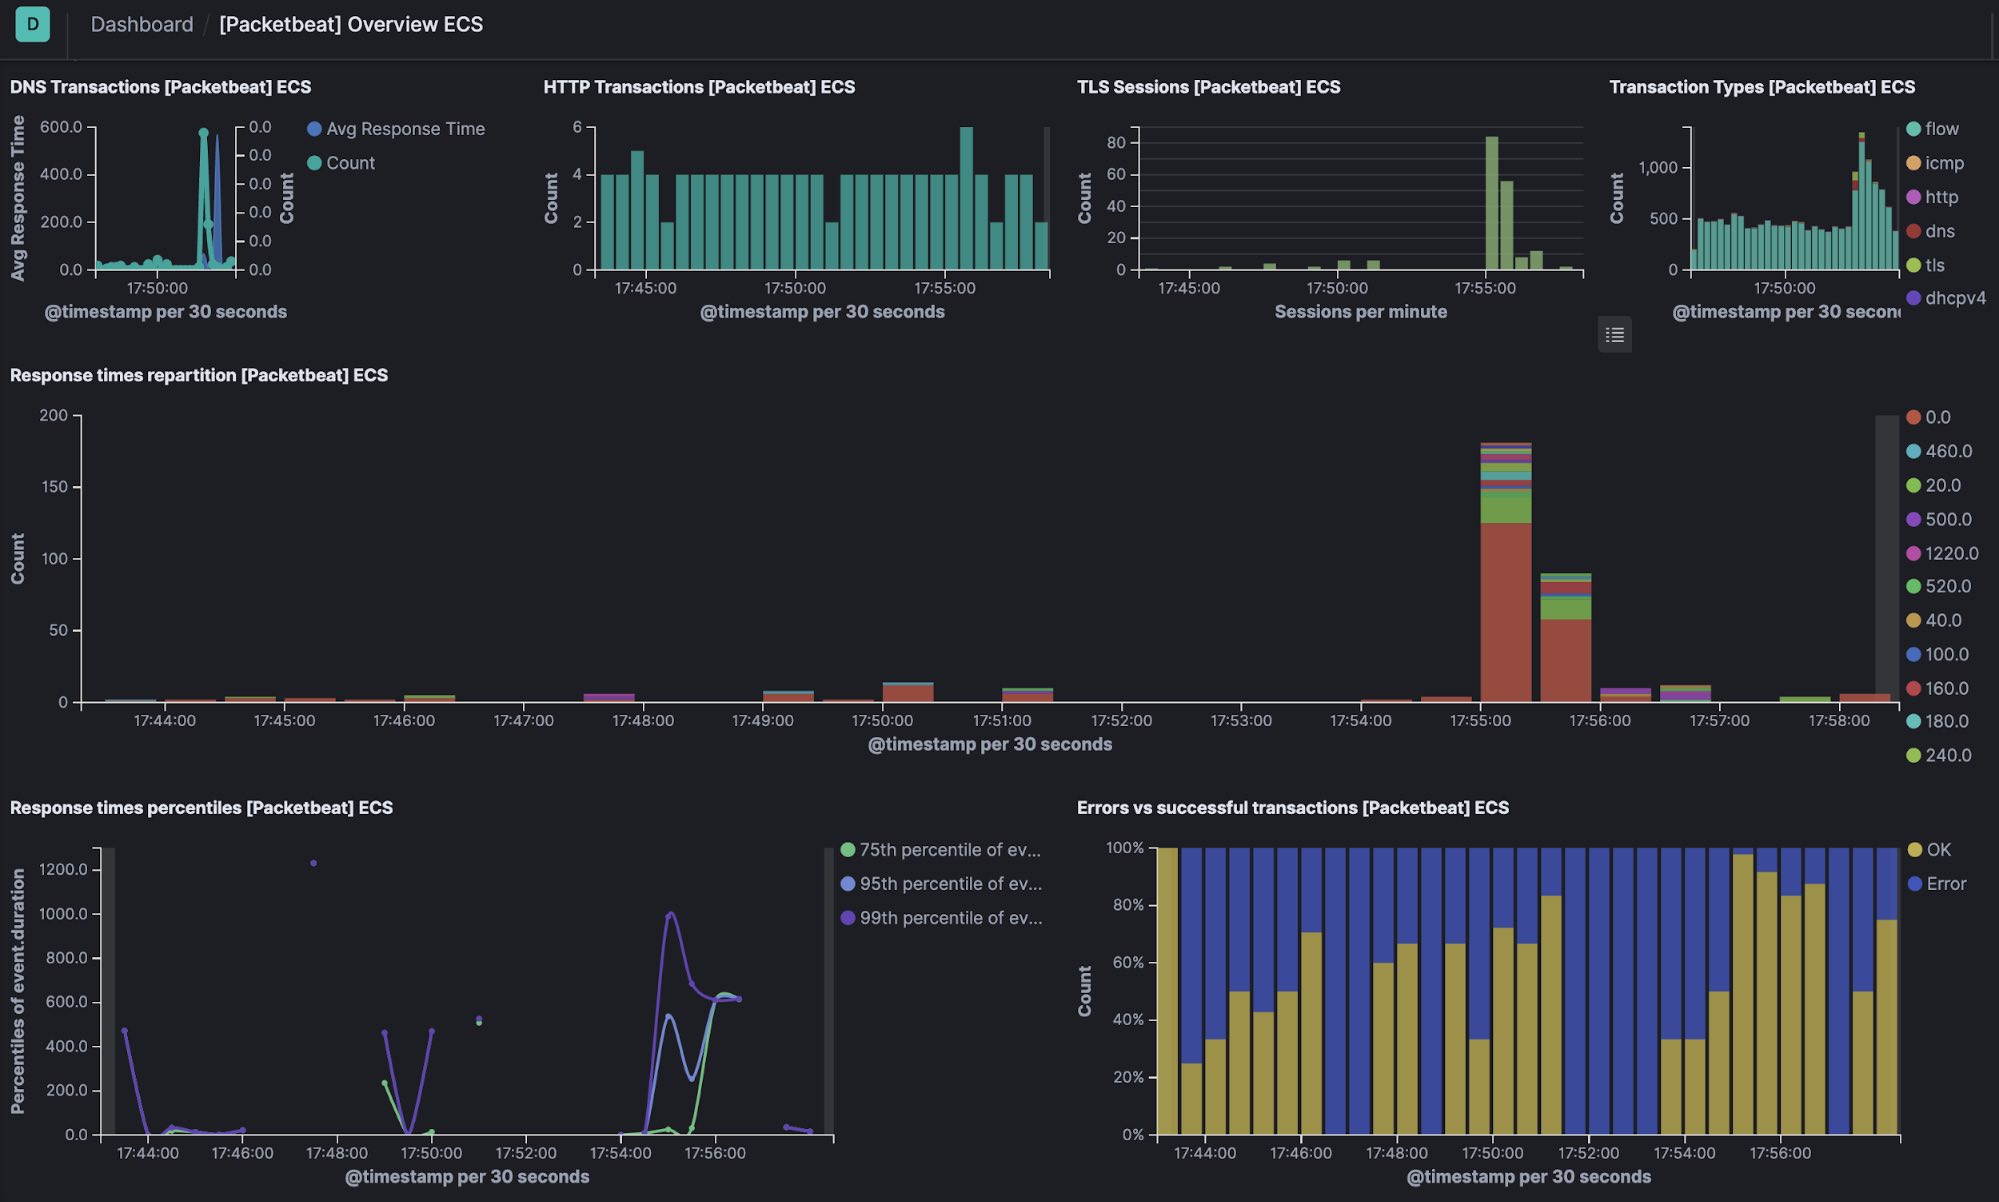
Packetbeat captures insights from network packets — parsing application-level protocols on the fly — and processes messages into transactions. Packetbeat supports flows, DNS, and other protocols.
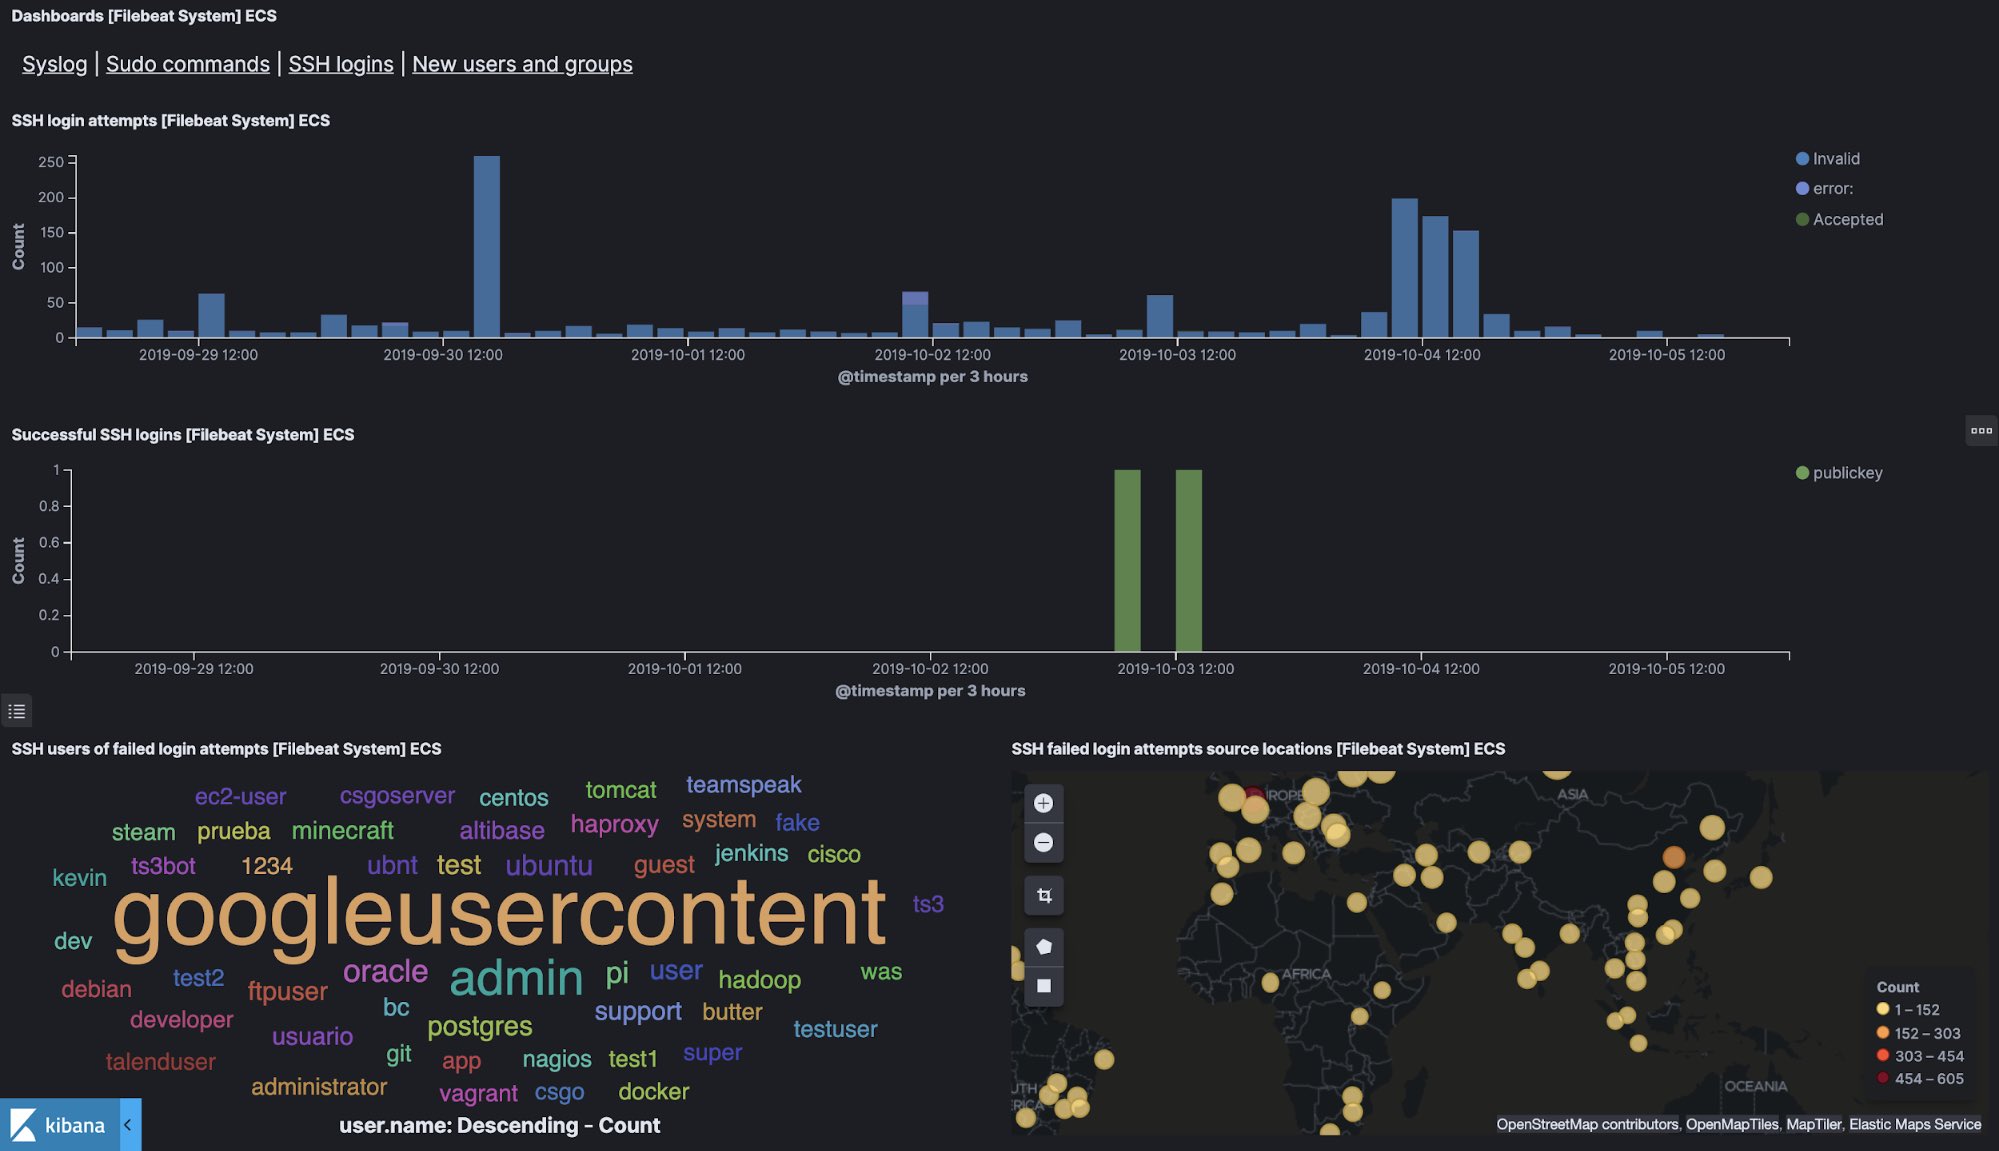
Filebeat monitors and collects the log files or locations that you specify. Filebeat modules simplify the collection, parsing, and visualization of common log formats such as CISCO, Palo Alto Networks, Suricata IDS, Ubiquiti IPTables, and Zeek (Bro).
Security devices
Logs from your security control (applications used for securing your infrastructure) are valuable for the analysis of events for automated threat detection and proactive hunting:
- IDS/IPS (Intrusion detection/prevention system)
- Firewalls
- Endpoint security (antivirus, anti-malware)
- Data loss prevention (DLP)
- VPN Concentrators
- Web filters
- Honeypots
Most of these technologies transmit data in syslog, which can be effectively collected, enriched, and transformed with Logstash or Filebeat.
Host events and server logs
There are hundreds of thousands of events that can trigger within operating systems and their associated applications can generate tens of thousands of unique events. Understanding the log events that are most vital is integral for effective monitoring and prioritization.
Windows monitoring
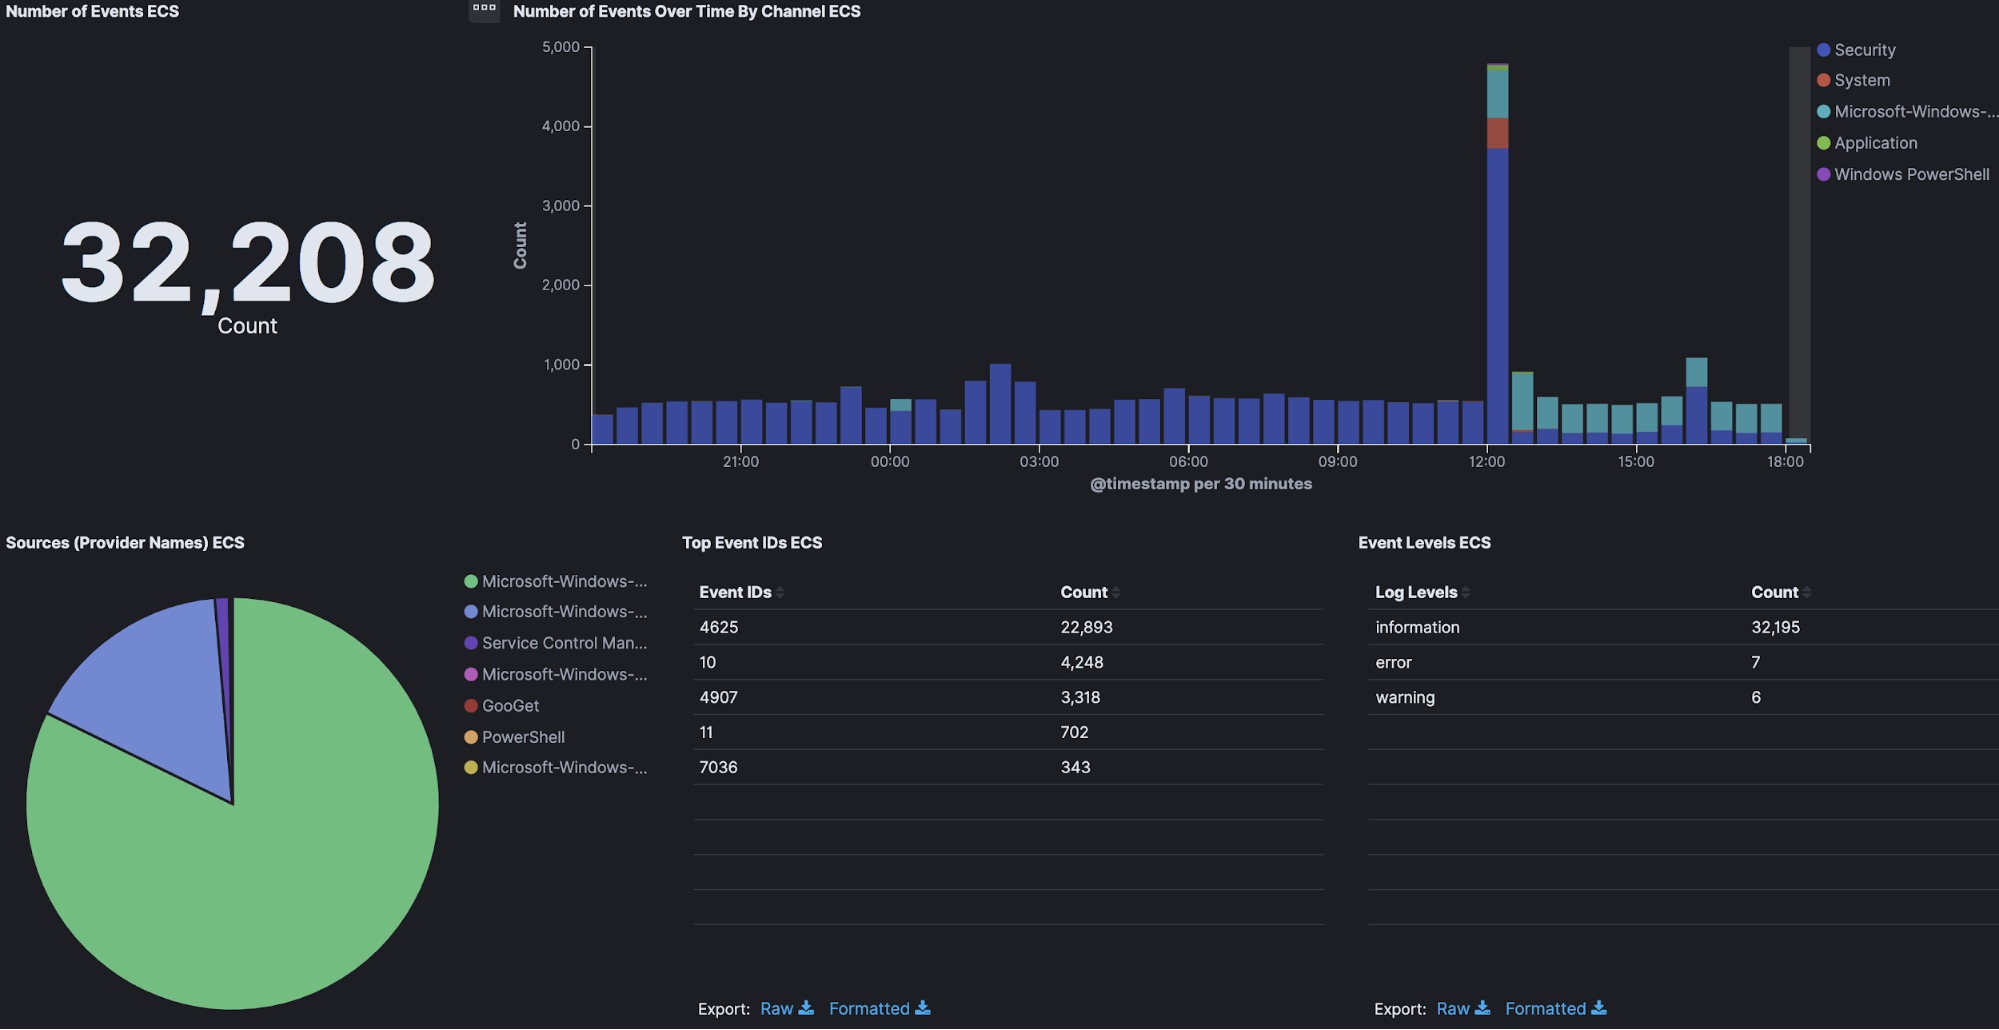
Windows log events provide significant insight on OS- and application-level security details within the host. Windows tracks specific events in its log files with an Event ID for each type of event that can help identify concerning cyber activity.
Winlogbeat is installed as a Windows service and ships Windows event logs with pre-built monitoring dashboards and machine learning jobs. Winlogbeat can capture event data from any event logs running on your system — security, application, hardware, Powershell, and Sysmon events.
Sysmon is an open source Windows system service and device driver developed by Microsoft that provides detailed information about process creations, network connections, and changes to file creation time. Augmenting Sysmon with Windows security events helps advance threat hunting use cases.
The following tables list Windows and Sysmon events that are often associated with malicious activity.
Windows event ID | Potential criticality | Event summary |
4618 | High | A monitored security event pattern has occurred |
4649 | High | A replay attack was detected — may be a harmless false positive due to misconfiguration errors |
4719 | High | System audit policy was changed |
4765 | High | SID History was added to an account |
4766 | High | An attempt to add SID History to an account failed |
4794 | High | An attempt was made to set the Directory Services Restore Mode |
4897 | High | Role separation enabled |
4964 | High | Special groups have been assigned to a new logon |
5124 | High | A security setting was updated on the OCSP Responder Service |
1102 | Medium to High | The audit log was cleared |
Microsoft has a complete list of Event IDs to monitor that can be enabled based on the need and requirement.
Sysmon events
Event class | Event IDs | Importance |
Process Create | 1 | Detect initial infection and malware child processes and provide ability to investigate hashes captured by the Sysmon module with VirusTotal.com |
Process Terminate | 2 | Useful for forensic investigations. May be correlated with process creation events |
Drive Load | 6 | Detect device drivers loading |
Image Load | 7 | Detect DLL injection, unsigned DLL loading |
File Creation Time Changed | 2 | Detect anti-forensic activity (timestamp changed to cover tracks) |
Network Connection | 3 | Identify network activity, connection to malware C&C servers, connection to ransomware server to download encryption keys |
CreateRemoteThread | 8 | Detect code injections used by malware; Credential theft tools also use this technique to inject code into the LSASS process |
RawAccessRead | 9 | Detect dropping off SAM or NTDS.DIT from compromised hosts |
Linux monitoring
Auditbeat is a lightweight data shipper to collect and centralize audit events from the Linux Audit Framework. Audibeat does the same thing as auditd itself.
Auditbeat file integrity monitoring (FIM) and System module can run on any OS (Linux, macOS, Windows) and are used to collect and monitor packages, processes, logins, sockets, users, and groups.
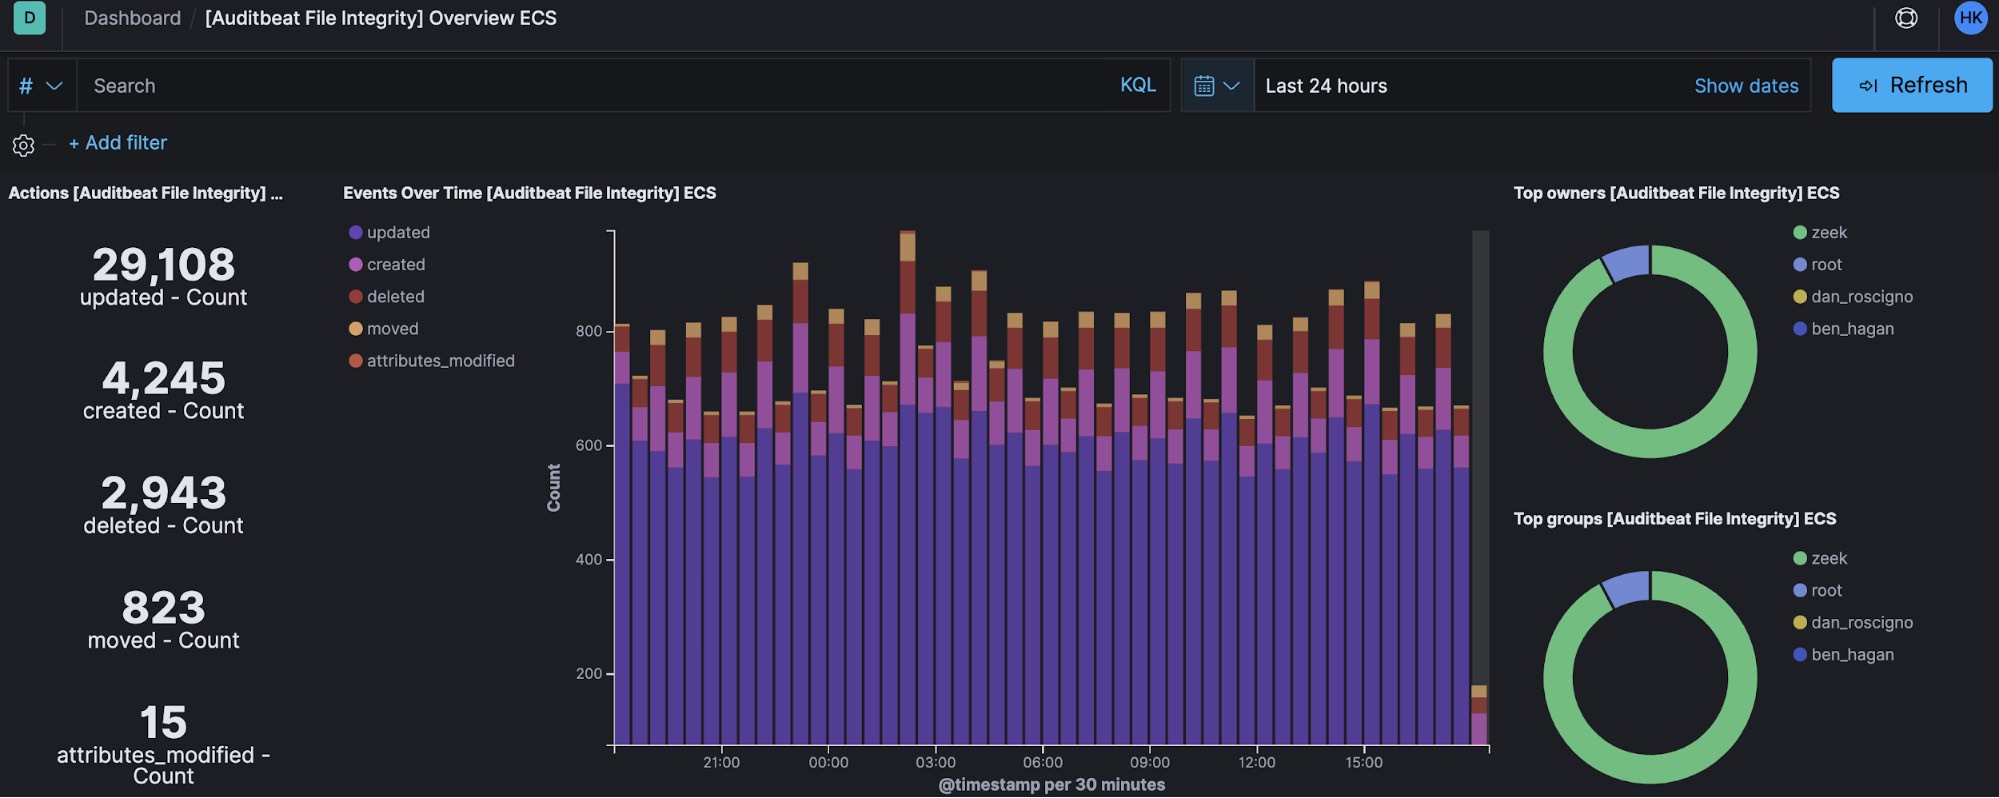
Linux systems can be ingested into the Elastic Stack in support of security use cases. The following table lists several security-relevant Linux log files to collect with Filebeat or Auditbeat in support of security monitoring.
Log path | Details | Use case |
/var/log/auth.log (Debian) /var/log/secure (Centos) | Authentication-related events | Brute-force attacks and other vulnerabilities related to user authorization mechanism |
/var/log/boot.log | Booting-related information | Issues related to improper shutdown, unplanned reboots or booting failures |
/var/log/dmesg | Kernel ring buffer messages | Monitoring server functionality |
/var/log/faillog | Information on failed login attempts | Security breaches involving username/password hacking and brute-force attacks |
/var/log/cron | Cron job information | To monitor errors or new cron schedule status |
/var/log/mail.log | Logs related to mail server | Trace headers of email and monitoring possible spamming attempts |
var/log/httpd/ | Logs recorded by the Apache server | Log to monitor for apache web server and httpd errors |
/var/log/mysql.log (debian) /var/log/mysqld.log (centos) | MySQL log files | Monitor events related to mysql service |
Cloud infrastructure
Collecting data from cloud servers and services enables many important security use cases. Security-relevant cloud datasets include metrics, traffic from virtual networks, cloud storage, application logs, and audit trails. Together, this data provides a detailed view of your cloud infrastructure.
Functionbeat is a data shipper that runs on serverless architecture. Deploy it as a function in your serverless framework (e.g., AWS Lambda) to collect data from your cloud services.
The Elastic Stack as a central platform
Put as much security-relevant data in the Elastic Stack as possible — it can handle it. The more data your security practitioners have, the more security use cases they can address.
Elasticsearch can ingest almost any kind of data, including structured and unstructured text, flow data, metrics, geo points, and more. This enables organizations to ingest whatever data they need, regardless of the type or origin. And with Elastic SIEM, real-time access to log data allows you to filter and locate that one “needle in a haystack” event that could reveal the cause of a security breach.
It would be great if every data source recorded information, but unfortunately not all do. Elastic Common Schema (ECS) helps users address this issue by providing a set of fields to which diverse data sources can be applied, simplifying analysis. Beats supports ECS right out of the box and many of its modules include pre-built, ECS-enabled monitoring dashboards and machine learning jobs.
The Elastic SIEM app in Kibana, which provides an interactive workspace for security teams to triage events and perform initial investigations, is also enabled by ECS. Further, many new out-of-the-box machine learning rules (including those integrated with the SIEM app) apply ECS.
Wrapping up
Log collection from various data sources depends on the requirement of the organization. As a general practice, collection usually starts with logs from security controls that can provide an overall view of security posture and monitoring within the enterprise. From here, gradually increase your data collection with network infrastructure logs and host system events.
If you want to give it a try yourself, spin up a free, 14-day trial of Elasticsearch Service and start ingesting. Or explore and experience the Elastic Stack features in our live Demo environment with no configuration necessary.