


Introducing Kibana Lens: An easy, intuitive way to explore data
We’re excited to announce the arrival of Kibana Lens, a significant step forward in making data visualization and exploration with the Elastic Stack even easier and more intuitive.
Millions of people already use Kibana to visualize and interact with data in real time. With the initial beta launch of Kibana Lens, we’re introducing an easy and intuitive way to rapidly gain insight into your Elasticsearch data. Lens is focused on ease of use, visualization best practices, and flexibility. You can build a visualization simply by dragging and dropping a data field into a window, and the smart suggestions built into Lens provide you with new ways of visualizing your data — all while giving you the flexibility to change your mind and quickly switch between chart types and index patterns. With Lens, slicing and dicing through data in Kibana has never been simpler or more fun.
Kibana Lens is available for free to our users as a part of our default distribution. Lens is being introduced as a beta in the 7.5 release of the Elastic Stack and is available immediately on the Elasticsearch Service on Elastic Cloud, or for download.
A colorful visual journey
Kibana was originally built by engineers for engineers, getting its start as a UI for Elasticsearch developers. Soon, developers began using Kibana instead of the command line as a convenient way to view and search Elasticsearch data. Not long after that, we added visualizations and charts to Kibana, allowing users to aggregate and display data visually. Kibana quickly became popular with customers like Netflix, Uber, and Walmart for data visualization and exploration. Over the years, we’ve been inspired by our community to come up with more and more capabilities around data visualizations. We’ve focused our attention on the fundamental challenge of visualizing large amounts of data at scale.
As people started adopting Elasticsearch and Kibana for more and more use cases, Kibana has been introduced to new types of users, including engineers, developers, analysts, executives, and data scientists, many of whom are using Kibana on a daily basis. This is our next area of focus — making Kibana easier to use for a broader audience.
Around two years ago, we started looking into how we could help more users explore their data. We realized we needed to apply the years of knowledge we had gained working on data visualizations and talking to users to build something new and do it right. This project needed to allow us to move faster, support more chart types, and combine data from multiple index patterns in a single visualization, all while providing an elevated user experience.
While building this completely new infrastructure, we spent a year exploring many of the data visualization challenges that users face, as well as the solutions that are out there. We interviewed dozens of companies that are using Kibana and other tools for a wide range of scenarios to identify the ways these companies are using their data and the challenges they are facing.
Kibana Lens is our next step on this journey: a completely new user experience that is simple and intuitive while still allowing users to perform powerful analyses on huge data volumes in real time.
Welcome, Kibana Lens
Lens makes it easy for Kibana users to start exploring their data while switching between multiple charts and functions for analysis across multiple dimensions. Lens removes the need to understand complex Elasticsearch terminology in favor of a simplified user interface that everyone can use. Any Kibana user can start gaining insights from their data by simply dragging and dropping fields and seeing a preview of their visualization, then leveraging smart suggestions from Lens to explore other possible visualizations and pick the right one.
Based on our years of watching people explore data within the Elastic Stack, we built Lens around four simple yet powerful concepts.
Data driven
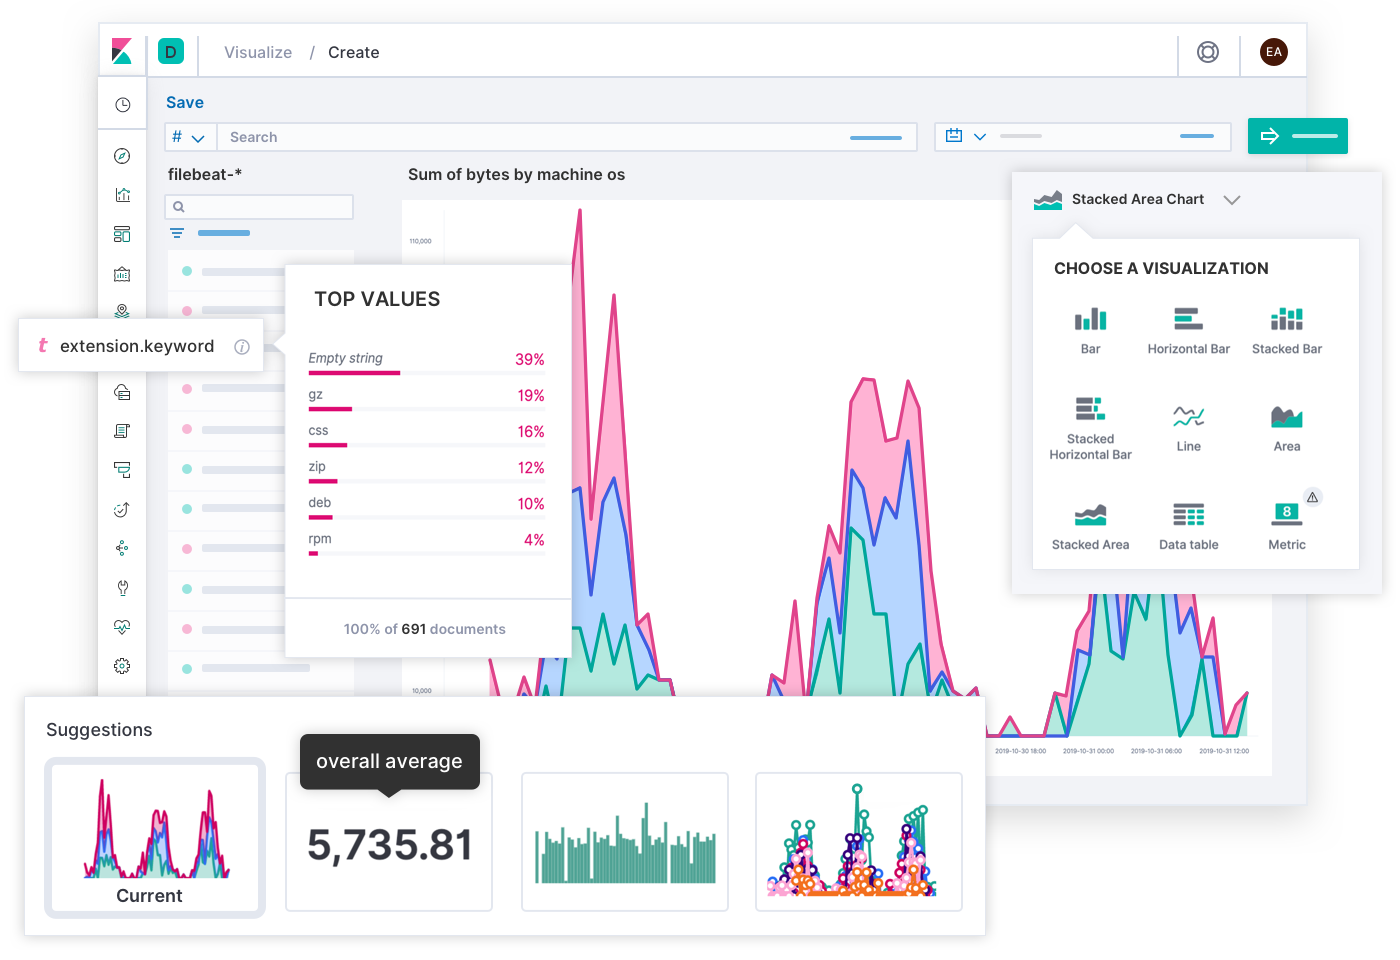
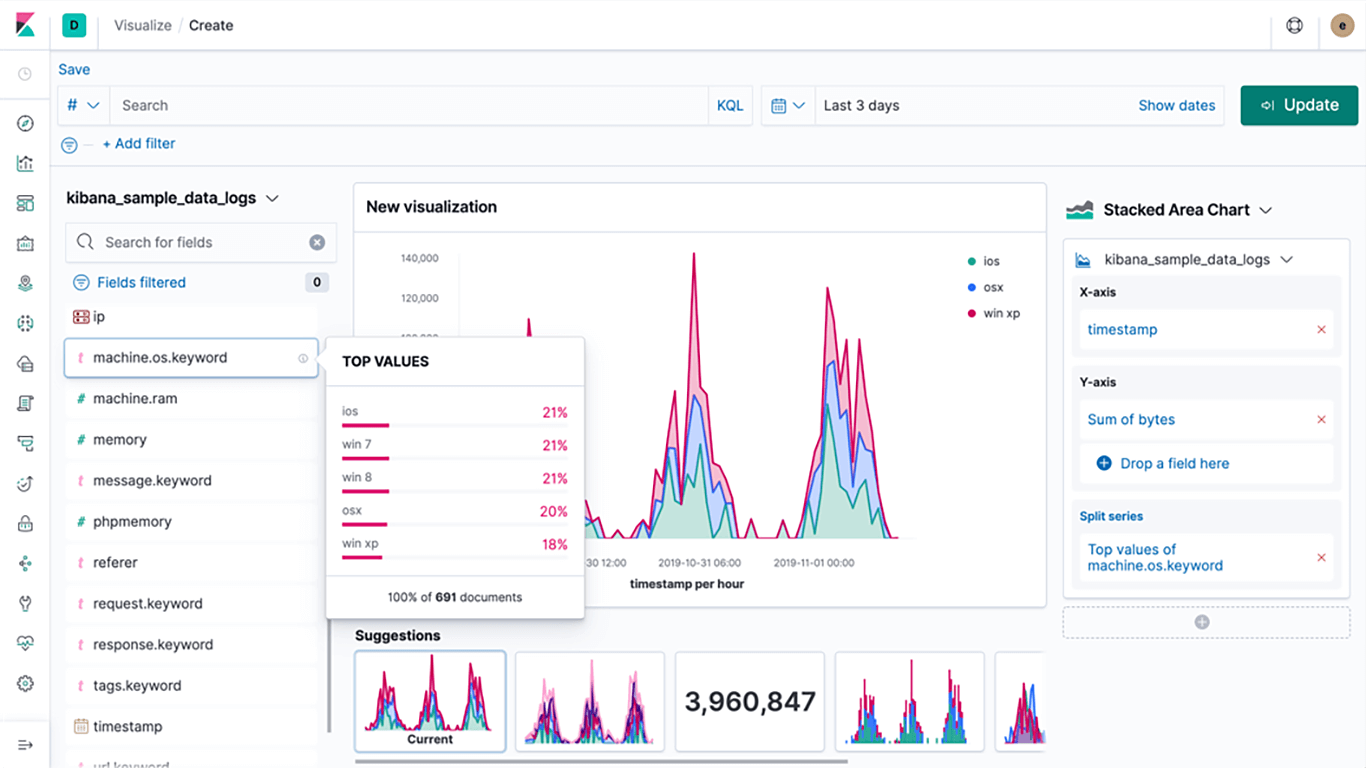
To create a visualization, you need to decide which fields from your data to include. During our user testing, we observed users moving back and forth between different screens to locate the right field to answer their questions. This is often not a trivial task, since the users who are analyzing the data are not necessarily the same users who created the field names, indices, and mappings. In Lens, by selecting a field, you can immediately take advantage of the speed of Elasticsearch and get a preview of the field content for quick context. Looking at the field's value will help you understand whether this is the field needed to answer your question.
Immediate preview
Data visualizations help people understand their data. It sounds simple, but data visualization is often complex, especially when trying to create meaningful visualizations from huge datasets that look at the data in a summarized way.
In Lens, our goal is to make creating visualizations easier for users, as well as to provide surface guidance on best approaches. To support easy creation, dragging a data field into the central window will generate an immediate preview of a chart. No need to configure, no need to choose which aggregation or function; simply drag the field over and see how Lens visualizes your data.
Smart suggestions
We’ve also noticed some common patterns in the way users visualize their data, as well as confusion over how to visualize data effectively. This is an important problem, because often the chart used to display data informs the insights someone can get out of it. In building Lens, we wanted to combine common user patterns with data visualization best practices. Starting from the first preview, Lens provides smart suggestions with alternative ways to visualize the data based on the field selected by the user. These suggestions are based on multiple factors, including the field type, chart type, and other common paths people are using along with a ranking algorithm that sorts them based on their relevance likelihood. The smart suggestions often help users to answer follow-up questions that come to mind after viewing a chart or provide slightly different angles than the visualization currently displayed. Each suggestion also has a description allowing users to quickly understand how it is different than the visualization they are currently looking at. Smart suggestions are the first step in providing recommendations that are personalized to users’ data.
Ad-hoc and reusable
Occasionally you’ll know exactly what type of visualization you need, but more often you have a question in mind that requires data to answer it, and you just start exploring. To answer ad-hoc queries you need the ability to change your mind — the ability to switch between chart types, change the underlying data of a chart to another data source, or even combine multiple index patterns in a single visualization. Lens makes it possible to explore your data in a more freeform way. Best of all, you can save what works and reuse it later as part of a dashboard.
The journey continues
In Kibana we move fast. Looking at our journey, especially in the past few years, the amount of innovation and progress is simply outstanding. We continue to introduce new functionality and address new use cases faster than ever. We believe Kibana Lens is another great step toward our vision of allowing people to get meaningful insights out of their data using powerful capabilities via a simple experience. We deeply appreciate the members of our community who continue to make requests and push us to come up with a better product, as well as the many users who continually provide feedback on Lens.
Harel Insurance Investments and Financial Services Ltd. is currently using Kibana to visualize and explore operations, security, business, and marketing data, and they’ve expressed excitement at the new possibilities introduced by Kibana Lens. “Harel is deeply dedicated to its customers which means ensuring their experience is positive when they interact with our digital services. Elastic’s solutions help us achieve that goal, not only by providing a centralized place to store and analyze critical process data, but also through products like Kibana that let Harel business analysts search and visualize data for key insights,” said Harel CTO Niv Raz. “With the launch of Lens, we’re excited to put the power of simple drag-and-drop analysis, immediate data previews, and automatic visualization best practices into the hands of our people so they can use data faster in support of customer needs.”
Lens is a major milestone in the Elastic journey, and we are excited to continue building and taking it forward. Capabilities like supporting more charts, adding even smarter suggestions, supporting more functions, and allowing for more customizations are at the top of our roadmap. We plan to iterate fast all while continuing to push the boundaries of the data visualization world to deliver a simple and powerful solution.
Get started with Lens today
To get started, spin up a cluster on Elasticsearch Service or install the latest version of the Elastic Stack. Already have Kibana running? Just upgrade your clusters to 7.5 and give Lens a try.
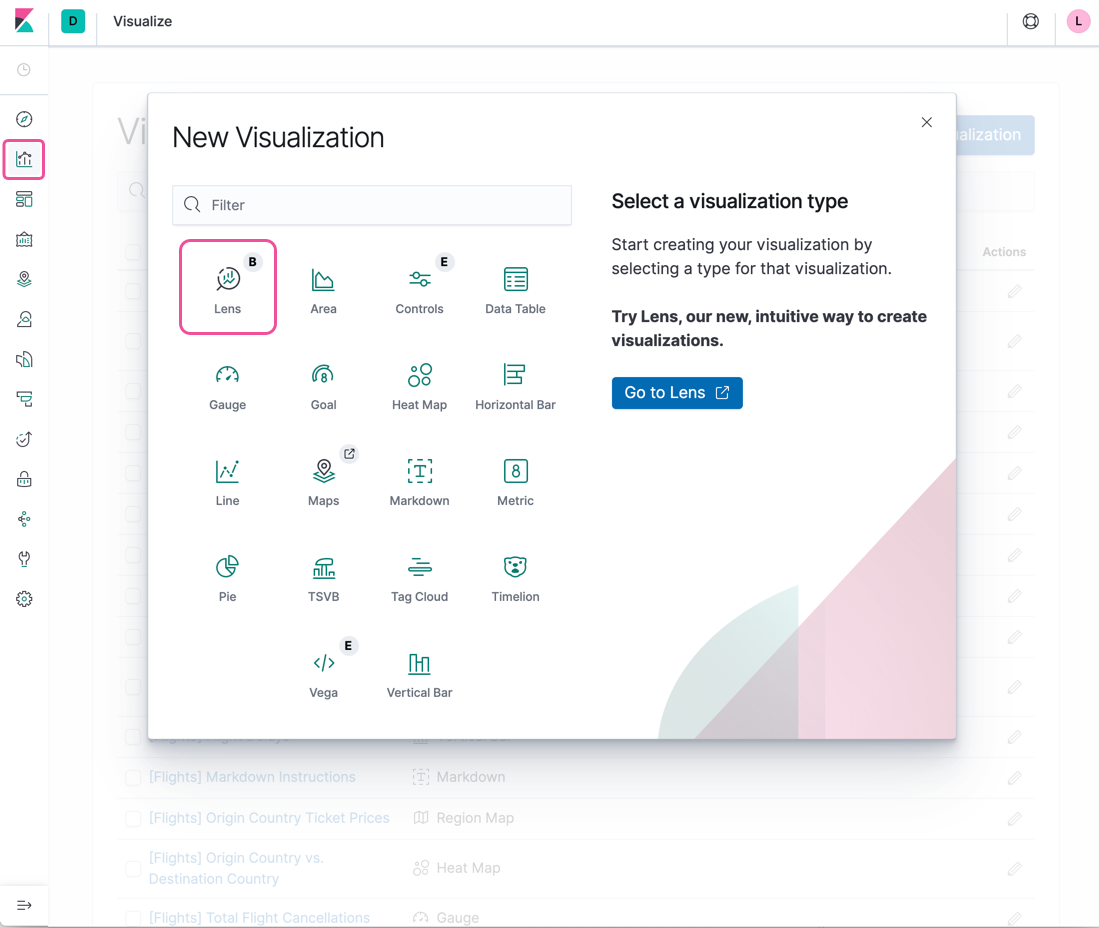
You can find Lens within the Visualize app inside of Kibana. After you’ve created and saved a visualization using Lens, it can be added to a dashboard just like any other visualization.
To simplify your getting started journey, we have some great material to get you started with Lens: