


Getting Started with Canvas in Kibana
| Updated Dec 21, 2018: Canvas ships with Kibana 6.5+ and no longer needs to be installed separately. Canvas also comes ready to roll in the Elasticsearch Service - try it out free for 14-days. |
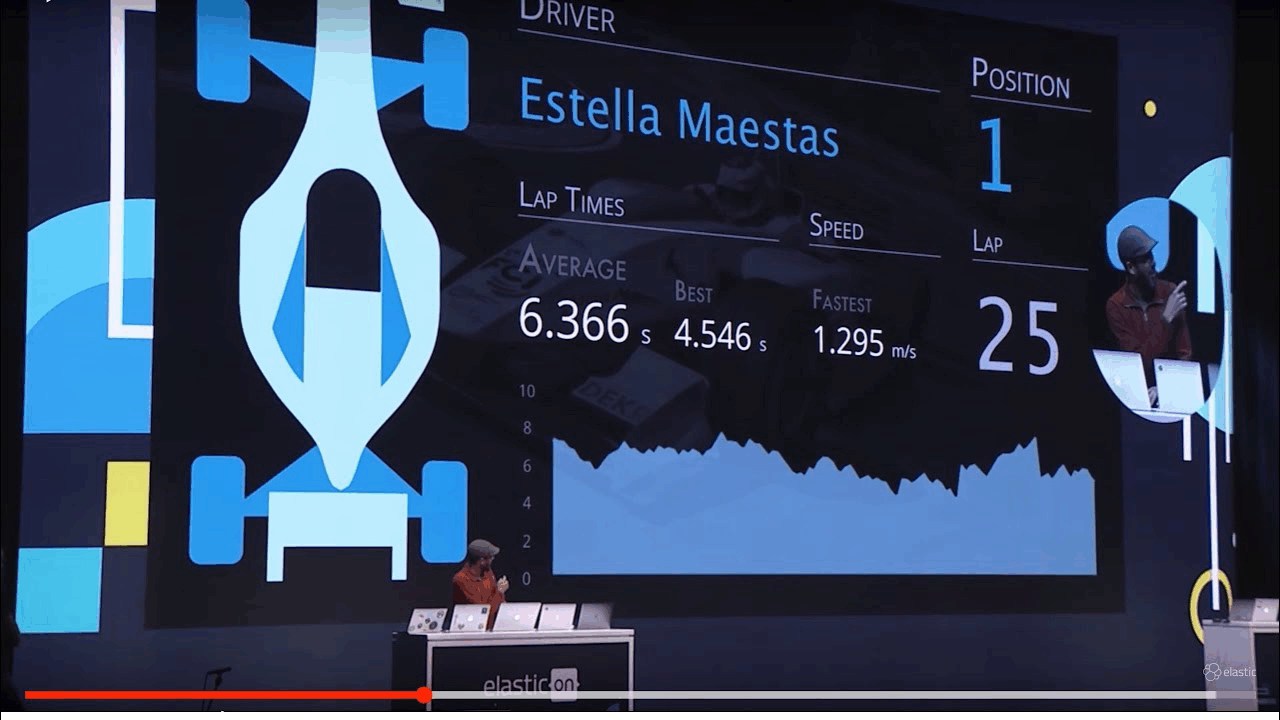
Manually updating scoreboards and presentations is a thing of the past.
Canvas is a presentation tool — built into Kibana — that allows users to create pixel-perfect presentations and slide decks that pull live data directly from Elasticsearch. This means no manual updates for presentations, resulting in up-to-the-minute visuals, chart elements, and graphics. However, Canvas can be many things and has the flexibility to be used for more than just the primary use case presented in this article.
Below is a video of Rashid Khan, the creator of Canvas, presenting his vision for Canvas at Elastic{ON} 2018.
Why use Canvas
Creating a presentation can be a time consuming process, especially when the data being presented requires manipulation in order to make it more palatable to the audience than pure JSON. Even something as simple as taking a screenshot of a bar graph and then dropping the image into a presentation can be tedious if the data in the bar graph needs to be updated regularly. Unfortunately, it's not uncommon to need to export your data, clean it up, paste it into your presentation, add images, and more. This can quickly become a very painful and arduous process.
These concerns don't even begin to address the possibility of adjusting things on the fly (i.e. live during a presentation). Imagine a presentation which contains a slide displaying the company earnings report broken down by quarter. What would happen if, during the presentation, the CEO asked to see the earnings report broken down by month? Either, someone prepared that slide ahead of time, or the presenter is simply forced to say, "Umm, let me get back to you with that information later."
Canvas not only removes the tedium of constantly updating visualizations in a presentation, it also gives its users powerful tools and filters to adjust data on the fly, allowing for very flexible, dynamic, and compelling presentations.
Prerequisites and Installing Canvas
Prerequisites (no need if running in the cloud)
To get started with Canvas, you will need the following:
- Elasticsearch for storing and indexing data
- Kibana for the UI
If you don't already have these installed and running, see Getting started with the Elastic Stack for more information. Also check out this Quick Deploy repo, which provides an easy way to get Elasticsearch and Kibana up and running on a Ubuntu machine within minutes.
Installing Canvas
Starting in version 6.5, Canvas ships with the default distribution of Kibana. Simply install Elasticsearch and Kibana to get started with Canvas or spin up a 14-day Elasticsearch Service trial. (Note: This section was updated in December 2018 to reflect the instructions for version 6.5 and newer)
Data Sources
For the purposes of this tutorial, we're going to use Metricbeat as a quick, easy, and relatively predictable source of live data.
1. Download and Unzip Metricbeat
Visit the Metricbeat download page to download the correct binary for your OS. Once you have downloaded it, go ahead and unpack it. Once unpacked, you will find several files in the Metricbeat directory.
2. Configuring Metricbeat
Next we need to configure Metricbeat to send data to your Elasticsearch instance. Open metricbeat.yml with your favorite code editor. If your Elasticsearch instance is...
- Local: The default configuration is already setup to send data to Elasticsearch (running at
http://localhost:9200), so you shouldn't have to change anything. If you do need to change something, the process is the same as in the next step. - Remote: Go to the Elasticsearch output section and modify it to point to your instance:
setup.kibana:
  host: "url-to-my-kibana-instance:5601"
...
...
output.elasticsearch:
  hosts: ["url-to-my-elasticsearch-instance:9200"]
3. Run Metricbeat
Save the metricbeat.yml file. Then run metricbeat with the -setup option, which will tell the system to load the default metrics dashboards to Kibana.
./metricbeat -c metricbeat.yml -setup -e
TIP: if you add the -e option when running Metricbeat you can see the logs while running.
How to create your first Canvas workpad
Canvas projects are called "workpads". Workpads are analogous to presentations and can have multiple pages.
- Once you have Canvas installed and Metricbeat set up, navigate to your Kibana instance, and select Canvas from the sidebar (as shown below)
- Click "Create workpad"
- Give your workpad a unique name
Anatomy of the Canvas Interface
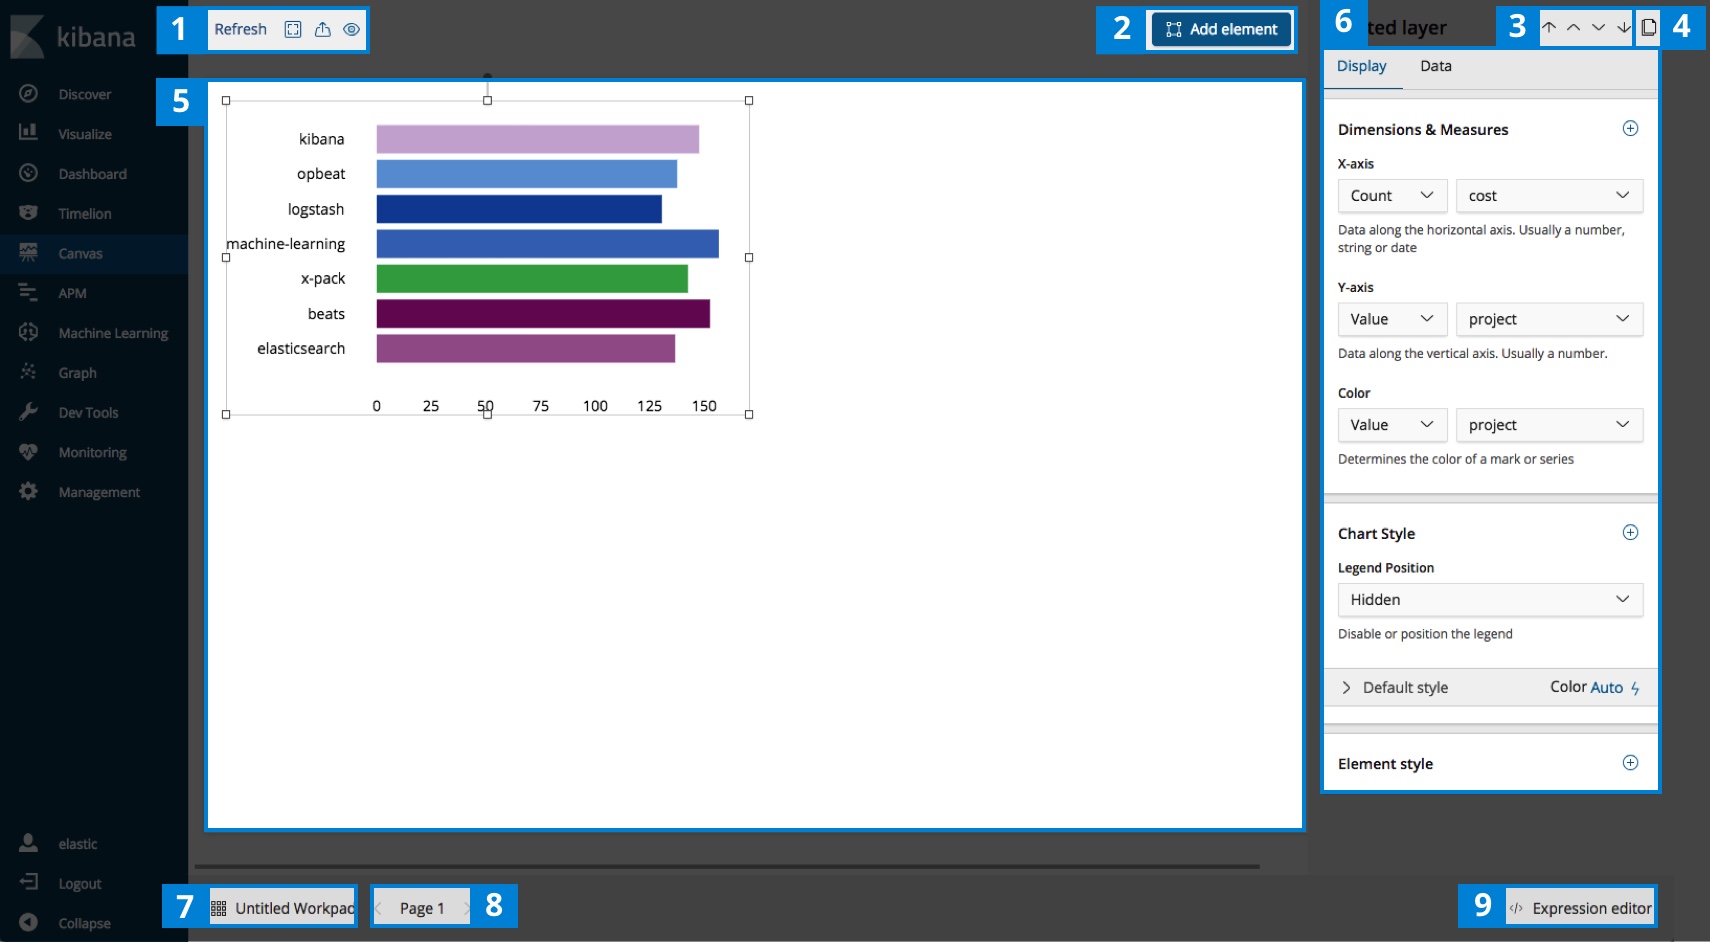
- Buttons
- Data Refresh Interval - Set the interval that Canvas checks for updates from Elasticsearch
- Toggle Fullscreen - Toggles "Presentation mode"
- Export Workpad - Exports the workpad as a PDF file
- Toggle Editing Sidebar - Hides section 6 in the diagram above
- Add Element - This brings up the element picker, so you can add charts, graphs, images, and more to your canvas workpad
- Element Layer Control - Choose which elements are on top, allowing for compositing and hiding
- Duplicate an Element - Note: an element must be selected for this to work
- Canvas Workpad - The main work area
- Editing Controls - Context-aware panel that presents property editing for selected elements, including fonts, colors, custom style sheets, etc.
- Opens Canvas Main Menu - Navigate between workpads, clone, import, export, or delete workpads
- Page Control - Add new pages or switch between existing ones
- Element Code Editor - When in doubt, code it out. Complete flexibility on your queries, formatting, and pipelines (more on this in a later post)
Creating your first elements in Canvas
Element Types
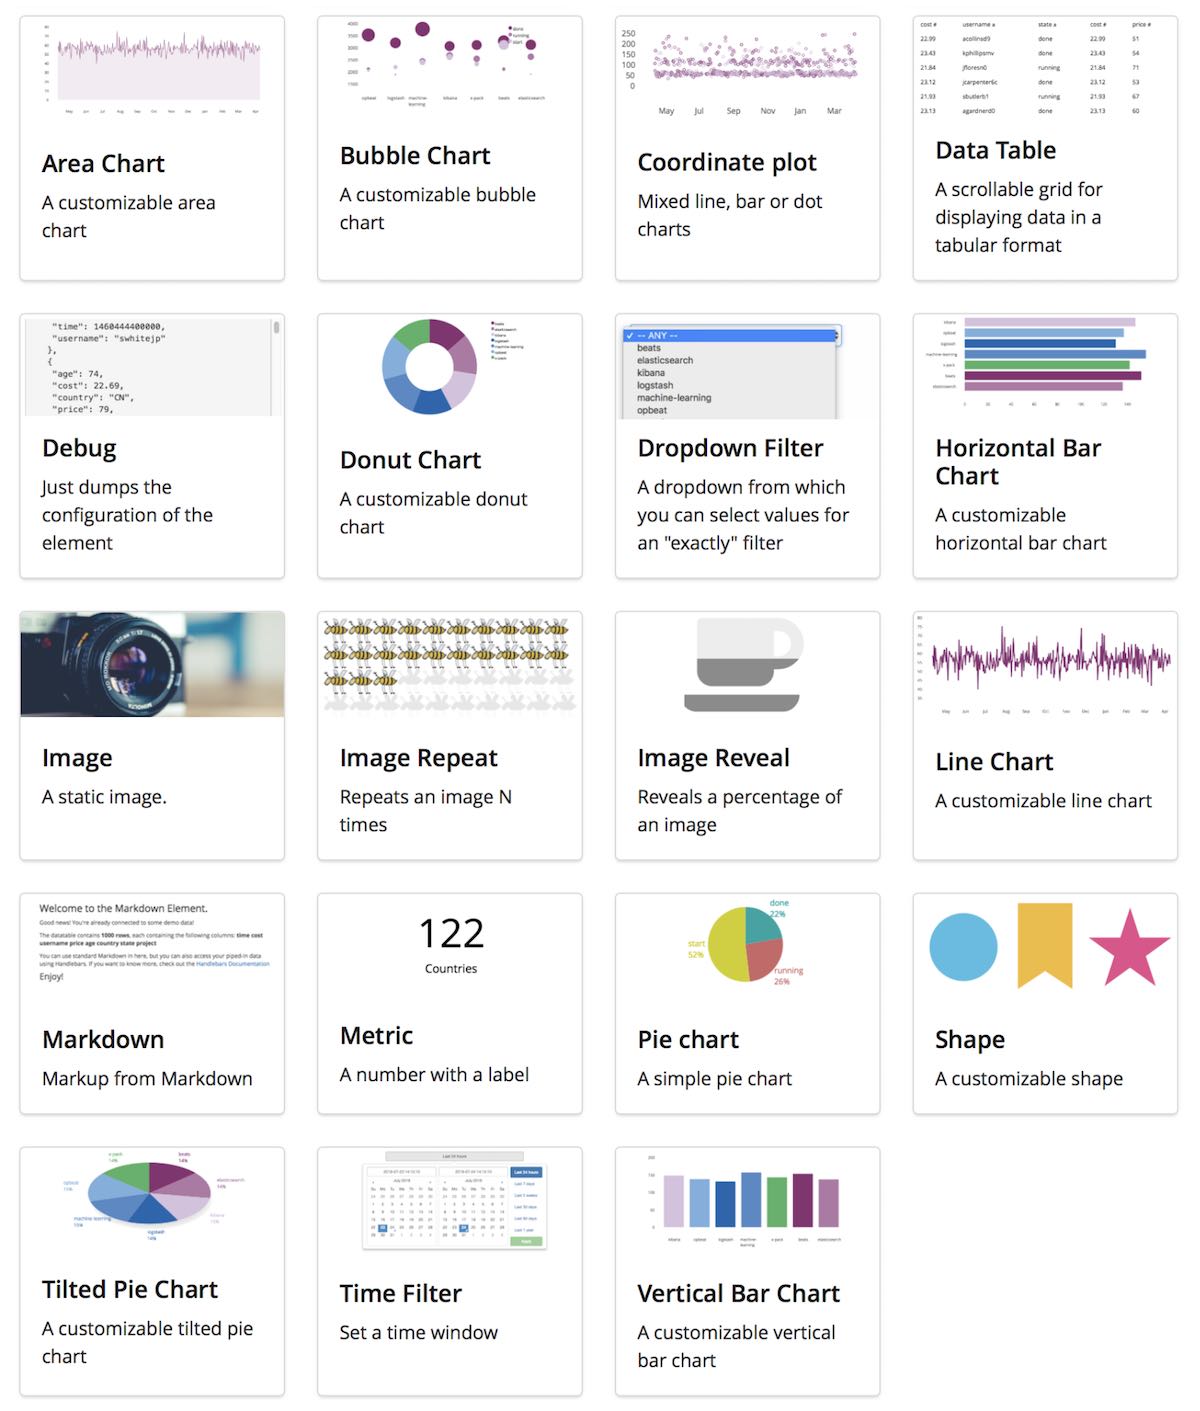
- Click "Add element"
- Canvas comes with many built-in element which we can leverage immediately. Select the "Horizontal Bar Chart" element.
TIP: When an element is first created, it is populated with demo data so you can start playing right away! - In the panel on the right, select the "Data" tab
- Click "Change your data source"
- Select "Elasticsearch Raw Documents"
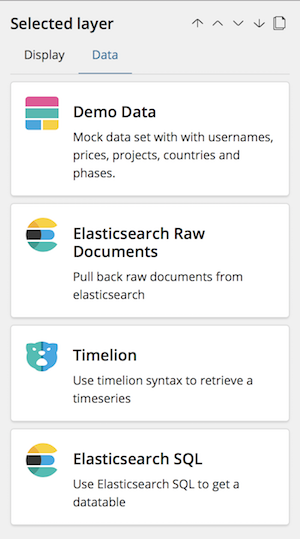
Datasources Explained: - Demo Data: This is a small sample dataset that is used when you first create a new canvas element. Mostly used for testing purposes.
- Elasticsearch Raw Documents: This is allows you to access your raw data in Elasticsearch.
- Timelion: Timelion provides a specialized way for handling your time series data in Elasticsearch.
- Elasticsearch SQL: Similar to Raw Documents, this allows you to access your data in Elasticsearch using SQL syntax feature.
- Select the
metricbeat-*index from the drop down list - Go to the bottom of the sidebar and click "Save"
- Go back to the top of the sidebar, and select the "Display" tab
- We will plot the round-trip time against the name of the metricset, so we set the axes for the bar graph as follows:
- X-Axis:
- Measurement: Value
- Field: metricset.rtt
- Y-Axis
- Measurement: Value
- Field: metricset.name
- Color
- Measurement: Value
- Field: metricset.name
- X-Axis:
Let's add one more element…
- Click "Add element"
- Select the "Metric" element
- Drag it over to somewhere you can see it better
- In the panel on the right, select the "Data" tab
- This time, select "Elasticsearch SQL"
- Type the following into the SQL query editor:
SELECT COUNT(*) FROM metricbeat* - Click "Save"
- Notice that the element now shows a warning. This is because the element is no longer pulling any data.
- At the top of the sidebar, select the "Display" tab
- In the "Numbers" section, set the following:
- Measurement:
Value - Field:
COUNT_1
- Measurement:
- Change the label for this element to be "Entries", since this is showing the number of entries in Elasticsearch
- As long as Metricbeat is still running, we will see this number update live. In the top left-hand side of the screen, click on "Refresh"
- Set the refresh rate to be 5 seconds
- Watch your presentation update with live data!
No more manually updating your presentation!

Links to other helpful resources
That's it! You've just created your first canvas workpad with live data being piped in via Metricbeat. Try adding some other elements to your workpad and experimenting with the capabilities of Canvas!
Also, check out some other Canvas tutorials here:
- Working with Metric and Markdown Elements in Canvas
- Working with Data Table and Debug Elements in Canvas
- But First, Coffee... (An Elastic{ON} Canvas Story)
- Here to Help... (An Elastic{ON} Canvas Story)
Banner Image: "By hand" by Eric Kilby, used under CC BY / Cropped from original